A culture-sensitive semi-quantitative FFQ for use among the
adult population in Nairobi, Kenya: development, validity
and reproducibility
Catarina Vila-Real
1, Ana Pimenta-Martins
1, Jack-Susan Magu
2, Catherine Kunyanga
2,
Samuel Mbugua
2, Kati Katina
3, Ndegwa H Maina
3, Ana MP Gomes
1and
Elisabete Pinto
1,4,*
1Universidade Cat´olica Portuguesa, CBQF– Centro de Biotecnologia e Química Fina – Laborat´orio Associado, Escola Superior de Biotecnologia, 4169-005 Porto, Portugal:2Faculty of Agriculture, Department of Food Science, Nutrition and Technology, University of Nairobi, 00625 Nairobi, Kenya:3Department of Food and Environmental Sciences, Division of Food Technology, University of Helsinki, 00014 Helsinki, Finland:4EPIUnit– Instituto de Saúde Pública, Universidade do Porto, 4050-600 Porto, Portugal
Submitted 23 September 2019: Final revision received 26 March 2020: Accepted 4 May 2020 Abstract
Objective: To develop a semi-quantitative FFQ and to evaluate its validity and reproducibility for the assessment of total dietary intake of Kenyan urban adult population, given its non-existence in Kenya.
Design: The current study adopted a cross-sectional design. A culture-sensitive semi-quantitative FFQ was developed and its validity was tested relative to three non-consecutive 24-h recalls (24hR). Reproducibility was tested by the test–retest method, with a 3-week interval. Spearman’s correlation coefficients and intra-class correlation coefficients were calculated for several macro- and micronutrients. Cross-classification into quartiles and Bland and Altman plots were analysed. Setting: Nairobi county (Dagoreti South and Starehe constituencies).
Participants: A convenient sample was recruited in three different clusters in Nairobi.
Results: A culture-sensitive 123-food-item semi-quantitative FFQ showed higher nutrient intakes compared with the 24hR (total energy median 12543·632 v. 8501·888 kJ, P< 0·001). Energy-adjusted and deattenuated Spearman’s correla-tions for macronutrients ranged between 0·21 (total fat) and 0·47 (protein). The agreement in the same quartile varied from 28 % (protein) to 41 % (carbohydrates). Including adjacent quartiles, the range increased: 76 % (protein and fat) to 81 % (carbohydrates). The extreme disagreement was low. The first FFQ application resulted in higher mean values for all nutrients compared with the second FFQ (total energy median 12459·952 v. 10485·104 kJ, P< 0·001). Energy-adjusted cor-relations for macronutrients ranged from 0·28 (carbohydrates) to 0·61 (protein). Intra-class correlation coefficients for macronutrients were moderate, between 0·6 and 0·7.
Conclusions: The developed semi-quantitative FFQ was shown to be a valid and reproducible tool for ranking urban adult Kenyans according to their dietary intake. Keywords FFQ 24-h recalls Validity Reproducibility Kenya
Urbanisation is growing in African countries, namely in Kenya, and consequently people’s lifestyles are under-going an adaptation, and parameters such as diet and physical activity are changing as well(1). Urban areas are
characterised by diets rich in fat, sugar, more milled and
polished grains, and processed foods(2). Along with scarce
physical activity, such a lifestyle could lead to the develop-ment of or the worsening of non-communicable diseases (NCD). In 2016, 78 % of all deaths in low- and middle-income countries were due to NCD. In fact, in low-middle-income
*Corresponding author: Email epinto@porto.ucp.pt
countries, around 21 % of the population between 30 and 70 years of age are expected to die from CVD, cancers, chronic respiratory diseases or diabetes(3).
These numbers demand bigger efforts in terms of health strategies and nutritional interventions in order to improve the population health status. Considering the huge role that dietary patterns can play, it is of utmost importance to understand quantitatively their impact in this group of diseases. However, in lower-middle-income countries, this work is scarce or insufficiently documented, probably due to a lack of resources and logistical constraints. The lack of reliable dietary assessment methodologies might be one of the major reasons that justifies this absence of nutritional data(4,5). Dietary intake studies in Kenya have been carried
out by the application of 24-h recalls (24hR)(6–12), either
single or multiple, and in some occasions applied together with an FFQ(13–15), mainly qualitative and over a 7-d
period(4). Since a 24hR is time-consuming and does not
cover a wide period, being insufficient to fully describe the usual intake, there is an emergent need for the develop-ment, validity and standardisation of tools for measuring and monitoring food intake. Hence, it is crucial to use a reproducible and valid tool, sensitive to the target popula-tion’s culture, in order to assure consistent, accurate, true and reliable measurements. FFQ has proven to generate good results for the assessment of dietary intake in large epidemiological studies, being a suitable tool to study the association between diet and disease(16).
Since there is no validated FFQ available for the target population under study, this research work aims to report in detail the process of development and testing for the validity and reproducibility of a semi-quantitative FFQ, culturally adapted to the urban adult Kenyan population and suitable for a dietary assessment during a 1-month period.
Methods
Study design and recruitment of participants This cross-sectional study was carried out in Nairobi county (different constituencies), Kenya, and performed in two phases: phase 1, development of a semi-quantitative FFQ; phase 2, test for validity and reproducibility of the developed FFQ.
Phase 1: Development of a semi-quantitative FFQ An FFQ intended to report dietary intake during the pre-vious month was designed and constructed considering the food patterns of Kenyan urban adult population. A list of food items was compiled by accessing different sources and crossing it with information on generally consumed foods, namely different questionnaires applied in Kenyan and other African populations(13,17–23), thirty food records of Kenyan people obtained in a previous pilot study (not published), and Kenyan National Food Composition
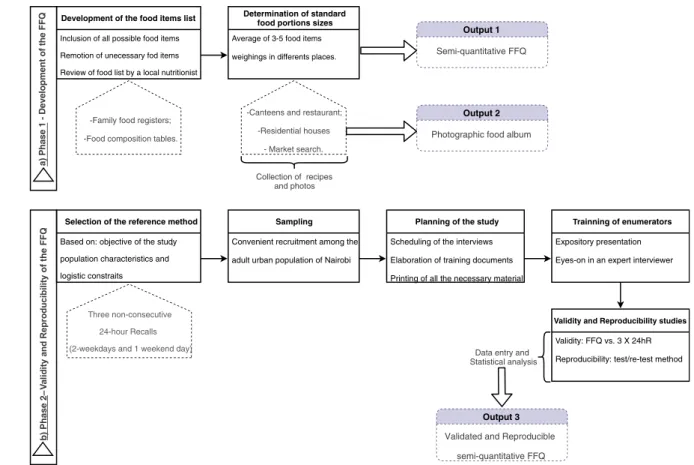
Tables. For the composite dishes included in the FFQ, recipes from native people, local restaurants and from the internet were collected and analysed in order to determine a standardised recipe. The compiled food list was evaluated by local nutritionists for further adaptation. After preparing the food list, standard portion sizes were established. For packed foods sold as single units, a market survey and personal observations were conducted, and the most commonly consumed quantity was used as the standard portion. For unpacked foods sold as single units (e.g., fresh fruit), three samples of each (edible part) were weighed and the average weight was used as the standard portion. For composite dishes and cooked foods, three canteens, eleven residential houses and one restaurant were accessed to obtain several weight measurements. Consequently, the average value from all the measure-ments was used as the standard portion. To calculate the smallest and the largest portions, the standard portion was multiplied by the following factors: 0·75 and 1·5, respectively. During all the visits, pictures of portions were taken and used for the construction of a photographic food album. The methodological design for this phase is outlined in Fig. 1(a).
Phase 2: Validity and reproducibility studies
To determine the relative validity of the developed FFQ, the results obtained by the application of the first FFQ were compared with those from the applied three non-consecutive 24hR. To test reproducibility, the FFQ was applied on two different occasions to the same group of people.
Several Kenyan volunteers were recruited. Each respondent was informed the objectives of the current study, and written informed consent, according to the Declaration of Helsinki of the World Medical Association, was obtained from those who agreed to participate.
Five interviewers from the University of Nairobi (UN) Department of Food Science, Nutrition and Technology with nutrition background were recruited. All the inter-viewers were given training and guiding documents in order to standardise the interviews, ensuring the quality of data to be obtained. The FFQ was written in English, and consequently, interviews were conducted in this language, one of the official languages, apart from Swahili. Casually, there was a need for translation to Swahili for some of the food items. The methodological design for this phase is outlined in Fig. 1(b).
Data collection
Data were collected by trained interviewers using struc-tured questionnaires. The study protocol was composed of five interviews: in the first, the respondents answered a general questionnaire and the FFQ; in the next three interviews, the respondents were asked to recall dietary intake in the previous 24 h (the interviews were separated by a minimum gap of 2 d); in the fifth and last interview, the
respondents answered, once again, the FFQ (the two FFQ were applied 21 d apart). All interviews were conducted by the same interviewer, trying to minimise inter-rater bias. The general questionnaire included questions about demographic data, anthropometrics, lifestyles and health status. In 24hR, the respondents gave detailed information about everything they ate and drank in the previous 24 h, from the time they woke up the day before until they woke up on the interview day. Every respondent was asked to recall 2 weekdays and 1 weekend day, aiming the dietary intake information to be as comprehensive as possible. During 24hR, to facilitate the estimation of food portion sizes, the interviewers used the developed photographic album. Every time the respondent mentioned a composite dish, an estimation of consumed ingredients or, in its absence, the quantities used during dish preparation was requested and registered whenever possible.
Data computation
Considering the FFQ, each food portion (weight in grams) was multiplied by the respective frequency of consumption and divided by the number of days corresponding to the frequency of consumption in order to estimate daily consumptions of each food item. All the food items of the FFQ and 24hR were coded, resorting to
the Food Processor® software, version SQL 11.0.3
(ESHA Research), which includes US Department of
Agriculture’s Food and Nutrient Database for Dietary
Studies, Canadian Nutrient File and UK Foods database along with manufacturer and restaurant data. In order to better choose the most adequate code for each food within the range of existing items in Food Processor®, a
compre-hensive and detailed comparison between the nutritional compositions in Food Processor®and the foods consumed
in Nairobi (by assessing Kenyan Food Composition Tables) was performed by two nutritionists. When a food item was absent in the software or the nutritional composition of the Kenyan native food was different, data from the Kenyan Food Composition Tables were used to supplement
Food Processor®. The recipes of composite dishes,
obtained from native Kenyans, were also added to Food
Processor® software. These codes were organised in a
codification manual and used for the conversion of foods into nutrients. This manual was constructed to warrant the systematisation of questionnaire codification. Informa-tion from the FFQ was introduced in a Microsoft Access®
database, and information from 24hR was introduced into the Food Processor®. Resulting nutrient information from
both databases was exported to Microsoft Excel®for further
statistical analyses. Statistical analysis
A power calculation was performed for sample size determination. Statistical power was established as 90 %, Development of the food items list
Inclusion of all possible food items Remotion of unecessary fod items Review of food list by a local nutritionist
-Family food registers; -Food composition tables.
Determination of standard food portions sizes Average of 3-5 food items weighings in differents places.
-Canteens and restaurant; -Residential houses - Market search. Output 1 Semi-quantitative FFQ Collection of recipes and photos Output 2
Photographic food album
b) Phase 2 – V al id it y a nd Repr oduci b il it y of the FFQ
Selection of the reference method Based on: objective of the study, population characteristics and logistic constraits
Three non-consecutive 24-hour Recalls (2-weekdays and 1 weekend day)
Sampling Convenient recruitment among the adult urban population of Nairobi
Planning of the study Scheduling of the interviews Elaboration of training documents Printing of all the necessary material
Trainning of enumerators Expository presentation Eyes-on in an expert interviewer
Validity and Reproducibility studies Validity: FFQ vs. 3 X 24hR Reproducibility: test/re-test method
Data entry and Statistical analysis
Output 3
Validated and Reproducible semi-quantitative FFQ
a) Phase 1 - Development of the FFQ
two-sided significance level as 0·05 and correlation of 0·4 was based on previous validity studies. The combina-tion of those indicated a minimum sample of sixty respon-dents. Considering a dropout rate of 20 %, researchers set a sample size of seventy-five individuals. Descriptive data were calculated as frequencies (%) and presented as means and standard deviations for normally distributed variables.
The Kolmogorov–Smirnoff test was used to study the
variables’ distribution normality. In order to determine absolute nutrient intakes, estimated for both methods, medians and quartiles were calculated, rather than means and standard deviations, mainly to avoid major influences of extreme intakes. The Wilcoxon test was used to compare medians of absolute nutrient intakes estimated for both methods in the validity study and for both applications of the FFQ in the reproducibility study.
The correlation between FFQ (FFQ1) and the mean of three 24hR was studied by calculating unadjusted, energy-adjusted and deattenuated Spearman’s correlation coefficients. Nutrients’ energy adjustment was conducted using the residual method(16). Deattenuated correlation
coefficients were used to adjust for random within-subject variability in three 24hR(24). Ranking agreement between
the FFQ and 24hR was quantified as a percentage of
subjects who were categorised in the same (complete agreement) and/or adjacent and in the opposite nutrient quartiles (extreme disagreement). Bland–Altman plots(25)
were also examined for each nutrient.
To evaluate the reproducibility of the FFQ, the correlation between the two applications was studied by
calculating unadjusted and energy-adjusted Spearman’s
correlation coefficients. Moreover, intra-class correlation (ICC) coefficients between both FFQ were calculated.
Statistical analyses were conducted using IBM® SPSS®
Statistics, version 23 (SPSS Inc., Chicago, IL, USA). Results
Phase 1: Development of the semi-quantitative FFQ The final food list had 123 food items distributed over eleven food groups (namely cereals and grain products; vegetables; legumes, pulses, seeds and nuts; fruits; meat, fish and eggs; dairy products; fats and oils; sauces, seasonings and flavourings; sugar, syrups, sweets and snacks; beverages; composite dishes). Three portion size options were estab-lished– the standard portion, a smaller and a bigger portion – using the standard portion size as comparison term. The frequency of consumption was recorded in nine pre-specified categories from ‘never or less than once per month’ to‘six or more times per day’, as suggested by Willet(16). Phase 2: Validity and reproducibility studies Subjects
A total of seventy-five volunteers took part in the current study: thirty-five from the UN Kabete Campus,
ten from a residential area in Uthiru (Dagoreti South constituency) and thirty from the UN Main Campus (Starehe constituency). For the validity study, it is not imperative to obtain a representative sample; however, it is advisable that it be heterogeneous in order to represent different food consumption patterns(16). Consequently,
young, middle-aged and older women and men were included, and the job category was used as a proxy for socioeconomic status.
Of the seventy-five participants enrolled in the current study, a total of seventy-one (94·7 %) completed the three recalls, three (n 3, 4 %) only completed two recalls and one FFQ, and one (n 1, 1·3 %) did not complete any recall. These latter respondents were therefore excluded from the final sample. Furthermore, respondents who had a daily dietary intake >20 920 kJ (n 3, 4·2 %) were considered outliers and, consequently, were also excluded. For the validity study, the final sample was composed of sixty-eight (90·7 %) respondents, and the first applied FFQ was used to be tested against the three recalls. In the case of reproduc-ibility study, data from the first and last interviews (first and second application of the FFQ) were analysed. Besides the previously mentioned individuals with daily intake >20 920 kJ (n 3), four other individuals did not reply to the second FFQ and, consequently, were also excluded. The final sample for the reproducibility study included sixty-eight (90·7 %) participants. Data collection took place in April 2016.
The sociodemographic profile of participants (n 69), in both validity and reproducibility studies, is presented in Table 1 (sixty-seven participants were common to both studies; in what concerns the other two from the sixty-nine, one only participated in the validity study and the other only in the reproducibility study). The mean age of the
sample was 27·7± 7·7 years, with 48 % being women
(n 33) and 52 % being men (n 36). At the time of interview, 46 % (n 32) of respondents had a job (self-employed or employee), while the other 54 % (n 37) were students or casual labourers. More than half (62 %, n 43) of participants had no children under their care at home. According to lifestyle habits, almost the whole sample (96 %, n 66) reported to be a non-smoker; however, 30 % claimed to be regular consumers of alcoholic beverages (18 % (n 6) of women and 42 % (n 15) of men). More than half of respondents (67 %, n 46) ate three meals a day, namely breakfast, lunch and dinner.
Validity study
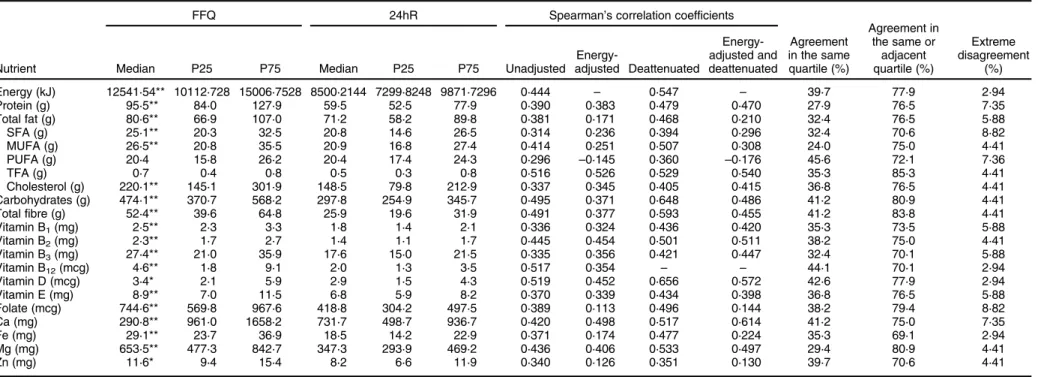
Table 2 shows a comparison between absolute daily nutrient intakes estimated by the first semi-quantitative FFQ and by the three non-consecutive 24hR. Intakes are expressed in medians, 25th and 75th percentiles. For almost all nutrients, the FFQ resulted in higher values compared with the mean value of three recalls. Values were similar only for total fat, PUFA, trans-fatty acids (TFA) and vitamin D.
Spearman’s correlation coefficients (unadjusted, energy-adjusted and/or deattenuated) between both methods are also shown in Table 2. For all macronutrients, the unadjusted correlations were>0·38. Vitamin B12, vitamin D,
TFA, carbohydrates and total fibre were the nutrients with higher crude correlation coefficients (0·52, 0·52, 0·52, 0·50 and 0·49, respectively). When energy-adjusted, these cor-relations tended to decrease. However, for some nutrients the correlation factor slightly increased, namely for TFA (from 0·52 to 0·53), cholesterol (from 0·34 to 0·35),
vitamin B3 (from 0·34 to 0·36) and Ca (from 0·42 to
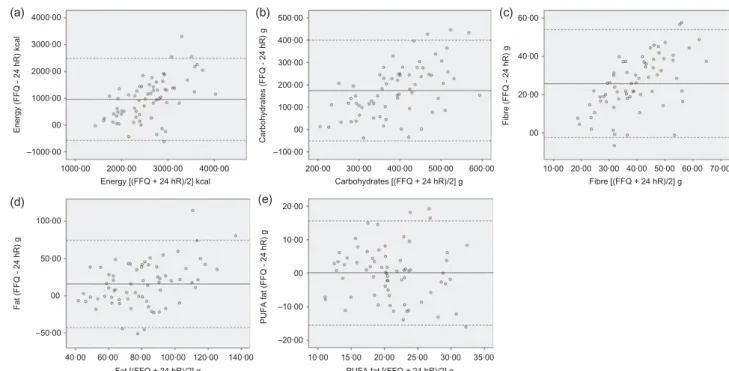
0·50). The adjustment for random within-person day-to-day intake variation in recalls made the coefficients increase (unadjusted v. deattenuated and energy-adjusted v. energy-adjusted and deattenuated). Energy-adjusted and deattenuated coefficients ranged between 0·130 (Zn) and 0·614 (Ca). For macronutrients, these values were higher, with the exception of fat. The analysis of Bland– Altman plots made possible to recognise that the agree-ment for energy [Fig. 2(a)], carbohydrate [Fig. 2(b)], total fibre [Fig. 2(c)], total fat [Fig. 2(d)] and PUFA [Fig. 2(e)] was moderate.
The levels of agreement in the same quartile, adjacent quartiles and extreme disagreement were also deeply studied and are expressed in Table 2. According to the results for envisaged nutrients, on average, 36·7 and 75·9 % of participants were classified into the same quartile (the values ranged from 24·0 % for MUFA to 45·6 % for PUFA) and into the same or adjacent quartiles (85·3 % for TFA and 69·1 % for Fe). Only 5·2 % were classified in opposite quartiles (2·94 % for energy, vitamins B12, vitamin D and Fe,
and 8·8 % for folate and SFA). Reproducibility study
In general, the participants tended to report higher intakes in the first application of the FFQ. In terms of the studied
nutrients, crude Spearman’s correlations were high,
reporting an average value of 0·62 (ranging between 0·37 for vitamin D and 0·70 for Ca). Adjustments for total energy tended to decrease correlations, ranging between
0·15 for PUFA and 0·65 for niacin (vitamin B3). ICC
coefficients ranged between 0·166 for vitamin B12 and
0·704 for Mg. The correlations observed for macronutrients
were all >0·6. Table 3 shows a comparison between
absolute daily nutrient intakes estimated by the first application and the second application of the semi-quantitative FFQ.
In order to organise the collected information from the current study, details on previous studies that tested the validity of the FFQ among adults were explored, and the results of this exploitation are presented in the Appendix in online supplementary material.
Discussion
The present article reports the findings of this cross-sectional study involving the development, validity and reproducibility studies of a 123-food-item semi-quantitative FFQ carried out among urban adult Kenyans. Overall, the FFQ was shown to be reproducible and valid, standing out as a valuable tool to rank individuals according to dietary intake.
Development of the FFQ
In the first phase, the authors considered the need to develop a well-established food list. Long lists might cause boredom on participants; however, they have to be comprehensive enough to include the most common items. The researchers selected food items based on three important aspects: the items had to be usual for a significant number of people; the items had to be nutritive; and to be discriminating, their consumption had to vary from person to person(16). The frequency response section was
circum-scribed to nine categories in order to discriminate between highly consumed and less consumed items and to avoid loss of information. In what concerns food portion informa-tion, the definition of a standard portion for each item tried
Table 1 Characteristics of participants in both studies (validity and reproducibility) (n 69) by the application of the general questionnaire n % Age (years) ≤25 33 47·8 26–29 13 18·8 30–34 14 20·3 35–39 5 7·2 ≥40 4 5·8 Gender Female 33 47·8 Male 36 52·2 Education level None 1 1·5 Secondary 45 65·2 Tertiary 23 33·3 Occupation Student 29 42·0 Casual labourer 8 11·6 Self-employed 5 39·1 Formally employed 27 39·1 Marital status Married 25 36·2 Single 44 63·8
Number of children living at home
0 43 62·3 1–2 23 33·3 3–4 3 4·3 Smoking habit Yes 3 4·3 No 66 95·7 Alcohol consumption Yes 21 30·4 No 48 69·6
Number of meals per day
2 6 8·7
3 46 66·7
Table 2 Absolute daily nutrient intakes estimated by the semi-quantitative FFQ and three non-consecutive 24-h recalls (24hR), Spearman’s correlation coefficients (for unadjusted and energy-adjusted
and deattenuated values) and level of agreement and disagreement between both methods (FFQ and 24hR) (n 68)
Nutrient
FFQ 24hR Spearman’s correlation coefficients
Agreement in the same quartile (%) Agreement in the same or adjacent quartile (%) Extreme disagreement (%)
Median P25 P75 Median P25 P75 Unadjusted
Energy-adjusted Deattenuated Energy-adjusted and deattenuated Energy (kJ) 12541·54** 10112·728 15006·7528 8500·2144 7299·8248 9871·7296 0·444 – 0·547 – 39·7 77·9 2·94 Protein (g) 95·5** 84·0 127·9 59·5 52·5 77·9 0·390 0·383 0·479 0·470 27·9 76·5 7·35 Total fat (g) 80·6** 66·9 107·0 71·2 58·2 89·8 0·381 0·171 0·468 0·210 32·4 76·5 5·88 SFA (g) 25·1** 20·3 32·5 20·8 14·6 26·5 0·314 0·236 0·394 0·296 32·4 70·6 8·82 MUFA (g) 26·5** 20·8 35·5 20·9 16·8 27·4 0·414 0·251 0·507 0·308 24·0 75·0 4·41 PUFA (g) 20·4 15·8 26·2 20·4 17·4 24·3 0·296 –0·145 0·360 –0·176 45·6 72·1 7·36 TFA (g) 0·7 0·4 0·8 0·5 0·3 0·8 0·516 0·526 0·529 0·540 35·3 85·3 4·41 Cholesterol (g) 220·1** 145·1 301·9 148·5 79·8 212·9 0·337 0·345 0·405 0·415 36·8 76·5 4·41 Carbohydrates (g) 474·1** 370·7 568·2 297·8 254·9 345·7 0·495 0·371 0·648 0·486 41·2 80·9 4·41 Total fibre (g) 52·4** 39·6 64·8 25·9 19·6 31·9 0·491 0·377 0·593 0·455 41·2 83·8 4·41 Vitamin B1(mg) 2·5** 2·3 3·3 1·8 1·4 2·1 0·336 0·324 0·436 0·420 35·3 73·5 5·88 Vitamin B2(mg) 2·3** 1·7 2·7 1·4 1·1 1·7 0·445 0·454 0·501 0·511 38·2 75·0 4·41 Vitamin B3(mg) 27·4** 21·0 35·9 17·6 15·0 21·5 0·335 0·356 0·421 0·447 32·4 70·1 5·88 Vitamin B12(mcg) 4·6** 1·8 9·1 2·0 1·3 3·5 0·517 0·354 – – 44·1 70·1 2·94 Vitamin D (mcg) 3·4* 2·1 5·9 2·9 1·5 4·3 0·519 0·452 0·656 0·572 42·6 77·9 2·94 Vitamin E (mg) 8·9** 7·0 11·5 6·8 5·9 8·2 0·370 0·339 0·434 0·398 36·8 76·5 5·88 Folate (mcg) 744·6** 569·8 967·6 418·8 304·2 497·5 0·389 0·113 0·496 0·144 38·2 79·4 8·82 Ca (mg) 290·8** 961·0 1658·2 731·7 498·7 936·7 0·420 0·498 0·517 0·614 41·2 75·0 7·35 Fe (mg) 29·1** 23·7 36·9 18·5 14·2 22·9 0·371 0·174 0·477 0·224 35·3 69·1 2·94 Mg (mg) 653·5** 477·3 842·7 347·3 293·9 469·2 0·436 0·406 0·533 0·497 29·4 80·9 4·41 Zn (mg) 11·6* 9·4 15·4 8·2 6·6 11·9 0·340 0·126 0·351 0·130 39·7 70·6 4·41
SFA, saturated fatty acids; MUFA, monounsaturated fatty acids; PUFA, polyunsaturated fatty acids; TFA, Trans-fatty acids.
Median values were significantly different from those estimated from repeat recalls: *P < 0·05, **P < 0·001; P-values were calculated using the non-parametric Wilcoxon signed-rank test.
6
C
Vila-Real
et
to facilitate the process of describing quantities by participants. The food weighting study allowed the estab-lishment of portion sizes in a way that subjects were able to conceptualise the unit and relate it to their own habits. This procedure was successfully achieved for most items; however, some challenges emerged and will be discussed below. Although the layout of the questionnaire was explicit by itself, and though liable to be self-administrated, the population under study had revealed some difficulties in clearly visualising the portion sizes and bearing in mind the period that was being covered in terms of consumption. Consequently, the research team found more reliable, feasible and ascertained to do face-to-face interviews.
Reproducibility study
In order to assess reproducibility, FFQ was applied twice, within a period of 21 d. This FFQ captured the consumption of the previous month, so ideally the second questionnaire should be applied 30 d apart, at maximum. The authors tried to maximise this interval in order to avoid memorisa-tion problem between the first and second applicamemorisa-tion. Nevertheless, memorisation was likely difficult due to the large number of food items in this FFQ.
According to the reported results, it is clear that the second administration provided lower intakes than the first FFQ, and consequently, these values were closer to those of 24hR. Other studies experienced the same, that is, during the first FFQ administration, respondents gave answers that resulted in higher intakes(22,26–28). This might be explained by the acquisition of the ability to answer
questions over time. According to Willet(16), the processing
of diet recalling might modify consciousness of food intake and, consequently, improve accuracy in completing the questionnaire.
In the current study, crude Spearman’s correlations varied between 0·37 (vitamin D), the only nutrient that had correlations<0·50, and 0·70 (Ca). For macronutrients, the values were all >0·66, showing a good association. Adjustments for total energy tended to decrease correla-tions. Jackson et al.(22)and Mouratidou et al.(27)obtained results similar to those of the current study, except for vitamin D. In contrast, other studies revealed poorer correlations(29–31). The studies of Papazian et al.(32) and Silva-Jaramillo et al.(26) also resorted to ICC to evaluate the reproducibility of the FFQ; however, correlations from both research were higher than those observed in the current study. Nevertheless, ICC coefficients >0·6 showed that within-person variation was not very high, showing moderate reliability(33).
Validity study
The developed FFQ presented higher nutrient intakes compared with multiple recalls, thus showing moderate agreement. According to Willet(16), such a difference
observed between the two methods is common. Similar results were obtained by other investigators(22,26,29,34,35)in
the assessment of dietary intakes in adults. The main sources of errors in the FFQ and, consequently, the causes of overestimation are fixed list of foods, memory (medium-term memory, in this case), perception of portion sizes and
(a) (b) 1000·00 –1000·00 –100·00 100·00 00 20·00 40·00 60·00 200·00 300·00 400·00 500·00 00 1000·00 Energy (FFQ - 24 hR) kcal Carbohydrates (FFQ - 24 hR) g Energy [(FFQ + 24 hR)/2] kcal 40·00 60·00 80·00 100·00 120·00 140·00 –50·00 –20·00 –10·00 00 10·00 20·00 50·00 100·00 00 Fat (FFQ - 24 hR) g PUFA fat (FFQ - 24 hR) g Fat [(FFQ + 24 hR)/2] g 10·00 15·00 20·00 25·00 30·00 35·00 PUFA fat [(FFQ + 24 hR)/2] g Carbohydrates [(FFQ + 24 hR)/2] g Fibre [(FFQ + 24 hR)/2] g Fibre (FFQ - 24 hR) g 2000·00 3000·00 4000·00 00 2000·00 3000·00 4000·00 200·00 300·00 400·00 500·00 600·00 10·00 20·00 30·00 40·00 50·00 60·00 70·00 (c) (d) (e)
Fig. 2 Bland–Altman plot between FFQ and three non-consecutive 24-h recalls estimating total energy intake: (a) total energy, (b) carbohydrates, (c) total fibre, (d) total fat and (e) polyunsaturated fat. The solid line represents the mean difference in absolute intake between the two methods, and the dashed lines represent the limits of agreement (mean± 1·96 ×SDof the difference)
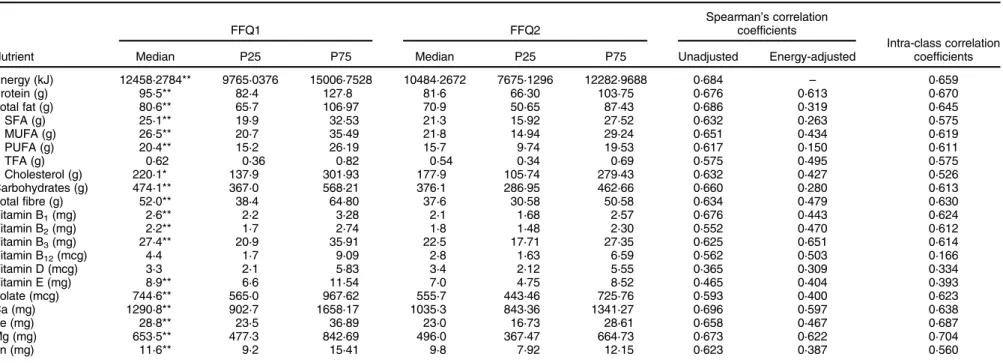
Table 3 Absolute daily nutrient intakes estimated by the first (FFQ1) and second (FFQ2) applications of the semi-quantitative FFQ, Spearman’s correlation coefficients (for unadjusted and energy-adjusted values) and intra-class correlation coefficients (FFQ1 and FFQ2)
Nutrient FFQ1 FFQ2 Spearman’s correlation coefficients Intra-class correlation coefficients
Median P25 P75 Median P25 P75 Unadjusted Energy-adjusted
Energy (kJ) 12458·2784** 9765·0376 15006·7528 10484·2672 7675·1296 12282·9688 0·684 – 0·659 Protein (g) 95·5** 82·4 127·8 81·6 66·30 103·75 0·676 0·613 0·670 Total fat (g) 80·6** 65·7 106·97 70·9 50·65 87·43 0·686 0·319 0·645 SFA (g) 25·1** 19·9 32·53 21·3 15·92 27·52 0·632 0·263 0·575 MUFA (g) 26·5** 20·7 35·49 21·8 14·94 29·24 0·651 0·434 0·619 PUFA (g) 20·4** 15·2 26·19 15·7 9·74 19·53 0·617 0·150 0·611 TFA (g) 0·62 0·36 0·82 0·54 0·34 0·69 0·575 0·495 0·575 Cholesterol (g) 220·1* 137·9 301·93 177·9 105·74 279·43 0·632 0·427 0·526 Carbohydrates (g) 474·1** 367·0 568·21 376·1 286·95 462·66 0·660 0·280 0·613 Total fibre (g) 52·0** 38·4 64·80 37·6 30·58 50·58 0·634 0·479 0·630 Vitamin B1(mg) 2·6** 2·2 3·28 2·1 1·68 2·57 0·676 0·443 0·624 Vitamin B2(mg) 2·2** 1·7 2·74 1·8 1·48 2·30 0·552 0·470 0·612 Vitamin B3(mg) 27·4** 20·9 35·91 22·5 17·71 27·35 0·625 0·651 0·614 Vitamin B12(mcg) 4·4 1·7 9·09 2·8 1·63 6·59 0·562 0·503 0·166 Vitamin D (mcg) 3·3 2·1 5·83 3·4 2·12 5·55 0·365 0·309 0·334 Vitamin E (mg) 8·9** 6·6 11·54 7·0 4·75 8·52 0·465 0·404 0·393 Folate (mcg) 744·6** 565·0 967·62 555·7 443·46 725·76 0·593 0·400 0·623 Ca (mg) 1290·8** 902·7 1658·17 1035·3 843·36 1341·27 0·696 0·597 0·638 Fe (mg) 28·8** 23·5 36·89 23·0 16·73 28·61 0·658 0·467 0·687 Mg (mg) 653·5** 477·3 842·69 496·0 367·47 664·73 0·673 0·622 0·704 Zn (mg) 11·6** 9·2 15·41 9·8 7·92 12·15 0·623 0·387 0·560
SFA, saturated fatty acids; MUFA, monounsaturated fatty acids; PUFA, polyunsaturated fatty acids; TFA, Trans-fatty acids.
Median values were significantly different from those estimated from FFQ2: *P < 0·05, **P < 0·001; P-values were calculated using the non-parametric Wilcoxon signed-rank test.
8
C
Vila-Real
et
interpretation of questions(16). In the current study, the
authors felt that medium-term memory and perception of portion sizes were the main factors that affected the results. To clarify the portion sizes to respondents, it could have been possible to show them the developed photographic food album used for recalls. However, there is no clear evidence that using photographs during the application of FFQ would improve correlations significantly(16,36).
Besides, the time spent in an interview using a photo-graphic album would also have been longer, which could have been critical for this study, considering the limited schedule and resources.
It has been observed that the more recalls are made, the lesser the difference between intakes from the question-naire and recalls(16). Based on this fact, it would be clear that
increasing the number of recalls would improve the correlation between both methods. However, the study of Papazian et al.(32), where one recall was obtained to
validate the FFQ, revealed correlation coefficients to be not so different compared with those obtained by other studies where more recalls were conducted. The range
of unadjusted Spearman’s correlations of the current
study was similar to that obtained in other studies with analogously applied methodology(22,26,27,37). However,
other researchers reported better(30,32) and worse(28,31)
results compared with the current study. Among these, only the study of Jackson et al.(22) was conducted in Africa,
specifically in Botswana, which confirms the region’s
poorness in these types of studies. When analysing
energy-adjusted Spearman’s correlations, only TFA,
cholesterol, vitamins B2, B3 and Ca increased. Some
studies also experienced improvements (when energy-adjusted) in protein(22,27), fibre(22) and micronutrients
correlations(22,26,29,30,32), especially for Ca, Fe and vitamin E.
This shows that the process of validity is not
straight-forward, being challenging the obtention of high
correlations. Deattenuation adjustment showed a general improvement of coefficients (unadjusted or energy-adjusted), meaning that the contribution of within-person error was considerable. This might be justified by the non-monotonous diet of urban Kenyans, not necessarily in terms of the type of foods, but especially in quantities and number of meals per day. Although correlations are the most commonly used method, they have some limitations since they do not study the agreement of both methods, but only if they are associated. Thus, other statistical approaches, such as the Bland–Altman method, were followed. These plots assess the agreement between methods across a range of intakes(25,38). According to
the plots presented in the current study, it is possible to recognise that the agreement for energy [Fig. 2(a)], carbo-hydrate [Fig 2(b)] and fibre [Fig. 2(c)] was only moderate. By analysing the plots, it is possible to conclude that for lower intakes, the difference between both methods was smaller compared with higher intakes, whose differ-ence seemed to be larger. The overall mean differdiffer-ence
corroborated the first conclusions since it was clear that there was an overestimation of the FFQ against the recalls. However, for total fat, the agreement between both methods was better [Fig. 2(d)], especially for PUFA [Fig. 2(e)], for which although the correlation coefficient
for energy adjustment was very weak, the Bland–Altman
diagram showed a good agreement between both instru-ments. Observing the plot, the difference between both methods in terms of lower intakes v. higher intakes was not so notorious. Moreover, for this nutrient, the agreement into the same quartile was also high, as mentioned above.
Some limitations should be considered when interpret-ing the present results. Regardinterpret-ing the reproducibility study, the authors recognise that the period between interviews was short. It would have been more adequate to spread the interviews slightly more; however, this was not achiev-able within the timeframe and resources availachiev-able for the study. Concerning the validity of the FFQ, three non-consecutive recalls were used to validate the questionnaire; however, other methods could have been hypothesised,
for example, food records or even biomarkers.
According to other investigations, they observed better
agreement with FFQ(39). All methods have their own
limitations and sources of errors. Besides, in some circum-stances, the study population or the study site does not allow the implementation of an ideal method for compari-son, which would lead to the choice of a less effective or appropriate method. In the present case, participants’ illiteracy and poor motivation made multiple 24hR the only reasonable choice. Additionally, the research team recog-nises the likely source of correlated errors by the usage of the same food software for the analysis of nutrient intakes. Considering the application of both tools, the inter-viewers found it difficult for respondents to estimate the consumed amount in certain types of foods.‘Vegetables’ was the food group that carried more challenges, mainly because Kenyan people do not eat a single vegetable at a time, but a mix of several types. Moreover, the estimation of meat (mainly beef and pork) was difficult in some cases, mainly because meat is not commonly eaten in large pieces such as beef, but in small pieces, in mixed preparations. Consequently, this hindered portion size estimation. Nevertheless, meat is not a major component of the main course, and so, this might not have influenced intake estimation that much. Another particularity in Kenya is that in some places, even in urban areas, people share a big plate, or a bowl, which makes portion size estimation a challenge.
Considering the scarcity of tools to assess dietary intake in African populations, the authors consider that this is a valuable contribution to future studies. The tool comprises a huge list of foods and is possible to be completed in a
25–30-min interview, avoiding respondents’ lack of
patience and, consequently, inaccuracy in dietary assess-ment. This validated tool might be used to rank individuals
according to their nutrient or food intake in order to further study its association with disease development or prevalence.
Conclusions
A comprehensive procedure was followed with the aim of developing a culturally adapted semi-quantitative FFQ. Although it tends to overestimate intakes, and for that reason, it might not be a precise instrument to measure absolute intakes, this FFQ is clearly a valuable tool for ranking individuals according to their nutrient intake. Consequently, this developed FFQ plays an important role in the identification of risk groups for diet-related diseases. Nonetheless, this dietary tool can be used as a basis for future dietary surveys as it is, making it, as far as the authors know, the only validated questionnaire adapted to the Kenyan culture. The developed tool was specially designed for urban adult Kenyans, making it an appropriate instrument since it is culturally adapted to this population. In conclusion, the developed FFQ is a valid and reproduc-ible tool that can be applied in future epidemiological studies to accurately rank urban adult Kenyans according to their dietary intake as well as allow investigations into the associations of diet with risk of disease in urban Kenya.
Acknowledgements
Acknowledgements: The authors would like to thank all the participants of the current study. They are also grateful to the entire research team, and to Filipe Pereira for support in database construction and data extraction. Financial support: This work was supported by National Funds from
FCT,‘Fundação para a Ciência e a Tecnologia’, through
project ‘Optimisation of fermentation processes for the development of fibre-rich cereals-based products: promo-tion of fibre intake in Africa and Europe’ (ERA-AFR/0002/ 2013 BI_I) and the doctoral grant SFRH/BD/133084/2017– ‘Dietary fibre intake and tailored fermentation toward the development of functional cereal fibre-rich food products:
bridge between Africa and Europe’. This work was
supported by National Funds from FCT through project UID/Multi/50016/2019. Conflicts of interest: There are no conflicts of interest. Authorship: The authors’ contributions are as follows: C.V.-R., A.P.-M., E.P., A.G., N.H.M. and K.K. contributed to study design. C.V.-R. and J.S.M. contributed to data collection for both phases. C.V.-R. conducted the fieldwork, computed and analysed data and wrote the manuscript. E.P. and A.G. also contributed to the deci-sion-making process during data collection, interpretation offindings, data analyses and writing of the manuscript. C.K. and S.M. facilitate the selection of interviewers and fieldwork logistics and contributed to the decisions regarding food list. All authors read and approved the final version of the manuscript. Ethics of human subject
participation: The current study was conducted according to the guidelines laid down in the Declaration of Helsinki, and all procedures involving research study participants were approved by the Institute for Bioethics, Catholic University of Portugal. Written informed consent was obtained from all subjects.
Supplementary material
For supplementary material accompanying this article visit https://doi.org/10.1017/S136898002000169X
References
1. The World Bank (2018) Urban Population (% of Total Population). https://data.worldbank.org/indicator/SP.URB. TOTL.IN.ZS?locations=KE (accessed February 2018). 2. Popkin BM (1999) Urbanization, lifestyle changes and the
nutrition transition. World Dev 27, 1905–1916.
3. World Health Organization (2018) Noncommunicable Diseases Country Profiles 2018. Geneve: WHO.
4. Vila-Real C, Pimenta-Martins A, Gomes A et al. (2016) How dietary intake has been assessed in African countries? A systematic review. Crit Rev Food Sci Nutr 58, 1002–1022. 5. Pisa PT, Landais E, Margetts B et al. (2018) Inventory on the dietary assessment tools available and needed in Africa: a prerequisite for setting up a common methodological research infrastructure for nutritional surveillance, research and prevention of diet-related non-communicable diseases. Crit Rev Food Sci Nutr 58, 37–61.
6. Walton C, Taylor J, Vanleeuwen J et al. (2012) Associations of diet quality with dairy group membership, membership duration and non-membership for Kenyan farm women and children: a comparative study. Public Health Nutr 17, 1–10.
7. Steyn N & Nel J (2006) Dietary Intake of Adult Women in South Africa and Nigeria with a Focus on the Use of Spreads, pp. 1–89. Cape Town: South African Medical Research Council.
8. Steyn NP, Nel JH, Parker WA et al. (2011) Dietary, social, and environmental determinants of obesity in Kenyan women. Scand J Public Health 39, 88–97.
9. Steyn NP, Nel JH, Parker W et al. (2012) Urbanisation and the nutrition transition: a comparison of diet and weight status of South African and Kenyan women. Scand J Public Health 40, 229–238.
10. Hansen AW, Christensen DL, Larsson MW et al. (2011) Dietary patterns, food and macronutrient intakes among adults in three ethnic groups in rural Kenya. Public Health Nutr 14, 1671–1679.
11. Gewa CA, Murphy SP & Neumann CG (2007) Out-of-home food intake is often omitted from mothers’ recalls of school children’s intake in rural Kenya. J Nutr 137, 2154–2159. 12. Kamau-Mbuthia E & Elmadfa I (2007) Diet quality of
pregnant women attending an antenatal clinic in Nakuru, Kenya. Ann Nutr Metab 51, 324–330.
13. Mbochi RW, Kuria E, Kimiywe J et al. (2012) Predictors of overweight and obesity in adult women in Nairobi Province, Kenya. BMC Public Health 12, 823.
14. Mala JO, Tuitoek PJ & Odhiambo RA (2012) Effect of dietary intakes on pregnancy outcomes: a comparative study among HIV-infected and uninfected women at Nyanza Provincial General Hospital, Kenya. Afr J Food Agric Nutr Dev 12, 6776–6793.
15. Waudo J, Tuitoek P, Msuya J et al. (2005) Food consumption patterns and nutrient intake by women and under five year
old children in westlands of Lake Victoria Basin. In: Food & Nutrition Security for Health and Development Proceedings of the Inaugural National Nutrition Congress [INNC]. Nairobi, Kenya, pp. 104–111.
16. Willet W (2013) Food frequency methods. Reproducibility and validity of food frequency questionnaires. In Nutritional Epidemiology, 3rd ed., Chapters 5 and 6, pp. 118–198 [W Willet, editor]. New York: Oxford University Press.
17. Sheehy T, Kolahdooz F, Mtshali TL et al. (2013) Development of a quantitative food frequency questionnaire for use among rural South Africans in KwaZulu-Natal. J Hum Nutr Diet 27, 443–449.
18. Lukmanji Z, Hertzmark E, Spiegelman D et al. (2013) Dietary patterns, nutrient intake, and sociodemographic characteris-tics in HIV-infected Tanzanian pregnant women. Ecol Food Nutr 52, 34–62.
19. Wrottesley SV, Micklesfield LK, Hamill MM et al. (2014) Dietary intake and body composition in HIV-positive and– negative South African women. Public Helath Nutr 17, 1603–1613.
20. Baroudi O, Chaaben AB, Mezlini A et al. (2014) Impact of lifestyle factors and nutrients intake on occurrence of gastrointestinal cancer in Tunisian population. Tumor Biol 35, 5815–5822.
21. Jordan I, Hebestreit A, Swai B et al. (2013) Dietary patterns and breast cancer risk among women in northern Tanzania: a case–control study. Eur J Nutr 52, 905–915.
22. Jackson MD, Motswagole BS, Kwape LD et al. (2012) Validation and reproducibility of an FFQ for use among adults in Botswana. Public Health Nutr 16, 1995–2004. 23. Merchant AT, Dehghan M, Chifamba J et al. (2005) Nutrient
estimation from an FFQ developed for a Black Zimbabwean population. Nutr J 4, 37.
24. Willet W (2013) Issues in analysis and presentation of dietary data. In Nutritional Epidemiology, 3rd ed., Chapter 13, pp. 416–454 [W Willet, editor]. New York: Oxford University Press.
25. Martin Bland J & Altman D (1986) Statistical methods for assessing agreement between two methods of clinical measurement. Lancet 327, 307–310.
26. Silva-Jaramillo KM, Neutzling MB & Drehmer M (2015) FFQ for the adult population of the capital of Ecuador (FFQ-Quito): development, reliability and validity. Public Health Nutr 18, 2540–2549.
27. Mouratidou T, Ford FA & Fraser RB (2011) Reproducibility and validity of a food frequency questionnaire in assessing dietary intakes of low-income Caucasian postpartum women living in Sheffield, United Kingdom. Matern Child Nutr 7, 128–139.
28. Dehghan M, del Cerro S, Zhang X et al. (2012) Validation of a semi-quantitative food frequency questionnaire for argentinean adults. PLoS One 7, e37958.
29. Mouratidou T, Ford F & Fraser RB (2005) Validation of a food-frequency questionnaire for use in pregnancy. Public Health Nutr 9, 515–522.
30. Cheng Y, Yan H, Dibley MJ et al. (2008) Validity and reproducibility of a semi-quantitative food frequency questionnaire for use among pregnant women in rural China. Asia Pac J Clin Nutr 17, 166–177.
31. Gunes FE, Imeryuz N, Akalin A et al. (2015) Development and validation of a semi-quantitative food frequency questionnaire to assess dietary intake in Turkish adults. J Pak Med Assoc 65, 756–763.
32. Papazian T, Hout H, Sibai D et al. (2016) Development, reproducibility and validity of a food frequency
questionnaire among pregnant women adherent to the Mediterranean dietary pattern. Clin Nutr 35, 1550–1556. 33. Koo TK & Li MY (2016) A guideline of selecting and reporting
intraclass correlation coefficients for reliability research. J Chiropr Med 15, 155–163.
34. Segovia-Siapco G, Singh P, Jaceldo-Siegl K et al. (2007) Validation of a food-frequency questionnaire for measure-ment of nutrient intake in a dietary intervention study. Public Health Nutr 10, 177–184.
35. Zack RM, Irema K, Kazonda P et al. (2018) Validity of an FFQ to measure nutrient and food intakes in Tanzania. New Testam Stud 21, 2211–2220.
36. Paiva I, Amaral T & Barros H (2004) Influence of individually estimated portion size on the assessment of nutritional risk in colorectal cancer in Portugal. J Hum Nutr Diet 17, 529–536. 37. Athanasiadou E, Kyrkou C, Fotiou M et al. (2016) Development and validation of a mediterranean oriented culture-specific semi-quantitative food frequency question-naire. Nutrients 8, 522.
38. Cade J, Thompson R, Burley V et al. (2002) Develop-ment, validation and utilisation of food-frequency questionnaires– a review. Public Heal Nutr 5, 567–587. 39. MacIntyre UE, Venter CS & Vorster HH (2001) A
culture-sensitive quantitative food frequency questionnaire used in an African population: 2. Relative validation by 7-day weighted records and biomarkers. Public Health Nutr 4, 63–71.
40. Landais E, Gartner A, Bour A et al. (2014) Reproducibility and relative validity of a brief quantitative food frequency questionnaire for assessing fruit and vegetable intakes in North-African women. J Hum Nutr Diet 27, Suppl. 2, 152–159. 41. Morita A, Natsuhara K, Tomitsuka E et al. (2015) Development, validation, and use of a semi-quantitative food frequency questionnaire for assessing protein intake in Papua New Guinean Highlanders. Am J Hum Biol 27, 349–357.
42. Jayawardena R, Byrne NM, Soares MJ et al. (2016) Validity of a food frequency questionnaire to assess nutritional intake among Sri Lankan adults. Springerplus 5, 162.
43. Macedo-Ojeda G, Vizmanos-Lamotte B, Márquez-Sandoval YF et al. (2013) Validation of a semi-quantitative food frequency questionnaire to assess food groups and nutrient intake | Validaci ´on de un cuestionario semi-cuantitativo de frecuencia de consumo de alimentos para determinar la ingesti ´on de grupos de alimentos y nutrient. Nutr Hosp 28, 2212–2220.
44. Barrett JS & Gibson PR (2010) Development and validation of a comprehensive semi-quantitative food frequency questionnaire that includes FODMAP intake and glycemic index. J Am Diet Assoc 110, 1469–1476.
45. Bountziouka V, Bathrellou E, Giotopoulou A et al. (2012) Development, repeatability and validity regarding energy and macronutrient intake of a semi-quantitative food frequency questionnaire: methodological considerations. Nutr Metab Cardiovasc Dis 22, 659–667.
46. Pinto E, Severo M, Correia S et al. (2010) Validity and reproducibility of a semi-quantitative food frequency ques-tionnaire for use among Portuguese pregnant women. Matern Child Nutr 6, 105–119.
47. Moreira P, Sampaio D & Vaz De Almeida MD (2003) Validade relativa de um questionário de frequência de consumo alimentar através da comparação com um registo alimentar de quatro dias [Validity assessment of a food frequency questionnaire by comparison with a 4-day diet record]. Acta Med Port 16, 412–420.
48. Decarli A, Franceschi S, Ferraroni M et al. (1996) Validation of a food-frequency questionnaire dietary intakes in cancer studies in Italy. AEP 6, 110–118.