1
Universidade Federal da Bahia, Instituto de Saúde Coletiva,Programa de Pós-Graduação em Saúde Coletiva. R. Basílio da Gama, s/n., Campus Universitário Canela, 40110-040, Salvador, BA, Brasil. Correspondência para/Correspondence to: JMO MASCARENHAS. E-mail: <[email protected]>.
2
Universidade Federal da Bahia, Escola de Nutrição, Departamento Ciência da Nutrição. Salvador, BA, Brasil. 3
Universidade Federal da Bahia, Instituto de Saúde Coletiva, Programa de Pós-Graduação em Saúde Coletiva. Salvador, BA, Brasil.
4
Universidade de São Paulo, Faculdade de Saúde Pública, Departamento de Nutrição. São Paulo, SP, Brasil.
Article based on the doctoral dissertation of JMO MASCARENHAS, entitled “Padrão de consumo alimentar, sintomas de asma e fatores associados em adolescentes de Salvador, BA”. Universidade Federal da Bahia;2013.
Validation of a food frequency
questionnaire designed for
adolescents in
Salvador
,
Bahia
, Brazil
Validação de um questionário de
frequência de consumo alimentar
para população de adolescentes
em Salvador, Bahia
Jean Márcia Oliveira MASCARENHAS1
Rita de Cássia Ribeiro SILVA2
Maria Ester Pereira Conceição MACHADO2
Carlos Antonio de Souza Teles SANTOS3
Dirce Maria Lobo MARCHIONI4
Maurício Lima BARRETO1
A B S T R A C T
Objective
This study assessed the validity of a Food Frequency Questionnaire used to assess food intake in adolescents in
Salvador, Bahia, Brazil.
Methods
record, used as the reference method. The mean (and standard deviation) energy and nutrient intakes estimated from the Food Frequency Questionnaire and food records were calculated. The paired Student’s t test was used to determine differences between the data.
Results
Pearson’s correlation coefficient and Kappa statistics were used to measure the strength of the association between the two instruments. There was variation in the crude unadjusted (r=0.61-0.73) and deattenuated (r=0.33-0.99) Pearson correlation coefficients. After adjusting for energy, the crude and deattenuated coefficients ranged from r=0.53-0.81 and r=0.27-0.99, respectively. The intake of energy and most nutrients were found to be adequate, except for fiber (r=0.27) and calcium (r=0.33), which showed a weak correlation. Kappa statistics showed good correlation between all values varying from r=0.47 to 0.73.
Conclusion
It is considered that an average r value greater than 0.40 indicates a good correlation, the results obtained indicate the good ability of the Food Frequency Questionnaire to assess individuals according to their usual intake of most nutrients.
Keywords: Adolescent. Food consumption. Validation stidies.
R E S U M O
Objetivo
Verificar a validade do Questionário de Frequência Alimentar utilizado para avaliar o consumo de alimentos dos adolescentes em Salvador, Bahia.
Métodos
Participaram do estudo 70 adolescentes, com idade entre 11 e 17 anos, matriculados nas escolas da rede pública. Seu consumo alimentar foi avaliado pelo Questionário de Frequência Alimentar e pela média de três registros alimentares como método de referência. Foram estimadas as médias (desvio-padrão) da energia e dos nutrientes extraídos do Questionário de Frequência Alimentar e dos registros alimentares. Para verificar as diferenças foi aplicado o teste t Student pareado. Para medir a concordância entre os dois instrumentos foram calculados os coeficientes de correlação de Pearson e estatística de Kappa.
Resultados
A análise dos coeficientes de correlação de Pearson não ajustados brutos, foi possível observar uma variação entre (r=0,61-0,73), já nos deatenuados entre (r=0,33-0,99). Após ajustados por energia os valores brutos variaram entre (r=0,53-0,81) e os deatenuados (r=0,27-0,99), observou-se valores adequados para energia e a maioria dos nutrientes, com exceção da fibra (r=0,27) e do cálcio (r=0,33), que apresentaram fraca correlação. No método de Kappa, todos os valores obtidos na análise apresentaram boa correlação, variando entre (r=0,47-0,73).
Conclusão
Considera-se que a média dos coeficientes para boa correlação deve estar acima de 0,40, esses resultados indicam a capacidade do Questionário de Frequência Alimentar em classificar os indivíduos segundo seu consumo habitual para a maioria dos nutrientes.
Palavras-chave:Adolescente. Consumo de alimentos. Estudo deValidação.
I N T R O D U C T I O N
The Food Frequency Questionnaire (FFQ) is an instrument that aims to assess the habitual dietary intake of population groups and has the following advantages: speed and ease of administration and efficiency in epidemiological practice1. It is one of the most commonly used
tools in epidemiological studies to evaluate the relationship between diet and disease risk since besides assessing the intake prior to the onset of the disease, it is the most objective and the least expensive method for large-scale population-based studies2,3.
is not suited to provide information on absolute nutrient and food intake. This is due to its characteristics since it uses standardized measures and a pre-established food listing, which therefore does not include all the foods available for consumption and thus has a relative validation1,3.
However, obtaining a valid and reliable dietary assessment remains a challenge due to the methodological issues to achieve satisfactory results4,5. Inaccurate dietary measurements can underestimate or overestimate the association between diets and diseases. Therefore, validation studies are very important in the evaluation of these instruments, leading to better analysis of the results to minimize bias4,5.
The term validity of an assessment is generally defined as the degree to which an instrument measures what it is supposed to measure6. Validation studies compare the method being tested with a reference method that reflects the true dietary intake. Therefore, it is expected that the instrument being tested can reproduce the results from the reference method effectively and reliably. To investigate the validity of the FFQ, it is advisable to compare its results with the mean of at least two reference method measurements1. Thus, these instruments’ measurements can be validated.
There is no “gold standard” method for measuring food intake with high degree of accuracy4. Food records are commonly used as a reference method7. They assess the usual intake, which does not depend on the respondent’s memory, but adequate instructions are necessary for filling them out to ensure greater accuracy, particularly with respect to portion size8.
Food Frequency Questionnaire validation studies involving children and adolescents are still scarce in Brazil9. During childhood and adolescence, nutritional needs are higher for growth and development, and it is when eating habits are established and consolidated; thus this period of life deserves special attention, considering the influence of cultural, economic, social, and environmental factors10. The objective of this study was to assess the validity of a FFQ in a
sample of adolescent students enrolled in state public schools in Salvador, Bahia.
M E T H O D S
This study is part of the doctoral thesis titled “Standard food intake, asthma symptoms, and associated factors in adolescents in Salva-dor - BA”, written in 2009, at the Institute of Collective Health at the Universidade Federal da Bahia (ISC/UFBA).
The sample was composed of 70 adolescents of both genders, aged 11-17 years and enrolled in the 6th,7th, and 8th grades of public middle schools in Salvador, in 2009. In this type of study, it is recommended to include 50-100 people in each demographic group1,4,11. The exclusion criteria adopted included students who were on a restrictive diet, pregnant girls, nursing mothers, and those who had not responded to the food records and the food frequency questionnaire. Among the 84 adolescents who had responded to the FFQ and the three food records, only those who provided complete responses in both instruments remained, totaling 70 students. They are part of a wider research involving 1,330 adolescents enrolled in 21 state public schools in
Salvador. The sample size was determined with a confidence interval of 95% and a maximum allowable error of 3%.
The adolescents’ parents or guardians who agreed to their child’s participation in the study signed an informed consent form; the illiterate signed it with their fingerprint. The present study was approved by the Research Ethics Committee of the Institute of Collective Health, UFBA) (Resolution nº 002/08 CEP/ISC).
instruments to be used and were adequately instructed how to complete them by a nutritionist and highly trained technicians. It is worth to mention that these students eat at school, and thus they had to record the foods eaten during the school day. The interviews (including the questionnaire completion) were conducted between July and December 2009.
Widely used in several studies8,12, the food record was used as the reference method to validate the FFQ. The food records were applied during three interviews, with a 15-day interval between them. One of the food records was applied before the design of the FFQ in order to determine the food type, frequency, and average amount consumed by the adolescents. Therefore, in the first interview, the students responded to the first food record. After eight days, a telephone contact was made to schedule the second food record and the FFQ, which was applied after 15 days of the first interview; and finally, the third food record was applied 15 days later. The food items selected in the food records were included in the FFQ so that the instrument used would closely reflect the reality of the individuals studied, considering the foods with the highest frequency of consumption in this age group.
The Food Frequency Questionnaire results and the mean values of the three-day food record were compared to perform the validation of the food frequency questionnaire used. As for the identification of the participant adolescents, demographic information about gender, age, and education level was collected.
The food record contained three columns: a) meal - time; b) type of food consumed, and c) amount in household measure. The participants should enter data in these columns. The food items were classified into ten food groups: sugar and sweets in general; salty snacks and salty dishes; oil and vegetable fats; dairy products; meat and eggs; cereals, roots, and tubers; vegetables; fruits and other foods, totaling 97 food items. The FFQ included the following categories: a) never/almost never; b) 1-3 times/month; c) once/ week; d) 2-4 times-week, e) ≥4 times/week and
the number of times/day13. The food record data were entered directly into the nutritional analysis software program, and the FFQ data were firstly converted into intake in grams or milliliters/day (portion sizes) using an Excel (Microsoft Corporation, Redmond, Washington, United States) spreadsheet by multiplying the frequency by the portion size and dividing by the number of days in the month. The total energy, carbohydrates, proteins, lipids, fiber, zinc, magnesium, calcium, iron were determined for the FFQ and for each one of the food records.
Based on tables and household measures14-16 and standards reported in previous studies14, the data obtained were converted into household measures (weight and volume units) in order to calculate the daily intake of the foods entered in the FFQ and food records. Information about food dishes or food items entered by the participants that were not included in the existing tables was obtained from local markets. The frequency of each FFQ food item was then converted into daily consumption. The macronutrients total energy, carbohydrates, lipids, proteins, fibers; zinc, calcium, magnesium and iron through were then analyzed using the software Virtual Nutri (version 1.0,
Universidade de São Paulo, São Paulo, Brazil)17.
The Kolmogorov-Smirnov test was initially performed to assess the adherence of the data to the normal distribution. Any variables that were not normally distributed, p≥0.05, were excluded; only normally distributed variables were considered in the analysis. Descriptive analysis included calculation of the mean (and standard deviation) energy and nutrient intakes estimated from the FFQ and food records. The paired Student’s t test was used to compare the mean energy and nutrient intakes of the FFQ and the food records.
In order to verify the validity, the food records’ measures were compared with those of the FFQ. Energy and crude nutrient Pearson’s correlation coefficients were calculated and adjusted for energy using the residual method. Linear regression analysis was performed with the nutrients as the dependent variable and total energy as the independent variable, resulting in new variables without the influence of energy6.
Moreover, due to the importance of intra-individual variation in determining the validity of the instrument, the ratio of the intra- to inter-individual variation should also be considered6. In this type of analysis, the attenuation of correlation coefficients can occur due to the day-to-day variation in food intake between the subjects thus requiring the correction of the values of the three food records. In this process, called deatenuation, the following equation is used:
rv= ro(1 + ë/n) ½, where r
v is the true correlation,
ro is the observed correlation between the FFQ and the mean value the food records, ë is the
ratio of intra- and inter-individual variation, and n is number of replicates (recalls). Correlation coefficients between 0.4-0.7 indicate good correlation, i.e. good concordance6. All analyzes were performed adopting a significance level of 5%. The nutritional analysis software program data were analyzed using the Stata (Stata Corporation, College Station, Texas, United States) version 11.
R E S U L T S
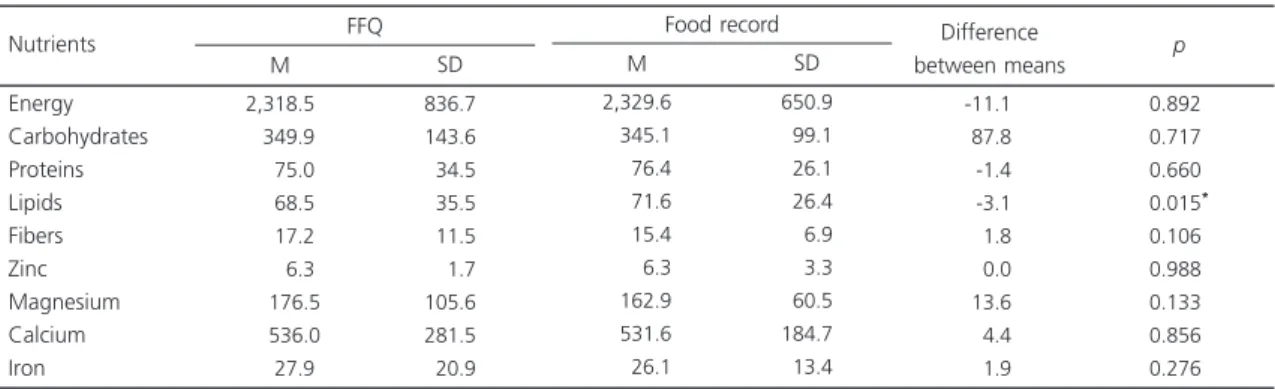
Of the 70 adolescents who participated in this study, 47 were females and 23 were males, and the average age was 14 years. It was observed that the energy intake estimated from the FFQ was similar to that of the food records. Among the nutrients evaluated, there was a significant difference in the mean lipid intake between the two dietary assessment methods (-3.1 p=0.015). There was no significant difference in the mean zinc intake between the two methods used (0.00
p=0.988) (Table 1).
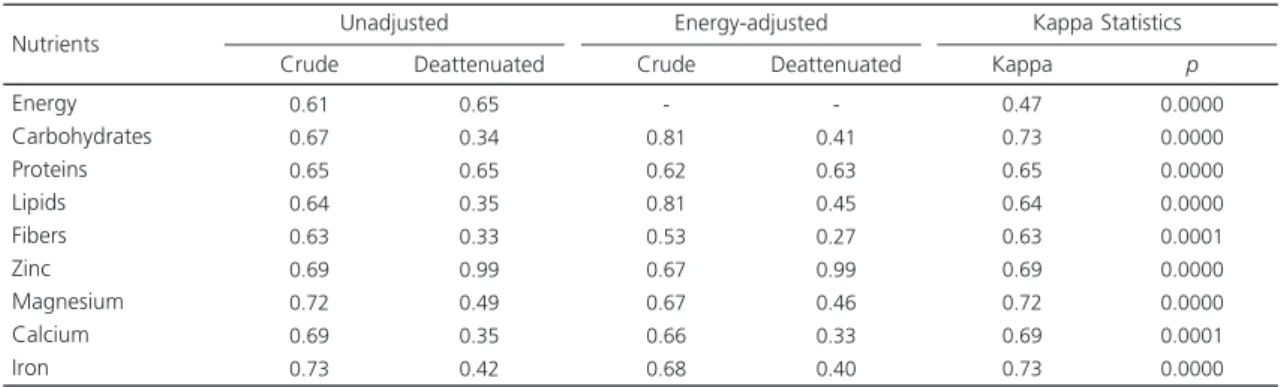
The crude and deattenuated Pearson correlation coefficients between the FFQ and the food records, adjusted for energy and corrected for intra-individual variation, are shown in Table 2. The analysis of the crude correlation coefficients indicated adequate energy and nutrient intake for both the unadjusted and energy-adjusted coefficients (r=0.61-0.73); the total energy intake (r=0.61), carbohydrates (r=0.67), proteins (r=0.65), lipids (r=0.64), fibers (r=0.63), zinc (r=0.69) magnesium (r=0.72), calcium (r=0.69), and iron (r=0.73). The energy-adjusted coefficients ranged from r=0.53-0.81, carbohydrates (r=0.81), protein (r=0.62), lipids (r=0.81), fibers (r=0.53), zinc (r=0.67), magnesium (r=0.67), calcium (r=0.66), iron (r=0.68); all results indicated good correlation6. The analysis of the effect
Table 1. Mean (and standard deviation) energy and nutrient intakes and difference between the mean values estimated from the Food Frequency Questionnaire (FFQ) and the three-day food record used to assess adolescents in Salvador (BA), Brazil, 2009.
Energy Carbohydrates Proteins Lipids Fibers Zinc Magnesium Calcium Iron Nutrients 2,318.5 0,349.9 00,75.0 00,68.5 00,17.2 000,6.3 00,176.5 00,536.0 00,27.9 836.7 143.6 034.5 035.5 011.5 001.7 105.6 281.5 020.9 FFQ M SD 2,329.6 0,345.1 00,76.4 00,71.6 00,15.4 000,6.3 0,162.9 0,531.6 00,26.1 650.9 099.1 026.1 026.4 006.9 003.3 060.5 184.7 013.4 Food record M SD -11.1 -87.8 0-1.4 0-3.1 0-1.8 0-0.0 -13.6 0-4.4 -01.9 0.892* 0.717* 0.660* 0.015* 0.106* 0.988* 0.133* 0.856* 0.276* p Difference between means
of intra-individual variation showed reduction in the crude coefficients and all nutrient coefficients, with the exception of protein and zinc coefficients, which increased. After adjusting for energy, fiber (r=0.27) and calcium (r=0.33) showed weak correlation. Kappa statistics showed good correlation between the nutrient intake values,
varying from r=0.47 (energy) to 0.73
(carbohydrates and iron): carbohydrates (r=0.73), protein (r=0.65), lipids (r=0.64), fibers (r=0.63), zinc (r=0.69), magnesium (r=0.72), calcium (r=0.69), and iron (r=0.73); all coefficients showed good correlations.
D I S C U S S I O N
The comparison between the mean energy and nutrient intakes estimated from the FFQ and the food records show that there were no statistically significant differences in the intake of energy, macronutrients, and micronutrients analyzed, except for the lipids. As for the nutrients, the differences observed were smaller than those of other studies5,18.
The results of crude Pearson correlation coefficients and kappa statistics indicate an acceptable energy and nutrient intake, showing concordance between the dietary assessment method used and the reference method. The validation of the FFQ in the population studied showed consistency of the estimates for most nutrients analyzed, with strong associations19.
Validation studies may contain random or systematic errors, which may lead to intra- and inter individual variations, due to the FFQ and food record measurements accuracy and other data collection errors.
The correlation coefficients may also vary depending on the FFQ used2; the amount of food and nutrients obtained from various sources can lead to different results6. The correlation coefficients may increase when the variability in nutrient intake is related to energy intake, but they may decrease when this variability depends on systematic errors due to under or overestimation of food intake by individuals2,5,20.
The correlations between dietary intake estimates from the FFQ and reference methods are often in the range from 0.3-0.7, which suggests errors21. According to Willett6, the association between dietary assessment data in epidemiological studies is relatively weak, usually less than 0.2. Therefore, the associations found may not be real due to inaccurate dietary measurements.
Therefore, some adjustments are needed to minimize potential errors. With regard to the energy adjustment and correction of the variability of the estimates, there was a decrease in the associations between the intake of carbohydrates, lipids, fiber, magnesium, calcium, and iron, but there was an increase in the association between the intake of energy, protein, and zinc. A decrease in the correlation coefficients after the adjustments were also observed in the validation studies
Table 2. Pearson correlation coefficients and Kappa values between the Food Frequency Questionnaire and three-day food record.
Salvador (BA), Brazil, 2009.
conducted by Lima et al.2, who used an FFQ and four 24-hour recalls, as well as the paired t test and Pearson correlation coefficients to compare the mean nutrient intake. Marchioni et al.22, assessed the validity of a food frequency questionnaire using the Bland-Altman method.
In the present study, the deattenuated Pearson correlation coefficients were higher for zinc intake (0.99). Despite having good levels (greater than 0.4), the correlation coefficients of carbohydrates, lipids, magnesium, and iron reduced after adjusting for energy and correction of variability. The correlation coefficients of fiber and calcium, despite having weaker correlations, ranged between 0.27-0.33, respectively, after energy adjustment and variability correction and were thus close to the minimum ideal value (0.40). In general, correlation coefficients greater than 0.7 are rarely found in dietary validation studies, probably due to the inherent complexity of diet that cannot be fully captured a structured questionnaire23.
Unlike what was found in the present study, in a study that was carried out in Guatemala on the validation of a similar FFQ, the assessment of the mean value of the three-day food record indicated overestimation of the intake of all nutrients analyzed24. In a study carried out in
Salvador, Matos et al.10 assessed the validity of a FFQ used to assess food intake in children and adolescents aged from 4-11 years old. These authors found that the Pearson correlation coefficients decreased after energy adjustment for most nutrients. This is a common behavior after adjusting for energy in this type of study; however, some studies have reported an increase in the correlation coefficients2,18.
Slater et al.25 conducted a study to validate a 76-item semi-quantitative FFQ in a population of adolescents in São Paulo (SP), Brazil. The sample was composed of 200 private school adolescent students. The authors found great variability in the dietary intake of these adolescents, with high rates of variability for cholesterol, retinol (vitamin A), and vitamin C. The Pearson correlation coefficients,
after being adjusted for energy and corrected for variability ranged between 0.10-0.72 among female students and between 0.16-0.91 among male students. The average correlation coefficient for the entire population studied was 0.5223. In another validation study conducted in Brazil, Fornes et al.26 found an average correlation coefficient of 0.50 for a population of adults; the same value that was found in the present study (0.50) for energy-adjusted coefficients.
In a study carried out with adolescents in Kelantan (Malaysia), the energy-adjusted Pearson correlation coefficients for energy and nutrient intake between two methods ranged from 0.22 (zinc) to 0.68 (calcium), with an average value of 0.4327. Shatenstein et al.28, in a comprehensive study carried out in France and England with children and adolescents aged 7 to 18 years, found that the Spearman correlation coefficients between the tested method and the reference method were positive, ranging from 0.22 (vitamin C) to 0.57 (saturated fat).
In a validation study conducted with adolescents by Henn et al.29 in Porto Alegre (RS), Brazil, the unadjusted Pearson correlation coefficients between the two food consumption methods used (FFQ and 24-hour recall) ranged from 0.31 (vitamin E) to 0.57 (calcium). The increase in the deatenuated and energy-adjusted coefficient can be due to day-to-day variation in food intake, especially for fibers, calcium, folate, and Vitamin A and C. The correlations found were within the acceptable limits for variation (0.4 to 0 7) for 4 of the 8 nutrients analyzed.
Validation studies involving food records and FQQ may have some limitations related to both the respondents and the interviewer. The respondents may provide inaccurate information about their eating habits by under- or over-reporting food intake to facilitate food record and questionnaire completion. Other limitations of this type of study are related to their high cost and to the fact that the instruments require longer time to answer and illiterate respondents cannot fill them out, and thus it depends largely on their collaboration. Interviewers can also collect information and record these data, and therefore, they can also analyze them incorrectly. In general, studies on dietary intake assessment may contain random or systematic errors, which may lead to intra- and inter individual variations6,8.
As for the validity of the FFQ, the crude correlation coefficients found are comparable or higher than those reported in the literature. Energy adjustment led to a reduction in the correlation coefficients, which is in agreement with other research findings29.
Kappa values were shown to be statistically homogeneous and among the nutrients analyzed, energy had the lowest value, which is expected since energy variability is higher due to the fact it is obtained from various nutrients. A study involving adolescents found Kappa values lower than those obtained in the present study22. However, another study, carried out in São Paulo, also involving adolescents aged between 11-15 years, obtained kappa values similar to those of the present study30.
Accurately assessing dietary intake in epidemiological studies is still a major challenge for researchers due to lack of validation studies on dietary assessment instruments in adolescents in Brazil. It is well known that any single FFQ used in a particular population may not reflect its performance in a different population; thus, it should always be assessed for each different population. Therefore, it is necessary to study new techniques and methods to correct for measurement errors seeking new alternatives to make the FFQ a more appropriate and reliable instrument.
C O N C L U S I O N
The results obtained indicate that the FFQ has reasonable validity for assessing the intake of most nutrients available and consumed by adolescents in Salvador (BA), Brazil, except for the intake of fiber and calcium, which showed weak correlation using Pearson correlation analysis. The Kappa values also indicate it as a valid Instrument for the assessment of the nutrients analyzed. These data show that the FFQ used is suitable to collect information about the dietary intake of adolescents, and thus it can be used in epidemiological studies aimed at assessing the dietary intake of this specific population in regions with similar diets.
C O N T R I B U T O R S
JMO MASCARENHAS and ML BARRETO contributed to the conception and design of the study, data collection and interpretation, and manuscript writing. RR SILVA, MEPC MACHADO, and DML MARCHIONI contributed to data interpretation and critical revision of the manuscript. ACSS TELES contributed to data analysis.
R E F E R E N C E S
1. Slater B, Philippi ST, Marchioni DML, Fisberg RM. Validação de questionários de frequência alimen-tar - QFA: considerações metodológicas. Rev Bras Epidemiol. 2003; 6(3):200-8.
2. Lima FELD, Slater B, Latorre MRDO, Fisberg, RM. Validade de um questionário quantitativo de fre-qüência alimentar desenvolvido para população feminina no nordeste do Brasil. Rev Bras Epidemiol. 2007; 10(4):483-90.
3. Sichieri R, Everhart, J. Validity of a Brazilian food frequency questionnaire against dietary recalls and estimated energy intake. Nutr Res. 1998; 18(10): 1649-59.
4. Crispim SP, Franceschini SCC, Priore SE, Fisberg RM. Validação de inquéritos dietéticos: uma revisão. Nutrire: Rev Soc Bras Aliment Nutr. 2003; 26(10):27-41. 5. Crispim SP, Ribeiro RCL, Panato E, Silva MMS,
em adultos.Rev Nutr. 2009; 22(1):81-95. http:// dx.doi.org/10.1590/S1415-52732009000100008 6. Willett WC. Nutritional epidemiology. 2nd ed. New
York: Oxford University Press; 1998.
7. Pufulete M, Emery PW, Nelson M, Sanders TAB. Validation of a short food frequency questionnaire to assess folate intake. Br J Nutr. 2002; 87(4):383-90. 8. Fisberg RM, Slater B, Marchioni DML, Martini LA.
Inquéritos alimentares: métodos e bases científicas. Barueri: Manole; 2005.
9. Fumagalli F, Monteiro JP, Sartorelli DS, Vieira MNCM, Bianchi MLP. Validation of a food frequency questionaire for assessing dietary nutrients in Brazilian children 5 to 10 years of age. Nutrition. 2008; 24:427-32.
10. Matos SMA, Prado MS, Santos CAST, D’Innocenzo S, Assis AMO, Dourado LS, et al. Validation of a food frequency questionnaire for children and adolescents aged 4 to 11 years living in Salvador, Bahia. Nutr Hosp. 2012; 27(4):1114-9.
11. Cade J, Thompson R, Burley V, Warm D. Development, validation and utilization of food-frequency questionnaires: A review. Public Health Nutr. 2002; 5(4):567-87.
12. Thompson F, Byers T. Dietary assessment resource manual. J Nutr. 1994; 124(11):2245S-317. 13. Borges CQ, Silva RCR, Assis AMOM, Pinto EJ,
Fiaccone RL, Pinheiro SMC. Fatores associados à anemia em crianças e adolescentes de escolas públicas de Salvador, Bahia, Brasil. Cad Saúde Pú-blica. 2009; 25(4):877-88.
14. Magalhães LP, Oliveira VA, Santos NS, Araújo CS. Guia prático para estimativa de consumo alimentar. Salvador: UFBA; 2000
15. Morais MTP, Soares SD, Braga VLN. Medidas caseiras no preparo dos alimentos. Goiânia: AB; 1995. 16. Pinheiro ABV, Lacerda EMA, Benzecry EH, Gomes
MCS, Costa VM. Tabela para avaliação de consumo alimentar em medidas caseiras. Rio de Janeiro: Atheneu; 1993.
17. Philippi ST, Szarfarc, SC, Latterza AR. Virtual Nutri. Versão 10. São Paulo: Universidade de São Paulo; 1996.
18. Ribeiro AC, Sávio KEO, Rodrigues MLCF, Costa THM, Schmitz BAS. Validação de um questionário de frequência de consumo alimentar para popu-lação adulta. Rev Nutr. 2006; 19(5):553-62. http:// dx.doi.org/10.1590/S1415-52732006000500003 19. Triola MF. Introdução à estatística. 10ª ed. Rio de
Janeiro: LTC; 2008.
20. Willett WC, Stampfer MJ. Total energy intake: Implications for epidemiological analyses. Am J Epidemiol. 1986; 124:17-27.
21. Fraser GE, Stram DO. Regression calibration in studies with correlated variables measured with error. Am J Epidemiol. 2001; 154(9):836-44. 22. Marchioni DM, Voci SM, Lima FE, Fisberg RM, Slater
B. Reproducibility of a food frequency questionnaire for adolescents. Cad Saúde Pública. 2007; 23(9): 2187-96.
23. Willett W. A further look at dietary questionnaire validation [invited commentary]. Am J Epidemiol. 2001; 154(12):1100-2.
24. Rodriguez MM, Mendez H, Torun, B, Schroeder D, Stein AD. Validation of a semi-quantitative foodfrequency questionnaire for use among adults in Guatemala. Public Health Nutr. 2002; 5(5):691-9. 25. Slater B, Philippi ST, Fisberg RM, Latorre MRDO. Validation of a semi-quantitative adolescent food frequency questionnaire applied at a public school in São Paulo, Brazil. Eur J Clin Nutr. 2003; 57(5):629-35.
26. Fornes NS, Stringhini ML, Elias BM. Reproducibilitym and validity of a food-frequency questionnaire for use among low-income Brazilian workers. Public Health Nutr. 2003; 6(8):821-7.
27. Narul-Fadhilah A, Teo PS, Foo LH. Validity and reproducibility of Food Frequency Questionnaire ( F F Q ) f o r d i e t a r y a s s e s s m e n t i n M a l a y adolescents in Malaysia. Asia Pac J Clin Nutr. 2012; 21(1):97-103.
28. Shatenstein B, Amre D, Jabbour M, Feguery H. Examining the relative validity of an adult food frequency questionnaire in children and adolescents. J Pediatr Gastroenterol Nutr. 2010; 51(5):645-52.
29. Henn RL, Fuchs SC, Moreira, Beltrami L, Fuchs E, Danni F. Development and validation of a Food Frequency Questionnaire (FFQ-Porto Alegre) for adolescent, adult and elderly populations from Southern Brazil.Cad Saúde Pública. 2010; 26(11): 2068-79.
30. Voci SM, Enes CC, Slater B. Validação do Ques-tionário de Frequência Alimentar para Adoles-centes (QFAA) por grupos de alimentos em uma população de escolares.Rev Bras Epidemiol. 2008; 11(4):561-72.