UNIVERSIDADE DE LISBOA
FACULDADE DE CIÊNCIAS
DEPARTAMENTO DE ENGENHARIA GEOGRÁFICA, GEOFÍSICA E ENERGIA
Morocco towards a low-carbon economy: the role of
energy efficiency, renewable energy and carbon
capture and storage
Rita da Penha Gonçalves Pereira Machado
Mestrado em Engenharia da Energia e do Ambiente
UNIVERSIDADE DE LISBOA
FACULDADE DE CIÊNCIAS
DEPARTAMENTO DE ENGENHARIA GEOGRÁFICA, GEOFÍSICA E ENERGIA
Morocco towards a low-carbon economy: the role of
energy efficiency, renewable energy and CO
2
capture
and storage
Rita da Penha Gonçalves Pereira Machado
Dissertação de Mestrado em Engenharia da Energia e do Ambiente
Trabalho realizado sob a supervisão de
Dulce Boavida (LNEG/FCUL)
Agradecimentos
Quero agradecer à Doutora Dulce Boavida pela oportunidade que me concedeu de participar neste projecto.
Abstract
To meet global energy demand both fossil and non-fossil energy sources will be required in the foreseeable future. The continued large-scale and widespread consumption of fossil fuels and in particular coal for power generation is necessary to sustain population and economic growth. Amongst a spectrum of measures, Carbon Capture and Storage (CCS) technologies have the potential to play a key role, in response to climate change, by decarbonizing on a large scale the energy and other industrial sectors.
This thesis has been developed in the context of the COMET project, which is funded under the Seventh Framework Program. The COMET project goal is to assess the techno-economic feasibility of integrating carbon dioxide transport and storage infrastructures in the West Mediterranean area. This project jointly coordinated by Portugal, Spain and Morocco considers several development scenarios for these countries energy systems within the time period 2010-2050. These scenarios include the location and development of the energy related and industrial major CO2 point sources and the
available potential for geological storage in those countries. The long-term scenarios of the Portuguese, Spanish and Moroccan energy systems are to be modelled and evaluated through the technical economic MARKAL/TIMES models.
As part of the COMET project, this thesis presents the quantitative and qualitative input data needed to model the energy system of Morocco via MARKAL/TIMES. The input data includes, among others: energy conversion, consumption and CO2 emissions trends of the energy sector and other industrial
activities; the identification of the installed capacity and future perspectives; an assessment of the energy end-use sectors; an estimation of the domestic energy related resources; and an assessment of relevant energy policies as MARKAL/TIMES is well suited to evaluate the global impact of these policies within the energy sector.
Resumo
As fontes de energia renovável não são, e não serão, num futuro próximo, suficientes para suprir as necessidades globais de energia e por isso os combustíveis fosseis irão continuar a ser utilizados em larga escala. De facto, o contínuo consumo dos recursos fósseis e, em particular, do carvão, para a geração de electricidade será necessário para sustentar o crescimento económico e populacional. Para fazer face às alterações climáticas, as tecnologias de captura e armazenamento de CO2, apresentam-se
como uma opção para reduzir significativamente as emissões de CO2 para a atmosfera, associadas ao
sistema electro-produtor e a outros processos industriais.
Esta dissertação foi desenvolvida no âmbito do projecto COMET, financiado pelo Sétimo Programa-Quadro. O objectivo do projecto COMET é estudar a viabilidade técnico-económica da integração de uma estrutura de transporte e armazenamento de CO2 na zona oeste do Mediterrâneo. Este projecto
coordenado por Portugal, Espanha e Marrocos considera vários cenários dos sistemas energéticos destes países para o período 2010-2050. Estes cenários incluem a localização e desenvolvimento das pricipais unidades emissoras de CO2 e o potencial de armazenamento geológico nos países envolvidos.
Os cenários dos sistemas energéticos dos três países serão modelados recorrendo aos modelos MARKAL/TIMES.
Como parte integrante do projecto COMET, este trabalho apresenta a informação quantitativa e qualitativa para modelar o sistema energético de Marrocos via MARKAL/TIMES. Esta informação inclui: dados relativos à transformação, consumo e emissões de CO2 associadas ao sector enérgico e
industrial; a identificação da capacidade instalada e perspectivas futuras; uma análise dos sectores consumidores finais de energia; uma estimativa dos recursos energéticos domésticos; e um levantamento das políticas relacionadas com o sector energético, uma vez que os modelos MARKAL/TIMES têm a capacidade de avaliar o impacto dessas políticas nesse sector. Esta dissertação apresenta também alguns dos resultados obtidos através da modelação e uma análise dos mesmos.
List of Abbreviations and Acronyms
ADEREE - National Agency for Development of Renewable Energy and Energy Efficiency AfDB - African Development Bank bpd - Barrels per day
CCGT - Combined Cycle Gas Turbine CCS - Carbon Capture and Storage CDER - Centre de Développement des Energies Renouvelables
CDM - Clean Development Mechanism CED - Detroit Wind Energy Company CHP - Combined Heat and Power CO2 – Carbon Dioxide
COMELEC - Comité Maghrébin de l‟Electricité
COMET – Integrated infrastructure for CO2
transport and storage in the west MEdiTerranean
CSP - Concentrated Solar Power CtL – Coal-to-Liquid
Dh – Dirham, Morocco's official currency EE – Energy Efficiency
EET - Tahaddart Electricity Company EOR – Enhanced Oil Recovery ESP – Electrostatic Precipitators EU - European Union
FCC – Fluidized Catalytic Cracker FGD – Flue Gas Desulphurization FWP - Seventh Framework Program GDP - Gross Domestic Product GEF - Global Environment Facility GHG – Greenhouse Gas
GIS - Geographic Information System GtL - Gas-to-Liquid
GVA - Gross Value Added GWh – Gigawatt hour h - hour
H2 – Hydrogen
ha – hectare HV – High Voltage
IAEA - International Atomic Energy Agency IGCC – Integrated Gasification Combined-cycle
IMF – International Monetary Fund ISCC - Solar Combined Cycle Power Plant JLEC - Jorf Lasfar Energy Company km – kilometer
km2 – square kilometer
ktoe - kilotonne of oil equivalent kton – kiloton
kV - kilovolt kW - kilowatt kWh – kilowatt hour
LHV – Lower Heating Value LNG – Liquefied Natural Gas LPG - Liquefied Petroleum Gas m – meter
m2 – square meter
MAD - Moroccan Dirhams
MASEN - Moroccan Agency for Solar Energy MENA - Middle East and North Africa METRAGAZ - The Maghreb-Europe Gas Pipeline Management Company
Mt - Megatonne MW - Megawatt MWh – Megawatt hour
NGCC – Natural Gas Combined-cycle NIHD - National Initiative for Human Development
NOx – Nitrous Oxide
OC – Other Countries
OCP - Office Chérifien des Phosphates OECD - Organization for Economic Co-operation and Development
OECD+ - OECD Countries, plus EU Countries not in the OECD
OME – Other Major Economies ONE - National Office of Electricity ONHYM - National Office of Hydrocarbons and Mining
PC - Pulverized Coal
PCE - Production Concessionnel d‟Electricité PM10 – Particulate Matter of less than 10 micron diameter
PNAP - National Plan of Priority Actions ppp – Purchasing power parities
PV - Photovoltaic RE – Renewable Energy
RES - Renewable Energy Sources s - second
SAMIR - The Moroccan Refining Company SCNR – Selective Noncatalytic Reduction SCR – Selective Catalytic Reduction
SIE - Société d‟Investissements Energétiques SO2 - Sulfur Dioxide
t - tonne
TFC – Total Final Consumption tkm - tonne-kilometre
toe – tonne of oil equivalent
TPES - Total Primary Energy Supply UNFCCC - United Nations Framework Convention on Climate Change VHV – Very High Voltage WEO – World Energy Outlook yr – year
Rita da Penha Gonçalves Pereira Machado i
Table of contents
Abstract ... viiResumo ... viii
List of Abbreviations and Acronyms ... ix
List of tables ... iv
List of figures ... vi
1 Introduction ... 1
2 Global Energy Demand and Energy-related CO2 Emissions ... 3
2.1 Energy Demand and Supply ... 3
2.1.1 Energy-related CO2 Emissions ... 4
2.1.2 Energy-related Past Trends Problematic ... 7
2.2 Global Energy Scenarios and Climate Change... 7
2.3 Energy Efficiency ... 12 2.4 Renewable Energy ... 14 2.5 Nuclear Power ... 17 3 CCS technologies ... 19 3.1 CO2 Capture ... 19 3.1.1 Post-combustion CO2 Capture ... 21 3.1.2 Oxy-fuel CO2 Capture ... 22 3.1.3 Pre-Combustion CO2 Capture ... 23
3.2 Power Plants and CCS ... 24
3.2.1 Power Plants - CCS Tehcnologies Performance and Efficiency Penalties ... 24
3.2.2 Power Plants - Retrofitting with CCS technologies ... 25
3.3 CCS Technologies Applications beyond the Power Sector... 26
3.3.1 High-purity CO2 Sources ... 26
Rita da Penha Gonçalves Pereira Machado ii
3.3.3 Iron and Steel Production ... 28
3.3.4 Refineries ... 28
3.3.5 Pulp and Paper Plants ... 28
3.4 CO2 Transportation and Storage ... 28
3.5 CCS Technologies - International Status ... 30
3.5.1 Projects ... 30
3.5.2 Costs ... 34
3.5.3 Legal and Regulatory Framework ... 36
4 COMET Project ... 37
5 Moroccan Energy System ... 39
5.1 General Description of the Country ... 39
5.2 Macro and Socio-Economic Drivers ... 40
5.2.1 Population ... 40
5.2.2 Economy ... 40
5.3 Overview of the Energy System ... 42
5.3.1 Power Sector ... 48 5.3.1.1 Power Demand ... 48 5.3.1.2 Power Supply ... 50 5.3.1.3 Generation Capacity ... 52 5.3.1.4 Electricity Transmission ... 57 5.3.1.5 Electricity Distribution ... 58
5.3.1.6 Domestic Energy Resources ... 59
5.3.2 Energy End-use Sectors ... 62
5.3.2.1 Transport Sector ... 62
5.3.2.2 Industry Sector ... 65
5.3.2.3 Residential and Commercial Sectors ... 66
5.3.2.4 Agriculture Sector ... 67
Rita da Penha Gonçalves Pereira Machado iii
5.3.3 Greenhouse Gases Emissions ... 68
5.3.3.1 Energy Related CO2 Emissions ... 68
5.3.3.2 Methane, Nitrous oxide and PM10 Emissions ... 70
5.4 Energy Policies ... 72
5.4.1 Energy Players ... 73
5.4.2 Market Structure ... 73
5.4.3 Programs and Measures to Promote Renewable Energy ... 74
5.4.4 Programs and Measures to Promote Energy Efficiency ... 74
5.4.5 Climate Change ... 75 5.4.6 Sustainable Development ... 76 6 Final Remarks ... 77 7 Conclusions ... 79 8 Future Work ... 81 References ... 83
Rita da Penha Gonçalves Pereira Machado iv
List of tables
Table 2-1 – World primary energy demand by fuel (Mtoe) (IEA, 2010b) ... 3Table 2-2 – World electricity generation (TWh) (IEA, 2010b) ... 6
Table 2-3 – World primary energy demand by fuel and scenario (Mtoe) (IEA, 2010b) ... 9
Table 2-4 – Capacity additions by fuel and region in the 450 Scenario (GW) (IEA, 2010b) ... 11
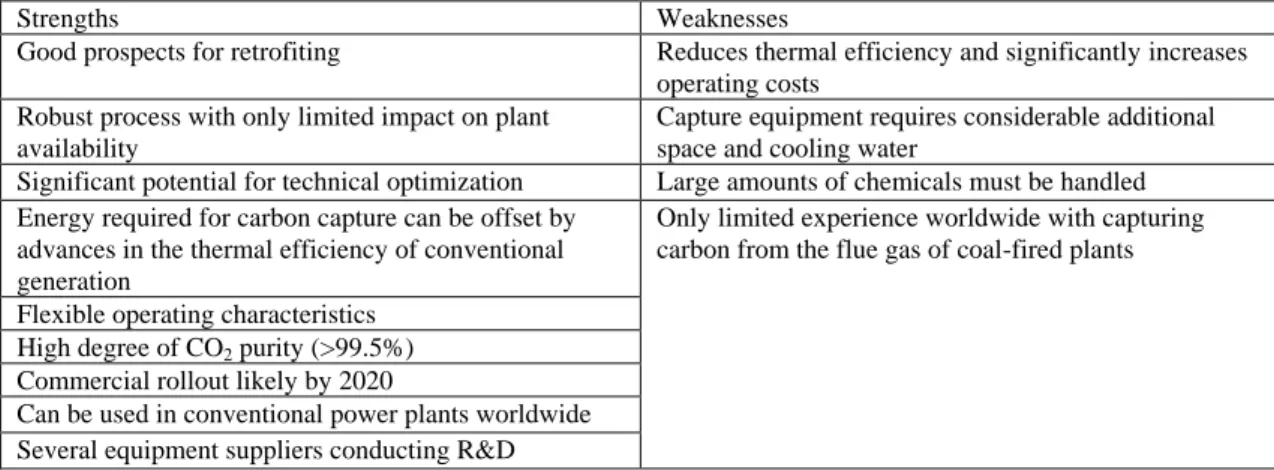
Table 3-1 – Overview of the advantages and disadvantages of post-combustion CO2 capture technologies (EON, 2011) ... 22
Table 3-2 - Overview of the advantages and disadvantages of oxy-fuel combustion technologies (EON, 2011) 23 Table 3-3 - Overview of the advantages and disadvantages of pre-combustion technologies (EON, 2011) (Figueroa, et al. 2007) ... 24
Table 3-4 - Power generation performance (IEA, 2011b) ... 24
Table 3-5 – Types of geological storage and current status (GCI, 2011a) ... 29
Table 3-6 – Asset lifecycle model (GCI, 2011a) ... 31
Table 3-7 – Active CCS LSIP (GCI, 2011a). ... 31
Table 3-8 – CO2 storage large-scale projects (GCI, 2011a) ... 33
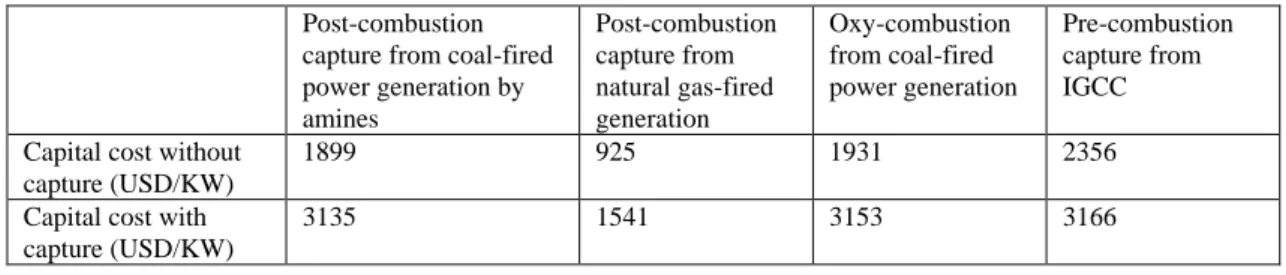
Table 3-9 – Economic data for CO2 capture (including conditioning and compression) in power plants (2010 USD) (IEA, 2011b). ... 34
Table 3-10 – CCS costs in industrial processes (GCI, 2011a). ... 35
Table 5-1 - Moroccan population indicators (Eurostat, 2010; Eurostat 2011 ; SNC, 2010) ... 40
Table 5-2 - GDP per capita at 2010 market prices (EUR) (Eurostat, 2010) ... 40
Table 5-3- GVA by sector (%) (Eurostat, 2009) ... 41
Table 5-4 - Moroccan GDP annual growth, GDP deflator evolution and the GDP based on purchasing-power-parity (PPP) share of world total development until 2016 (IMF, 2011) ... 41
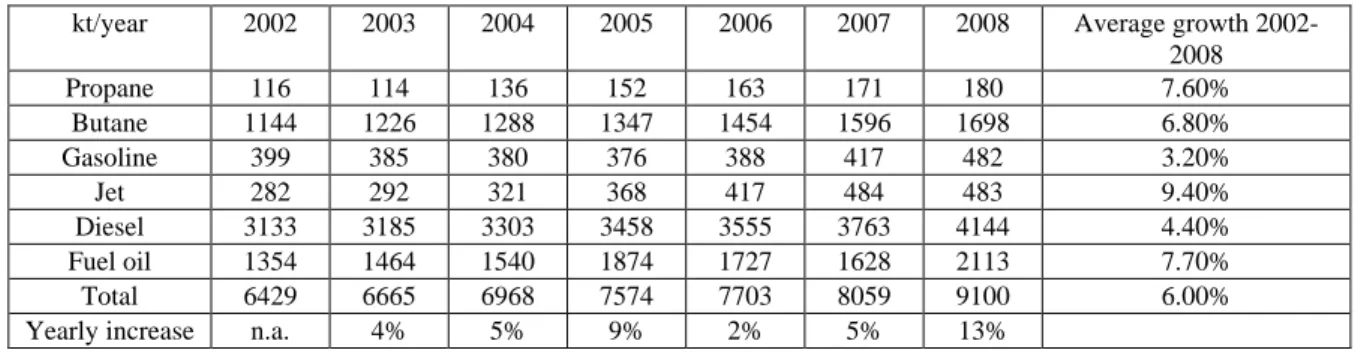
Table 5-5 – Petroleum products consumption in Morocco between 2002 and 2008 (ESMAP, 2009) ... 45
Table 5-6 - Moroccan refinery production (1000 toe) in 2007 (Eurostat, 2010) ... 46
Table 5-7- 2008 Energy Balance (in thousand tonnes of oil equivalent (ktoe) on a net calorific value basis) (IEA, 2011i.) ... 47
Table 5-8 - Load profiles of 29 July 2008 and 28 July 2009 (ONE, 2009) ... 49
Table 5-9- Capacity and projected annual power generation of the 5 plants (AMDI, 2011) (ONE, 2009b) ... 53 Table 5-10 - Moroccan‟s hydroelectric power plants net production between 2000 and 2008 (COMET, 2011) 54
Rita da Penha Gonçalves Pereira Machado v
Table 5-11 - Existing power plants as of December 31, 2008, its watercourse, total unit and its net production (COMET, 2011) ... 54
Table 5-12 - Installed capacity at the end of 2005 (MW) (ONE, 2005) ... 56
Table 5-13- Moroccan thermal production (GWh) in 2005 (ONE, 2005) ... 56
Table 5-14- Installed capacity at the end of 2009 (MW) (ONE, 2009) ... 56
Table 5-15– Moroccan electricity production and imports between 1999 and 2008 (MEMEE, 2008) ... 57
Table 5-16 - Recent transmission network developments (ONE, 2009) ... 58
Table 5-17 - Residential electricity prices (RECREEE, 2010) ... 59
Table 5-18 - Residential electricity prices for rural consumers (RECREEE, 2010) ... 59
Table 5-19 - Electricity prices for HV consumers (option of annual duration) (RECREEE, 2010) ... 59
Table 5-20 - Lenght of the main transport networks (Km) (Eurostat, 2010) ... 63
Table 5-21 - Number of passenger cars (1000), of road goods vehicles (1000) and of buses and coaches (1000) (Eurostat, 2010) ... 63
Table 5-22- Number of locomotives and goods transport wagons in 2008 (1000) (Eurostat, 2010) ... 64
Table 5-23- Rail freight transport (million tkm) (Eurostat, 2010) ... 64
Table 5-24 - Projection of the cement production and consumption until 2030 (SNC, 2010) ... 66
Table 5-25 - Phosphate rock production (million metric ton) (Kent, J.A., 2007) ... 66
Table 5-26 - Consumption of petroleum products by households, by product (1000 toe), in 2007 (Eurostat, 2010) ... 66
Rita da Penha Gonçalves Pereira Machado vi
List of figures
Figure 2-1 – Evolution of the global TPES, population and GDP using ppp (within 1971 and 2008) (IEA, 2010) ... 3Figure 2-2 – Global CO2 emissions by fuel (IEA, 2010) ... 5
Figure 2-3 – CO2 emissions by sector (IEA, 2010) ... 6
Figure 2-4 – World primary energy demand by scenario (IEA, 2010b) ... 9
Figure 2-5 – World energy-related CO2 emissions savings by policy measure in the 450 Scenario (IEA, 2010b) ... 11
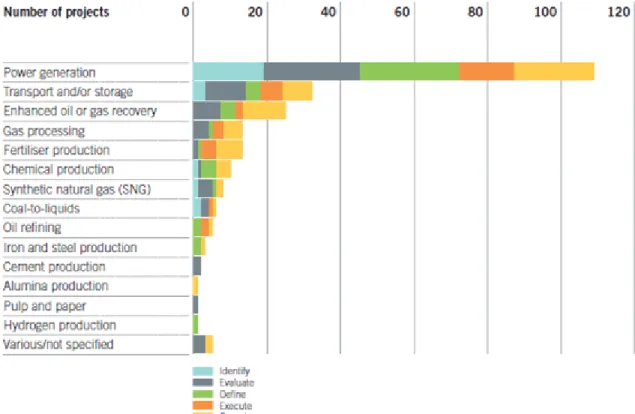
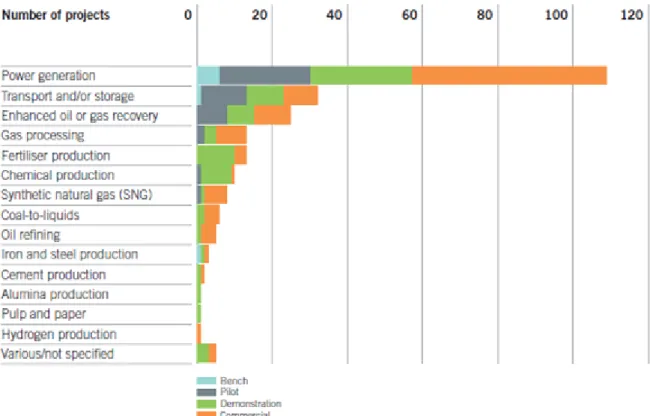
Figure 3-1 - All active and planned projects by industry sector and by asset lifecycle stage (GCI, 2011a). ... 32
Figure 3-2 - All active and planned projects by industry sector and by technology maturity (GCI, 2011a). ... 33
Figure 4-1- COMET project structure (COMET project, 2011) ... 38
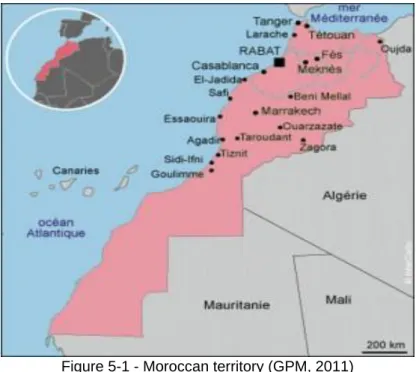
Figure 5-1 - Moroccan territory (GPM, 2011) ... 39
Figure 5-2- GDP by sector in 2007 (percentage) (AEO, 2009) ... 41
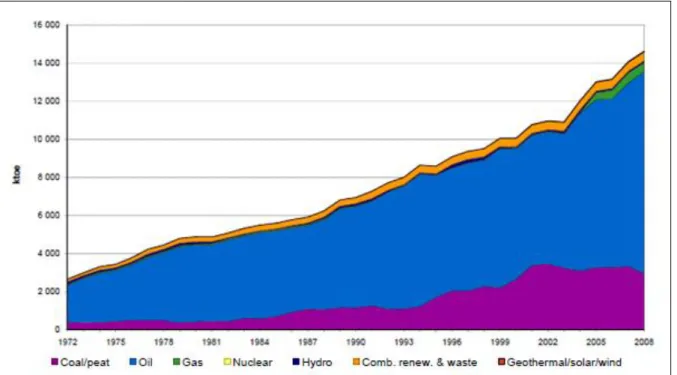
Figure 5-3 – Energy use evolution between 1995 and 2008 (kt of oil equivalent) (World Bank, 2011) ... 42
Figure 5-4 - Energy use per capita (kg of oil equivalent per capita) (World Bank, 2011) ... 43
Figure 5-5 - Total primary energy supply excluding electricity trade (IEA, 2011i) ... 43
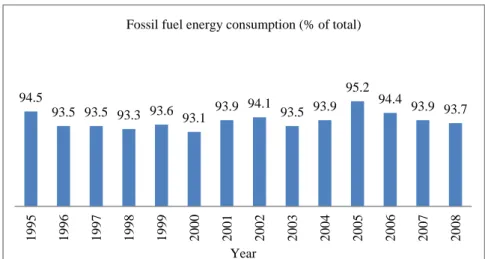
Figure 5-6 – Fossil fuel energy consumption (% of total) between 1995 and 2008 (World Bank, 2011) ... 44
Figure 5-7 – Combustible renewables and waste consumption (% of total energy) between 1996 and 2008 (World Bank, 2011) ... 44
Figure 5-8 – Alternative energy use (% of total energy use) between 1995 and 2008 (World Bank, 2011) ... 45
Figure 5-9 – TPES in 2008 (excludes electricity trades) (IEA, 2011i) ... 45
Figure 5-10 – Net energy imports (% of energy use) (World Bank, 2011) ... 46
Figure 5-11 – Energy imports by product in 2007 (%) (Eurostat, 2010) ... 47
Figure 5-12 – Rural electrification evolution between 1995 and 2009 (ONE, 2009) ... 48
Note: the power demand for 2008 is forecasted ... 49
Figure 5-13 – Power demand (GWh) evolution (MEMME, 2008) ... 49
Figure 5-14 - Load curve profiles of 29 July 2008 and 28 July 2009 (ONE, 2009) ... 50
Figure 5-15 – Electricity production from oil sources (GWh) (World Bank, 2011) ... 50
Figure 5-16 – Electricity production from coal sources (GWh) (World Bank, 2011) ... 51
Rita da Penha Gonçalves Pereira Machado vii
Figure 5-18 – Power supply by source within 2002 and 2008 (ESMAP, 2011) ... 52
Figure 5-19 - Power transmission and distribution losses as % of output between 1993 and 2008 (World Bank, 2011) ... 58
Figure 5-20 - Morocco‟s wind map (CDER, 2010) ... 61
Figure 5-21 - Morocco solar potential (MEMEE, 2010) ... 61
Figure 5-22 - Potential geothermal fields in Morocco (Zarhoule, 2011) ... 62
Figure 5-23 - Energy consumption by the transport sector as % of total final energy consumption (Eurostat, 2010) ... 63
Figure 5-24 – Energy consumption in industry as % of total final energy consumption (Eurostat, 2010) ... 65
Figure 5-25 – Total energy consumption in industry (1000 toe), 2007 (Eurostat, 2010) ... 65
Figure 5-26 – Energy consumption in households and other sectors as % of total final energy consumption (Eurostat, 2010) ... 66
Figure 5-27 – Usage split of the final energy consumption within the residential and industrial sectors in 2005 (ESMAP, 2009) ... 67
Figure 5-28 – Power consumption by sector in 2008 (IEA, 2011i) ... 68
Figure 5-29 - CO2 emissions from fuel combustion from 1971 to 2006 (Mt CO2 per year) (MEMME, 2009b) . 68 Figure 5-30 – CO2 emissions by sector between 1971 and 2007 (MEMME, 2009b) ... 69
Figure 5-31 - Share of cement production, solid fuels, liquid fuels and the total fossil fuel emissions (CDIAC, 2011) ... 70
Figure 5-32 - Moroccan methane emissions (Trading Economics, 2011) ... 70
Figure 5-33 - Agricultural methane emissions as % of total (Trading Economics, 2011) ... 71
Figure 5-34 - Moroccan nitrous oxide emissions (Trading Economics, 2011) ... 71
Figure 5-35 - Moroccan historical data for PM10 level (Trading Economics, 2011) ... 72
Rita da Penha Gonçalves Pereira Machado 1
1 Introduction
This thesis has been developed in the context of the COMET project. COMET project aims to study the techno-economic feasibility of integrating carbon dioxide transport and storage infrastructures in the West Mediterranean area and it involves Portugal, Spain and Morocco. This project considers several development scenarios for those countries energy systems within the time period 2010-2050 and takes into account the location and development of the energy related and industrial major CO2 emission sources as well as the available potential for geological storage in those countries. These countries long-term energy systems scenarios are to be modelled and evaluated through the technical economic models MARKAL/TIMES.
As part of COMET project this thesis presents the quantitative and qualitative input data to model the energy system of Morocco via MARKAL/TIMES. The input data includes, among others: energy transformation, consumption and CO2 emissions‟ trends of the energy sector and other industrial
activities; the identification of the installed capacity and future perspectives; an assessment of the energy end-use sectors; an estimation of the national energy resources; and an assessment of relevant energy related policies as MARKAL/TIMES is well suited to evaluate the global impact of policies within the energy sector. This thesis includes an analysis of the first modelling outcomes.
The present work is divided in nine chapters. Chapter two summarizes the past and present status of the Energy Sector in a global perspective. It introduces the problematic of energy related GHG emissions and climate change and includes IEA energy scenarios for the next decades. The potential and main characteristics of the key climate change mitigation options are also reviewed in this chapter. Chapter three overviews the CCS technologies process chain within its different options and applications. It summarizes the current status of the technologies in terms of projects, costs and regulatory and legal framework in a general approach. The fourth chapter presents the goals and motivations of COMET project, its structure and the thesis‟s role within the project itself. The fifth chapter presents the quantitative and qualitative information collected to model the energy system of Morocco via MARKAL/TIMES. Chapter six presents the final remarks. Chapter seven presents the conclusions of the thesis. Chapter eight identifies future work.
Rita da Penha Gonçalves Pereira Machado 3
2 Global Energy Demand and Energy-related CO
2Emissions
2.1
Energy Demand and Supply
Global energy demand has been steadily rising over the past several decades. Population and income growth are key driving forces behind the demand for energy (IEA, 2010). As the global energy demand upward trend is expected to continue in the coming decades, increasing uneasiness over energy security and environmental sustainability issues arise.
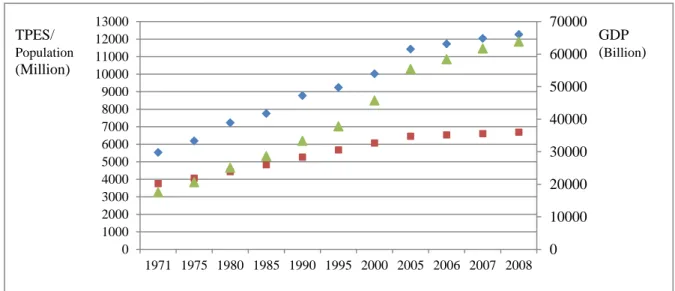
In 1971 the total primary energy supply (TPES) has been of 5533.5 Mtoe and, by 2008, it reached 12267.4 Mtoe, which means that within that period the TPES more than doubled (IEA 2010). Figure 2-1 presents the global population, real GDP using purchasing power parities (ppp) and TPES evolution within 1971 and 2008.
0 10000 20000 30000 40000 50000 60000 70000 0 1000 2000 3000 4000 5000 6000 7000 8000 9000 10000 11000 12000 13000 1971 1975 1980 1985 1990 1995 2000 2005 2006 2007 2008
Total primary energy supply (Toe) Population GDP using ppp (2000 US Dollars)
GDP (Billion) TPES/
Population
(Million)
Figure 2-1 – Evolution of the global TPES, population and GDP using ppp (within 1971 and 2008) (IEA, 2010)
The global energy intensity - the amount of energy necessary to generate each unit of GDP - has decreased progressively over the last decades owing to several factors such as energy efficiency (EE) improvements, fuel switching and structural adjustments in the global economy away from energy-intensive industries (IEA, 2010b). If no improvements in energy intensity had been accomplished, global energy consumption would be much higher today (IEA, 2010b).
In 1980 and 2008 almost 85% and 81% of the global energy demand was supplied from fossil fuels. Table 2-1 presents the world primary energy demand by fuel in 1980 and 2008 (IEA, 2010b).
Table 2-1 – World primary energy demand by fuel (Mtoe) (IEA, 2010b)
Oil Coal Gas Nuclear Hydro Biomass
and waste* Other renewables Total 2008 4059 3315 2596 712 276 1225 89 12271 1980 3107 1792 1234 186 148 749 12 7229
*Includes traditional and modern uses.
In 2009 the global economic recession induced the first energy consumption decline since 1982 which was mostly felt in OECD countries and in the territory of the Former Soviet Union, in line with its
Rita da Penha Gonçalves Pereira Machado 4
economies condition. In that year global oil consumption dropped 1.7%, representing the major decline since 1982. Coal consumption kept on fairly solid in 2009 representative of the minor annual change since 1999. In 2009 natural gas consumption registered the most rapid decline amongst fossil fuels and fell by 2.1%. In that year only hydroelectric and other renewable forms of energy registered an output growth. Hydroelectric generation has been the world‟s fastest-growing energy source in 2009. Fiscal incentive, in many countries, among other government encouragement measures, induced the global wind and solar generation capacity growth by 31% and 47% respectively. China and the US accounted for 62.4% of the whole wind generation growth (BP, 2010).
In 2010 driven by the economic recovery, global energy consumption grew by 5.6% which represented the largest increase in percentage terms since 1973. The growth in energy consumption has been felt worldwide:consumption in OECD countries grew by 3.5% and in non-OECD countries the energy consumption increased by 7.5% and was 63% beyond the 2000 totals. In that year, China energy consumption increased by 11.2% and became the world‟s largest energy consumer followed by the US (BP, 2011).
Energy prices development diverged. Oil prices rebounded worldwide (average oil prices for that year as a whole have been the 2nd highest in history), whereas natural gas and coal prices varied by region. Natural gas prices increased significantly in markets indexed to oil prices. Coal prices increased strongly in Europe but remained weak in Japan and North America (BP, 2011).
Accounting for 33.6% of global energy consumption, oil continued the world‟s most consumed fuel. After two succeeding years declining, global oil consumption increased 3.1% (reaching a record level of 87.4 million b/d). OECD consumption grew by 0.9%, the first grow after 2005. Beyond OECD, consumption evolution recorded a 5.5% growth. Growth persisted strong in China and Middle Eastern countries, with Chinese consumption rising by 10.4%. Even if 2010 has recorded the biggest percentage grow in oil consumption since 2004, it represents a minor global growth rate amongst fossil fuels (BP, 2011).
In 2010 coal accounted for 29.6% of global energy consumption and its consumption increased 7.6%, which represents the major overall growth since 2003. China accounted for nearly two-thirds of the global consumption growth. The coal consumption upsurge was also strong in OECD countries where consumption grew by 5.2%, the most solid growth since 1979 (BP, 2011).
The global natural gas consumption increased by 7.4% in 2010, which represents the fastest growth since 1984. Except in the Middle East, consumption growth was beyond average in all regions. The US had the world‟s largest rise in consumption in volumetric terms, growing by 5.6%. Russia and China both registered the largest volumetric increases in the country‟s history. Consumption in other Asian countries grew fast as well (10.7%), with India increasing its consumption by 21.5% (BP, 2011).
Worldwide, hydroelectric and nuclear production registered the biggest upsurge since 2004. Hydroelectric output increased by 5.3%. China was responsible for more than 60% of global hydroelectric growth owing to new capacity and wet weather. Global nuclear production increased by 2% with three-quarters of the growth coming from OECD economies. French nuclear production increased by 4.4%, which represented the major volumetric increase in the world. Globally, other renewable energy (RE) sources continued to grow rapidly. Biofuel production increased by 13.8% in that year and RE for power generation increased by 15.5%, owing to a steady growth in wind energy (22.7%) (BP, 2011).
2.1.1 Energy-related CO
2Emissions
In 1995, the Intergovernmental Panel on Climate Change (IPCC), in its Second Assessment Report, concluded that there is a balance of evidence that suggests a discernible human influence on climate change (IPCC, 1995). Indeed, even if GHG such as CO2, CH4, and N2O are constantly being emitted
to the atmosphere through natural processes, over the last 250 years anthropogenic activities related emissions have significantly altered their atmospheric concentrations.
Rita da Penha Gonçalves Pereira Machado 5
The CO2 atmospheric concentration has risen from 280 ppm in the pre-industrial period to 390 ppm by
the end of 2010 (IPCC, 2011). One other noteworthy fact is that atmospheric CO2 concentration has
increased by just 20 ppm over the 8000 proceeding years to industrialization whereas, since 1750, it has risen by more than 100 ppm. CO2 is one of the most prevalent GHG, and within the latter GHG
specified, CO2 presents the highest radiative forcing (RF1) (IPCC, 2005).
Among the many human activities that emit CO2, the energy sector represents by far the largest source
of emissions and fossil-fuel combustion is a central issue within the climate change debate. Besides fossil-fuel combustion within the power and the transport sectors, there are several other processes that emit substantial quantities of CO2. These, among others, include the following industrial intensive
processes: cement, iron and steel, chemicals and petrochemicals, pulp and paper and aluminum manufacture (IEA, 2011h). Changes in land use and forestry practices may, as well, release significant amounts of CO2 or act as a sink for CO2.
Between 1971 and 2008, global CO2 emissions from fuel combustion more than doubled, rising from
14096.3 to 29381.4 million ton. In 2008, global CO2 emissions increased 0.4 Gt representing a growth
rate of 1.5% comparatively to 2007 (IEA, 2010). In 2008, for the first time, the CO2 emission levels of
the Annex I countries dropped below 1990 levels and the aggregate emissions of the developing countries has been superior to those from the developed countries (IEA, 2010).
- Global Energy Related CO2 Emissions by Fuel
Coal - the utmost carbon-intensive of fossil fuels with nearly twice the carbon content per unit of energy as that of natural gas - has been, during the last decade, the fastest-growing energy source and the rate of emissions from coal use has risen from 0.6% per year within 1990 and 2000 and 4.8% per year within 2000 and 2007 (IEA, 2010b1) (IEA, 2011). Figure 2-2 presents the global CO2 emissions
by fuel, within 1971 and 2008.
Figure 2-2 – Global CO2 emissions by fuel (IEA, 2010)
This CO2 coal related emissions upsurge over a relatively short period can be explained by the
growing energy demand in coal based economies and by the intensification of coal-fired power generation in response to higher oil and gas prices (IEA, 2010b1). In 2010, 44% of the estimated CO2
emissions came from coal, 36% from oil and 20% from natural gas (IEA, 2011k).
1
RF is a concept used for quantitative comparisons of the strength of different human and natural agents that trigger climate change.
Rita da Penha Gonçalves Pereira Machado 6
The environmental concerns related to the use of coal comprise not only the associated CO2 emissions
and the implications of those for Climate Change but, among others: the emission of other gases and particulates produced within the combustion process such as NOx, SO2 and toxic trace elements and
the disposal of ash and spoil from processes associated with the mining of coal in the air, water and land.
- Energy Related CO2 Emissions by Sector
In 2008, within the energy system, the power and heat generation sector was categorically the major producer of CO2 emissions, being responsible for 41% of the CO2 emissions (Figure 2-4). In that year
the electricity generation sector emitted 11 Gt of CO2. In 2008, the combined share of the power and
heat generation and the transport sectors accounted for two-thirds of the CO2 emissions. The transport
and the manufacturing industries and constructions sectors accounted for 23% and 20% respectively of the CO2 emissions in 2008 (IEA, 2010). Figure 2-3 presents the increasing share of the electricity and
heat sectors on total energy related CO2 emissions.
Figure 2-3 – CO2 emissions by sector (IEA, 2010)
Generally, the power generation sector relies deeply on coal (IEA, 2010) (IEA, 2010b). Coal is crucial for global energy security, it is abundantly available, with sufficient supplies for more than 150 years, affordable, reliable and, easy and safe to transport (IEA, 2010b) (IEA, 2011a). In 1990 the global share of coal for power generation has been approximately 37%. In 2008, 41% of the global power generation came from coal, 21% from gas, 16% from hydro and 14% from nuclear (Table 2-2) (IEA, 2010b). Countries such as Australia, China, India, Poland and South Africa generate between 69% and 94% of their electricity and heat through coal combustion (IEA, 2010). Table 2-2 presents the global electricity generation by source in 1990 and 2008.
Table 2-2 – World electricity generation (TWh) (IEA, 2010b)
1990 2008 Total generation 11821 20183 Coal 4427 8273 Oil 1338 1104 Gas 1726 4303 Nuclear 2013 2731 Hydro 2145 3208
Rita da Penha Gonçalves Pereira Machado 7
1990 2008
Biomass and waste 131 267
Wind 4 219
Geothermal 36 65
Solar PV 0 12
CSP 1 1
Marine 1 1
By 2008 almost two-thirds of the global coal demand was for power sector consumption and another one-fifth for industrial sector use (IEA, 2010b). Since 1990 the share of coal in the power sector has grown by 10 percentage points while the share in industrial energy use has declined slightly (IEA, 2010b).
Decreasing CO2 emissions from coal-fired plants is a central concern within multiple proposals for
mitigating GHG emissions. Options include capturing and sequestering the CO2 emitted from the coal
plants, and increasing substituting coal-fired generation for other power sources such as wind or nuclear power. Another option is to replace coal power with increased use of natural gas generation since gas fired power using modern generating technology releases less than half of the CO2 per MWh
as of a coal-fired power plant (CRS, 2010). In fact, a typical 500 MW coal-fired power plant will emit around 400 tonnes of CO2/h, whereas a modern natural gas-fired combined cycle (NGCC) plant of the
same size will emit about 180 tonnes of CO2/h in the flue gases (CSFL, 2010).
2.1.2 Energy-related Past Trends Problematic
Even if in the past decade:- There has been a substantial rise in investment in RE worldwide; solar PV and wind power have achieved considerable deployment;
- The rate of EE development in OECD countries has begun to speed up again, after many years of modest gains;
- Major car companies were adding hybrid and full‐electric vehicles to their product lines and many governments had launched plans to encourage consumers to buy these vehicles; and - Public investment for RD&D in low‐carbon technology reached an all‐time high in 2009
(2011, IEA);
in 2010, according to the IEA, the energy-related CO2 emissions reached the highest level in history
and the present energy use and CO2 emissions trends run directly counter to the constant warnings sent
by the United Nations IPCC (IEA, 2011k) (IEA, 2010b1).
2.2
Global Energy Scenarios and Climate Change
The increasing demand of energy is considered a global multifaceted issue with ever rising complexity. It involves not just the question of whether the expected rise in energy demand can be met, but also whether this demand can be met sustainably, which mix of energy sources is optimal, and whether there may also be means to reduce demand without compromising the global economy. The IPCC stated that only scenarios resulting in a 50% to 80% reduction of global CO2 emissions by
2050, compared to 2000 levels, can limit the long-term global mean temperature rise within 2.0ºC to 2.4ºC.
In December 2009 heads of state met for the 15th Conference of Parties of the United Nations Framework Convention on Climate Change (UNFCCC) in Copenhagen. The resulting Copenhagen Accord, to which all major emitting countries and many others associated themselves, established a non-binding goal of restraining the long-term average increase in the global temperature to 2ºC above pre-industrial levels. Major emerging-market and developing countries undertook abatement pledges
Rita da Penha Gonçalves Pereira Machado 8
for the first time. The 2ºC goal has been further recognized as critical in the United Nations Climate Change Conference, held in Cancun, in 2010.
Even if the GHG in the atmosphere long-term stabilisation at 450 ppm by no means guarantees that the temperature increase will be limited to 2°C, targeting a 450 ppm of CO2 equivalent concentration is
often acknowledged as equivalent to the 2°C objective.
For strategic analysis and long-term planning many energy scenarios are continually being reported by either national or international organizations such as the IEA, the U.S. Department of Energy (DOE), the European Commission and the World Energy Council (WEC). All these organizations state that in the time frame of 2020-2030, worldwide energy demand will rise, keeping pace with population and economic growth in developing countries.
- IEA Scenarios
The 2010 edition of the World Energy Outlook (WEO), published by the IEA, provides energy demand and supply, updated projections until 2030 through three scenarios based on several different assumptions.
Its central scenario, entitled the New Policies Scenario (NPS), takes into account the general policy strategies and commitments that have been announced by numerous countries worldwide, in order to restrict the greenhouse effect and address energy security concerns, even where the measures to implement these commitments have yet to be identified or announced. The potential impacts of the implementation of those policy commitments on energy markets can be weighed, by comparing them with the projections from the Current Policies Scenario (CPS) in which no change in policies as of mid-2010 is assumed to be implemented. The third scenario, the 450 Scenario, sets out an energy pathway consistent with the target agreed at the UN climate meeting in Copenhagen in December 2009 to limit the increase in global temperature to 2ºC above pre-industrial levels. This scenario assumes the implementation of the high-end of national pledges and tougher policies after 2020 including the nearly entire elimination of fossil fuel consumption subsidies (globally) to achieve the objective of limiting the concentration of GHG in the atmosphere to 450 parts per million of CO2
equivalent (IEA, 2010b).
All three IEA scenarios have the same assumptions about population growth. Global population is projected to grow from an estimated 6.7 billion in 2008 to around 8.5 billion in 2030 – an average rate of increase of nearly 1% per year. Most of the increase in global population will occur in non-OECD countries, particularly in Asia and Africa. In fact, these countries population is estimated to increase from 5.5 billion in 2008 to 7.2 billion in 2035 corresponding to an average annual growth rate of 1%. In the OECD countries, most of the population growth is expected in North America. Projections suggest that the OECD population will increase by 0.4% annually, between 2008 and 2035 (IEA, 2010b).
All three IEA scenarios have the same assumptions regarding economic growth as well. The three scenarios projections are extremely sensitive to the GDP growth rate estimations since energy demand tends to rise in line with GDP, yet usually at a lower rate (IEA, 2010b). The 2010 edition of the WEO assumes that within the 2008-2035 time period the world economy grows on average by 4.4% per year. OECD countries GDP annual growth is expected to reach 1.8% and non-OECD countries GDP is expected to grow by 4.6% per year over the same projection period.
- Global Energy Demand
For the 2008 to 2035 period the energy demand projections from the three WEO 2010 scenarios differ considerably. In the NPS global energy demand is projected to increase by 1.2% annually reaching 16750 Mtoe by 2035. In the CPS, global energy demand is estimated to increase on a higher rate, by 1.4% per year, reaching 18048 Mtoe by 2035. At a comparatively lower rate, in the 450 Scenario, the global energy demand grows by 1.7% annually reaching 14920 Mtoe by 2035 (Figure 2-6) (Energy
Rita da Penha Gonçalves Pereira Machado 9
prices warrant that projected supply and demand are in balance during the Outlook period in all scenarios) (IEA, 2010b).
Figure 2-4 – World primary energy demand by scenario (IEA, 2010b)
The policies that are assumed to be brought together in the NPS and 450 Scenario have a noteworthy impact on the energy intensity rate decline over the projection period. In the CPS, the energy intensity declines as well, but at an inferior rate. Compared to 2008, by 2035 the energy intensity declines 28% in the CPS, 34% in the NPS and 41% in the 450 Scenario (IEA, 2010b).
By 2035 in all three scenarios, fossil fuels keep on being the dominant primary energy sources altough their share on the overall primary fuel mix differs significantly. By 2035 the fossil fuels share projections from the NPS, the CPS and the 450 Scenario are 74%, 79% and 62% respectively. The renewables and nuclear share projections are considerably higher in the 450 Scenario (Table 2-3) (IEA, 2010b).
Table 2-3 – World primary energy demand by fuel and scenario (Mtoe) (IEA, 2010b)
NPS CPS 450 Scenario 2020 2035 2020 2035 2020 2035 Coal 3966 3943 4307 5281 3743 2496 Oil 4346 4662 4443 5026 4175 3816 Gas 3132 3748 3166 4039 2960 2985 Nuclear 968 1273 915 1081 1003 1676 Hydro 376 476 364 439 383 519
Biomass and waste* 1501 1957 1461 1715 1539 2316
Other renewables 268 699 239 468 325 1112
Total 14556 16748 14896 18048 14127 14920
* Includes traditional and modern uses.
- Energy-related CO2 Emissions
According to the IEA, in order to embark into a trajectory that is compatible with the long-term stabilisation of the atmospheric concentration at 450 ppm CO2-eq, energy-related emissions need to
fall to 21.7 Gt CO2 by 2035 (IEA, 2010b).
Energy Related CO2 Emissions in the NPS
Under the assumptions of the NPS, energy related emissions in the OECD countries peak before 2015 and decay to 11.8 Gt in 2020, 7% above 1990 levels. Supposing that OECD countries intensify domestic reduction efforts after 2020, OECD emissions gradually decline to 10 Gt in 2035. In
non-Rita da Penha Gonçalves Pereira Machado 10
OECD countries, energy-related CO2 emissions are projected to jump from 15.7 Gt in 2008 to 20.8 Gt
by 2020 and 24 Gt by 2035 (IEA, 2010b).
In 2008, coal has been responsible for the largest share on total CO2 emissions, followed by oil and
gas. In the NPS this order remains identical by 2035. Still, the share of coal decreases to 41% and that of oil to 36%, while the share of gas extends to 24%. In 2008 emissions from bunker fuels accounted for 3.5% and by 2035 its share increases to 4.0% (IEA, 2010b).
Even though the projection for GHG emissions in the NPS represents a clear improvement on current trends (emissions in the CPS reach 35.4 Gt in 2020 and continue to increase across the projected period), between 2008 and 2035, global energy related CO2 emissions increase by 21%, from 29.3 Gt
to 35.4 Gt precluding the 450 ppm CO2 eq target. The NPS places the world in a path consistent with
stabilising the concentration of GHG at just over 650 ppm CO2-eq, resulting in an estimated
temperature rise of over 3.5ºC above pre-industrial levels in the long term (IEA, 2010b). Energy Related CO2 Emissions in the 450 Scenario
The 450 Scenario sets a path consistent with the long-term stabilisation of the atmospheric concentration at 450 ppm of CO2 equivalent (emissions in the 450 Scenario reach 31.9 Gt in 2020 and
decline to 21.7 Gt in 3035). The GHG atmospheric concentration in the 450 Scenario reaches a highest at some 520 ppm CO2-eq around 2040 before declining back to 450 ppm CO2-eq by around 2150. This
scenario points out the most economical way of meeting the climate goals, presenting, given the current policy context, the scale of action required to do so (IEA, 2010b).
In order to decarbonise the energy economy so drastically, the commitment of all countries to impose tougher supplementary and complementary abatement policies and measures as of 2020 is mandatory (IEA, 2010b).
The elimination and reduction of subsidies on fossil fuels accounts for 1.4 Gt of CO2 emissions
avoidances in 2035 compared with the CPS. Substantial spending on energy efficiency and low-carbon technologies in order to achieve the 450 Scenario is required, and further spending in the 2010-2035 period extends to $18 trillion compared with the CPS and $13.5 trillion compared with the NPS (IEA, 2010b).
- Global energy related CO2 emission savings by policy measure – IEA 450 Scenario
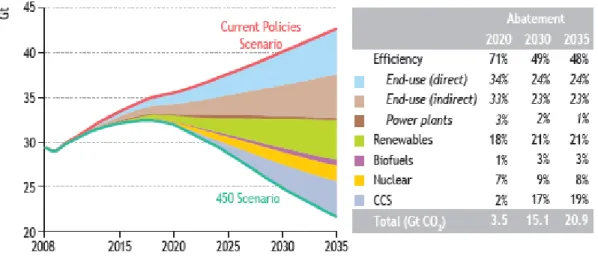
Atmospheric emissions avoidances in the 450 Scenario, comparatively to the CPS, amount to 3.5 Gt in 2020 and to 20.9 Gt in 2035. The IEA identifies the most cost-effective portfolio of technologies to attain the latter emission reductions targets. The share of the different measures to be taken in pursuit of the 450 Scenario abatement commitments varies over time. Once low-cost options are exhausted, other expensive options have to be applied (Figure 2-7) (IEA, 2010b).
Rita da Penha Gonçalves Pereira Machado 11 Figure 2-5 – World energy-related CO2 emissions savings by policy measure in the 450 Scenario
(IEA, 2010b)
Under the assumptions of the IEA 450 Scenario, the end-use efficiency share on the total CO2
abatement compared to the CPS is 67% by 2020 (when total abetment is of 3.5 Gt CO2). Whereas, by
2035, at the time when total CO2 abatement target amounts to 20.9 Gt (in relation to the CPS), the CO2
abatement share of the end-use efficiency decreases to 47%. The CO2 price plays a critical role in EE
developments (IEA, 2010b).
As long as support policies that go beyond the impact of the price of CO2 are established, RE
deployment together with biofuels, account for a rising share of CO2 savings throughout the projection
timeframe, increasing from 19% in 2020 to 24% in 2035. Nuclear power share on CO2 abatement by
the end of the projection period amounts to 8% (IEA, 2010b).
Within the projection period CCS becomes a critical abatement technology and by 2035 it accounts for nearly one-fifth of the total CO2 abatement target. In this scenario, CCS is deployed in new coal and
gas-fired power plants after 2020 in OECD+2 and Other Major Economies3 and is broadly used as a retrofit measure as well. CCS also becomes a fundamental abatement alternative in some emissions intensive industrial sectors, such as cement, iron and steel, chemicals, and pulp and paper, as well as in energy transformation processes such as coal-to-liquids (IEA, 2010b).
According to the IEA, decarbonizing the power sector is of crucial importance to make deep cuts on CO2 emissions and even though fossil fuels keep on being the dominant fuels on the primary energy
mix in the 450 Scenario, the power sector is considerably decarbonised by 2035, especially in developed countries, and over three-quarters of global electricity generation is low-carbon (IEA, 2010b). This low carbon target entails an intensive low-carbon technologies deployment in order to displace inefficient thermal plants, and to meet the growth in electricity demand, while keeping an affordable and secure service to consumers (Table 2-4) (IEA, 2010b).
Table 2-4 – Capacity additions by fuel and region in the 450 Scenario (GW) (IEA, 2010b)
2010-2020 2021-2035
World OECD+ OME OC World OECD+ OME OC
Coal 576 91 356 127 438 140 236 62 CCS-equipped* 13 9 3 1 408 188 213 8 Oil 31 6 17 8 35 9 13 12 Gas 434 148 186 100 480 168 215 97 2
OECD+ includes all OECD countries plus non-OECD EU countries.
3
Rita da Penha Gonçalves Pereira Machado 12 2010-2020 2021-2035 CCS-equiped* 4 4 1 0 173 104 69 1 Nuclear 137 46 75 16 387 165 145 77 Hydro 364 60 192 113 497 65 167 265 Biomass 73 44 17 12 234 80 89 65 Wind-onshore 430 245 150 35 840 381 302 157 Wind-offshore 67 42 20 4 298 170 91 36 Solar PV 123 81 21 21 652 238 233 181 Concentrating solar power 39 18 11 9 185 75 68 42 Geothermal 12 5 1 5 35 13 7 15 Marine 1 1 - 0 19 17 1 1 Total 2285 787 1047 451 4100 1522 1568 1010
* CCS-equipped capacity additions in the table may exceed the overall additions of the corresponding fuels as this table includes plant retrofit.
- CCS deployment – 450 Scenario Requirements
By 2030, in comparison with the 450 Scenario published within the 2009 WEO, CCS in the 2010 IEA 450 Scenario plays a further significant role in emission reduction (to the extent of 1.2 Gt more). In the latter Scenario, CCS retrofit plays a larger role, particularly in China and the United States (IEA, 2010b). This degree of CCS deployment involves a supplementary investement of $1.3 trillion of that within the CPS in the 2010 to 2035 period, representing nearly 8% of the total investment required to achieve the 450 Scenario path. A large number of CCS projects take place in OECD+ countries, as the price of CO2 in the power and industry sectors certifies it as feasible options subsequently to a period
between 2010 and 2020 in which government investments to fund CCS demonstration projects amount to an average annual of $3.5 to $4 billion (IEA, 2010b).
Shortly after 2020, subsequently the introduction of a CO2 price, CCS deployment extents to Other
Major Economies as well. By 2035, in OECD+, CCS technologies account for 25% of abatement or 1.6 Gt of CO2 and in Other Major Economies accounts for 21% of abatement or 2 Gt of CO2 (IEA,
2010b).
In order to achive this sum of abatement, extended international co-operation and financing for CCS demonstration in developing countries is necessary, possibly through the Clean Development Mechanism (CDM) or an alternative financing mechanism generating offset credits. The implementation of legal and regulatory frameworks and systematic mapping of storage sites is also necessary (IEA, 2010b).
The benefits and main characteristics of EE, RES and Nuclear energy are briefly overviewed within the following section. In the succeeding chapter, CCS technologies will be discussed in further detail in the context of the dissertation.
2.3
Energy Efficiency
Benefits of Energy EfficiencyEnergy Efficiency (EE) was first considered by some surveyed companies as early as 1970 and the average date for setting EE targets was 1998 (Hoffman, A.J., 2007). The history of EE is intimately bound up with the notions of progress, growth and power. Indeed, there is a continuous race between EE and economic growth. If the latter is faster than the rate of EE increase, then total energy consumption increases, as it has been historically (Boyle G., 2003).
EE improvement is recognised by the International Community as an essential cost-effective requirement to address energy sustainability concerns and to serve multiple proposes, such as:
- Enhance energy security (reduce domestic demand and imported energy to maximize exports, increase reliability and control energy demand growth);
Rita da Penha Gonçalves Pereira Machado 13
- Boost economic development and competitiveness (reduce energy intensity, improve industrial competitiveness, reduce production costs and achieve more affordable energy customer costs);
- Reduce climate change (contribute to global mitigation and adaption efforts, meet international obligations under the UNFCCC);
- Improve public health (reduce indoor and local pollution) (IEA, 2010c).
Even if the global energy intensity has improved, at an average rate of 1.7% per year, since the early 1970s, this enhancement must be measured against overall increases in energy consumption and CO2
emissions resulting from population and economic growth (IEA, 2011).
EE improvements can be pursued in all conversion and end-use processes in the energy system and EE can and should be enhanced worldwide, within all the different sectors ( IEA, 2011).
Energy Efficiency opportunities by Sector
Decarbonizing the power and heat sector is critical in order to achieve deep CO2 emissions cuts and
one of the most important near-term approaches for reducing CO2 emissions from fossil-fired power
generation is to improve the efficiency of new and existing plants. There are several solutions for maximizing EE within the power and heat generation sector, for instance, through the adoption of the best available technologies and the upgrading or replacement of older inefficient plants. This, along with EE improvements within power transmission and distribution would result in important fossil fuel savings and CO2 emissions reduction and consequently increase the sustainability of the overall
energy sector.
Pursuing EE improvements within residential, commercial and public-service buildings is also an issue of major importance since buildings account for close to 40% of energy used in most countries (IEA site). The energy use in this sector includes space heating and cooling, water heating, lighting, appliances and cooking and business equipment (IEA, 2010b).Presently, space heating and cooling as well as hot water are estimated to account for approximately half of global energy consumption in buildings (IEA, 2011d). The largest technical potential for energy savings in residential, commercial and public-service buildings consists on EE building design, implemented together with efficient heating and cooling systems/equipment. For users and owners of buildings in general, EE measures are most often feasible, as savings pay for the additional investment costs over time. Within OECD and economies in transition, the low retirement rate of buildings and the relatively modest extension, implies that most of the energy savings potential involves retrofitting and purchasing new technologies for the prevailing building stock. In developing countries instead, where the construction expansion of new building is expected, opportunities exist to secure significant energy savings through improved EE standards for new buildings (IEA, 2010d).
As regards the industrial sector, it has achieved considerable EE improvements in the last decades, but this progress pales beside the increased industrial production worldwide (IEA, 2010d). In fact, this sector is currently responsible for about one third of all the energy used worldwide and for almost 40% of global CO2 emissions. Therefore, reducing the CO2 intensity of the most widely produced
commodities such as cement, iron and steel, chemicals and petrochemicals, paper and paperboard and aluminium by decoupling energy consumption from output via enhancing EE within the industrial facilities and processes, and moving to best available technologies is necessary to reduce environmental problems (IEA, 2011e).
As to the transport sector, it is the second-largest CO2 emitter followed by industry and buildings
(IEA, 2010b) and the highest energy final consumer and it is forecasted to remain so if no EE improvements and additional measures are pursued. Accomplishing deep cuts in CO2 emissions in this
sector will hinge on decelerating the increase in fuel transport use, by greater EE improvements and raising the share of low-carbon fuels (IEA, 2010d). In 2008 the IEA published EE recommendations for the transport sector. These have focused on road transport and policies on improving EE of tires, fuel economy standards for both light-duty vehicles and heavy-duty vehicles, and eco-driving. Fiscal measures were not incorporated in the current IEA transport EE recommendations. However, financial
Rita da Penha Gonçalves Pereira Machado 14
incentives or penalties would promote the purchase of more EE vehicles and therefore accelerate the deployment of EE technologies.
Barriers to Energy Efficiency further deployment
Abundant cost-effective EE potential is considered to be unexploited and EE can and should be enhanced across all sectors. Still, many EE projects with strong financial rates of returns remain unimplemented worldwide, but principally in developing and emerging countries. Indeed, despite the potential benefits, realizing EE improvements can be blocked by the following barriers:
- Market: market organisation and price distortions impede customers from appraising the true value of EE; split incentive problems created when investors cannot capture the benefits of improved efficiency; transaction costs (projections development costs are high relative to energy savings);
- Financial: up-front costs and dispersed benefits discourage investors; perception of EE investments as complex and risky, with high transaction costs; lack of awareness of financial benefits on the part of financial institutions;
- Information and awareness: lack of necessary information and understanding, on the consumers side, to make rational consumption and investment decisions);
- Regulatory and institutional: energy tariffs that discourage EE investment; incentive structures encourage energy providers to sell energy rather than invest in cost-effective EE, institutional bias towards supply-side investments;
- Technical: privation of affordable EE technologies suitable to local conditions; unsatisfactory capacity to identify, develop, implement and maintain EE investments (IEA, 2010c).
Policies to support Energy Efficiency
In order to address the previously mentioned barriers to EE development, several governments at all levels have, over the years, introduced different policies, such as:
- Pricing mechanisms: variable tariffs where higher consumption levels invoke higher unit prices;
- Regulatory and control mechanisms: compulsory activities, such as energy audits and energy management, minimum energy performance standards, energy consumption reduction targets, EE investment obligations on private companies;
- Fiscal measures and tax incentives: grants, subsidies and tax incentives for EE investments, direct procurement of EE goods and services;
- Promotional and market transformation mechanisms: public information campaigns and promotions, inclusion of EE in school curricula, appliance labelling and building certification; - Technology development: development and demonstration of EE technologies;
- Commercial development and capacity building: creation of energy service companies, training programmes, development of EE industry;
- Financial remediation: revolving funds for EE investments, project preparation facilities, contingent financing facilities (IEA, 2010c).
2.4
Renewable Energy
Benefits of Renewable Energy
The Renewable Energy (RE) potential is wide and can supply a large portion of energy demand. RE sources derive directly or indirectly from natural processes connected to sunlight, heat stored in the
Rita da Penha Gonçalves Pereira Machado 15
earth or gravitional forces and are continuously, naturally replenished (IEA, 2011f). The array of benefits arising from the greater development and deployment of RE - within a portfolio of low-carbon and cost-competitive energy technologies capable of responding to the emerging major challenges of climate change, energy security, and access to energy - is well acknowledged and it has become a priority for both governments of IEA member countries and emerging economies. Indeed, more than 70 governments around the world, including all IEA members, have already introduced targets and policies to support the deployment of RE technologies (IEA, 2011g).
Overview of the main RES characteristics Solar
Solar energy is categorically the most abundant energy resource available on earth. At the time there are three main technologies to harness the solar energy: solar photovoltaic (PV) and concentrating solar power (CSP) to provide electricity, and solar thermal collectors for heating and cooling (IEA, 2010b).
PV systems are commercially available technologies that transform direct and diffused solar radiation into electricity, by means of a photovoltaic process, using semi-conductor devices. PV systems can be deployed anywhere in the world on apposite land and on houses. PV technology is very modular and can be installed close to centres of demand. These technologies are, as well proper for off-grid electrification. As solar PV is a variable source of power, its integration into the grid may be challenging for system operators where it is used on a large scale. Conversely, peak production takes place during the day, usually matching, in hot regions, with peak electricity demand, often driven by air conditioning loads (IEA, 2010b).
CSP is a proven technology that produces high-temperature heat for electricity generation or for co-generation of electricity and heat. CSP systems are only able to convert direct normal irradiation. Therefore, suitable areas for CSP deployment are those with strong sunshine and clear skies, frequently arid or semi-arid areas. CSP technology opens up the prospect of thermal energy storage and hybrid designs, for instance, with natural gas co-firing. If equipped with adequate storage capacity, CSP systems could provide base-load power (IEA, 2010b).
Solar thermal collectors produce heat from solar radiation, by heating a fluid that circulates through a collector. Similar to PV panels, these systems are able to convert both direct and diffuse light and for that reason can be installed anywhere in the world. The collectors produce comparatively low temperature heat, apposite for space heating and hot water production in buildings and some lower temperature industrial applications. Since solar thermal heat is not always available when needed, solar thermal collectors are relatively inapt to replace other sources of heat, at least until inter-seasonal storage becomes affordable. The potential of these technologies for industrial proposes is almost unexploited for the moment (IEA, 2010b).
Wind power
The kinetic energy of wind is converted in wind turbines into electricity. Suitable wind speeds for electricity generation (from 4 m/s to 25 m/s) are virtually attainable all over the world, with the exception of certain equatorial areas. Wind power is converted onshore and off-shore, where typically wind speeds are higher and the wind is available for longer periods of time. The distance from centres of demand onshore and water depth are key aspects for the deployment of these technologies off-shore. Similar to solar, wind is a variable source of power and the output increases and drops as wind strength fluctuates. Therefore, integrating wind power into grids, particularly once wind becomes a major component of the total system, is challenging (IEA, 2010b).
Hydropower
Hydropower uses the potential energy of water and converts it into electricity, either in run-of-river plants or reservoirs. Hydropower is the most mature renewable energy technology and can be explored almost all over world. In the OECD countries the most suitable areas, particularly for large hydro,
Rita da Penha Gonçalves Pereira Machado 16
have been explored by now, but there is still potential for small-scale developments unexploited. Significant potential for hydro generation still exists in Asia, Latin America and Africa.
Some hydro plants can be operated as base load, while others serve as peaking plants, depending on the volume of the reservoirs and the electrical capacity of the dam relative to the total system; hydropower plants can be operated flexibly, particularly where pumped storage is available, and hence are capable to supply sudden fluctuations in power demand (IEA, 2010b).
Biomass
Biomass energy is produced from any organic material, of plant and animal origin, derived from agriculture and forestry production and resulting by-products, and industrial and urban wastes (OECD, 2004). The type of technologies exploiting biomass resources is very varied and the selection of technology depends on both the final use and on the nature of the biomass feedstock (IEA, 2010b). The potential of this resource can be assessed, based on the land availability for dedicated crops and the availability forestry and agricultural residues and waste. The availability of land for crops and water use are major concerns of biomass exploitation (IEA, 2010b).
Geothermal energy
Geothermal energy is the energy available as heat contained in or discharged from the earth‟s crust that can be exploited for power generation or for direct heat within a number of applications such as: space and district heating, water heating, aquaculture and industrial processes. Moderate or high temperatures geothermal resources are suitable for power generation. High-temperature geothermal resources usually exist in areas near plate boundaries or rift zones. If the temperature level is too low for power production, geothermal heat resources can be exploited for direct use in district heating systems and for some industrial and agricultural purposes, where local markets exist. Some of the positive features of this resource include the capability to provide base load power, the compatibility with both centralized and distributed energy generation; sources of low temperature geothermal heat exist in all over the world. The high capital cost, and the fact that exploited geothermal reservoirs require continuous management are some of the barriers for further exploitation of this resource (IEA, 2010b).
Marine power
Marine energy technologies use the kinetic energy of tides, waves and currents of the sea, as well as temperature and salinity gradients, for the power generation. The technologies to exploit this resource are the least developed of the renewable energy technologies. This marine energy resource is, in principle, limitless and can be found in all world regions, but in practice it is only viable at sites close to demand centres and where, simultaneously, damage to local ecosystems can be controlled. Some marine technologies such as those that exploit tides have variable output, but on the other hand they are predictable (IEA, 2010b).
RE share in the TPES
During the last decade, the policy support for RE has increased considerably, mainly due to the necessity to reduce the GHG emission, to diversify the supply mix and to reduce the dependence on imported fossil fuels. Between 2000 and 2008 the total primary renewable energy supply grew from 1319 Mtoe to 1590 Mtoe (IEA, 2010b).
Biomass is currently the most exploited source of RE. In 2008 biomass use amounted to 1225 Mtoe, most of which was exploited in developing countries, in traditional ways by around 2.7 billion people. The use of modern biomass (refers to all biomass with the exception of traditional biomass, which refers to the biomass consumption within the residential sector in developing countries and includes the use of charcoal, agricultural residues and animal dung for cooling and heating) is lesser (amounted to 478 Mtoe in 2008), but is rapidly increasing, mainly for electricity generation and as feedstock for making transport fuels. Hydropower is, currently, the second largest RE source in primary energy demand (accounted for 276 Mtoe in 2008) and the dominant source of renewables-based electricity. Solar, wind, geothermal and marine power have been developing rapidly in recent years, but their total share within primary energy supplies is still modest (IEA, 2010b).