Page | 1 A Work Project, presented as part of the requirements for the Award of a Masters Degree in Management from the Faculdade de Economia da Universidade Nova de
Lisboa.
Impairment of Tangible Fixed Assets in the Portuguese Listed Companies: Disclosures
Joana Cordeniz Martins, n. 349
A Project carried out on the Finance and Accounting area, with the supervision of: Leonor Ferreira
Page | 2
ABSTRACT
The purpose of this project is to understand the practices of companies regarding recognition, measurement and disclosure of impairment of tangible fixed assets. The sample analysed is formed by the non-financial Portuguese listed companies. This research assumes the point of view of financial statements‟ users. It contributes to provide a database of information and an insight of the practices of the Portuguese listed companies about impairment of tangible fixed assets. The findings suggest that these companies do not provide satisfying information about impairments, in the sense that, in many companies, they do not provide information that is understandable and do not meet all the requirements of IAS 36.
Page | 3
1.INTRODUCTION
When the users of the financial statements look for impairment of tangible fixed assets, what do they find? What information is disclosed about it? Is it understandable and accurate? It is essential that the companies meet the legal requirements, so that the users of financial statements can rely on that information. This study analyses the information that the Portuguese listed companies disclose about impairment of tangible fixed assets in their financial statements and what implications it brings to its users.
Tangible fixed assets (TFA) represent a large part of the total assets of a company and the investment made is huge. As their useful lives are bigger than the other types of assets, they affect several balance sheets; they contribute to the profit for more than one accounting period. A change in these assets could lead to some important changes in the financial statements, which makes them an important factor in the decisions of the company and its investors. So, TFA were chosen for the purpose of this research. This study was carried out for several reasons. First of all, there is little research about impairment of tangible fixed assets. The studies that do exist are whether about impairment of other assets, mainly goodwill, or about tangible fixed assets. In this sense, this paper brings a new insight into the study of impairment: the fusion between impairment of assets and tangible fixed assets. Secondly, a lot of the previous research discusses the possible and likely causes of impairment recognition. Yet, this study is focused on the perspective of financial statements‟ users, since it will reveal the information disclosed by the companies in their annual report regarding impairment losses of TFA. Moreover, impairment of assets is a new topic in Portugal, given that before IAS 36 was introduced, impairment was not a subject that was mentioned or practiced; there only were value losses due to “normal” depreciation and extraordinary
Page | 4 depreciation. In this sense, it is important to study this topic in Portugal and in the Portuguese companies, to see how they are dealing with this “new” issue. This research is important for several parties: the market regulators, to see what the companies are complying or not with the regulation and to improve the enforcement mechanisms; and the users of the financial statements and the companies, as well as the auditors, in the way that they can recognize the elements that are more difficult to execute.
This paper is structured as follows. After the Introduction, the paper proceeds with the explanation of impairment of assets, and its characteristics (Section 2); Section 3 describes the legal framework and previous empirical literature. Section 4 introduces the research questions and section 5 describes the methodology and the sample. Finally, Section 6 discusses the results and Section 7 presents the main conclusions of the paper and contributions, as well as its limitations and suggestions for future research.
2.WHAT IS IMPAIRMENT OF ASSET?
The Free Dictionary1 defines impairment as “the occurrence of a change for the worse”, as well as “a symptom of reduced quality or strength”. In accounting terms, we can declare that impairment occurs when there is a loss or decrease of a portion of the utility of an asset, which might me caused by casualty, obsolescence or lack of demand for the asset‟s service, and not due to the normal (day-to-day) use of the asset. Impairment of assets arises when the assets stop producing future economic benefits, totally or partially (TOC - Revista da Câmara dos Técniocs Oficiais de Contas, March 2007). According to the International Accounting Standard 36 – Impairment of Assets, “an impairment loss is the amount by which the carrying amount of an asset or a cash-generating unit exceeds its recoverable amount”, i.e. when the amount that the asset is
Page | 5 carried is higher than the amount that the company can recover from the sale of that asset or from its use. The recoverable amount (RA) is “the higher of its fair value less costs to sell and its value in use” (IAS 36 paragraph 6). We can represent impairment loss as follows:
To this extent, we can describe impairment loss of an asset in the following formula:
Where IL is the Impairment Loss, CA is the Carrying Amount, FV the Fair Value, CS the Costs to Sell and VU the Value in Use of the asset.
From this formula, the variables that can influence an impairment loss can be identified: a) Carrying Amount; b) Fair Value and the Costs to Sell; c) Value in Use.
Regarding the carrying amount, it is the value of recognition of assets, in particular of the TFA, which are the subject of study in this paper. According to IAS 16 - Property, Plant and Equipment, tangible fixed assets are “items that are held for use in the production or supply of goods or services, for rental to others, or for administrative purposes” and “are expected to be used during more than one period”. However, the
VU ; CS FV max CA ; 0 IL [1]
Page | 6 analysis of the carrying amount is excluded2 from this work project, since it is not the core focus of this research and it is a vast subject to study. Moreover, others have already studied it, namely Joana Gonzalez (2008) in her Master Thesis for a similar sample3. Yet, it is important to mention the main legal issues regarding TFA. The main issue related to TFA is the method of measurement. IAS 16 states that a company should initially recognize a tangible fixed asset at its cost. But after recognizing an asset, the entity should choose to use between two accounting policies to an entire class of assets, as a subsequent measurement of the initial recognition: the cost model or the revaluation model. Another important issue is the depreciation, which contrasts with impairment loss in the sense that the later is an extraordinary loss of value. IAS 16 states that “the depreciation method used shall reflect the pattern in which the asset‟s future economic benefits are expected to be consumed by the entity” (IAS 16, paragraph 50)4. As to the fair value less costs to sell, it is “the obtainable from the sale of an asset or cash-generating unit in an arm‟s length transaction between knowledgeable, willing parties, less the costs of disposal5” (IAS 36, paragraph 6). If there is no binding sale agreement, there are other ways the asset‟s fair value can be determined and so, we have to analyse what are the conditions and situations that lead each company to determine the FV. Concerning the value in use, the third variable, it is defined as “the present
2 The carrying amount is not totally excluded from this paper; it is in the way that it was not a subject
analysed in the sample in order to get some conclusions about its practices in the Portuguese companies.
3
Euronext Lisbon‟s companies for the year 2007
4 For tax purposes in Portugal, “The calculation of the depreciation of the period will be done, as a rule,
by the strait-line method. It can, however, opt, for the calculation of the depreciation of the period, for the declining-balance method regarding the elements of the new tangible fixed assets, acquired to third parties or produced or constructed by the company that are not: a) buildings; b) passenger cars or mixed, except when affected companies exploring public transportation service or destined to renting in the period of the normal activity of the company; c) furniture and social equipment” (translation from the 4th article of the Decreto Regulamentar Nº 2/90 – Regime de Reintegrações e Amortizações, from Diário da
República).
5 IAS 36 provides the definition of costs of disposal as the costs “other than those that have been
recognised as liabilities” except for those associated with IAS 19 and “with reducing or reorganizing a business following a disposal of an asset” (IAS 36, paragraph 28).
Page | 7 value of the future cash flows expected to be derived from an asset or cash-generating unit” (IAS 36, paragraph 6).
A legal framework and previous literature will be presented next, in order to understand the “background” of an impairment loss. Furthermore, a comparative analysis between the international regulation (IFRS) and the American regulation (FAS) regarding the impairment losses of TFA is presented, to give an insight about the “American way”.
3.LEGAL FRAMEWORK AND PREVIOUS LITERATURE
Since 2005, all companies listed on European stock exchanges6 have been obliged to prepare their consolidated accounts according to the International Financial Reporting Standards (IFRS), issued by the International Accounting Standards Board (IASB). As so, the Portuguese listed companies are also required to compel with these Standards. “European laws based on the EU Fourth Directive try to cope with this [impairment of assets] by requiring companies to take account of any „permanent diminution in value‟ of a fixed asset” (Alexander and Nobes, 2007). But, the procedures and rules were not clear, which created many differences across companies and countries. So, IAS 36 was introduced to provide guidance in the measurement of impairments and also to produce information that is relevant, reliable, understandable and comparable.
3.1. THE IAS36
In an overall view, IAS 36 presents the definition of Impairment Loss, states how to identify an asset that might be impaired and describes how companies should recognize, measure and present an impairment loss and what information should be disclosed. Nevertheless, the presentation is not studied in this paper, which will be a topic for future research in this area. Regarding the recognition of an impairment loss, if the
Page | 8 recoverable amount of an asset is below its carrying amount, “an impairment loss shall be recognized immediately in profit or loss, unless the asset is carried at revalued amount in accordance with another Standard”. In this case, it “shall be treated as a revaluation decrease in accordance with that other Standard” (paragraph 60) and so, recognized directly in Equity. When an IL is recognized, “the carrying amount of the asset shall be reduced to its recoverable amount” (paragraph 59). In what concerns the measurement of an IL at the end of each accounting period, companies have to observe if there are any indications of an impairment loss and, if so, calculate the asset‟s recoverable amount. Companies estimate the RA for each individual asset, but in case that that is not possible, it can assess the amount to the cash-generating unit7 to which the asset belongs.” When there is an impairment reversal, i.e. when the impairment loss recognised in prior periods may no longer exist or may have decreased, the company also has to calculate the RA of an asset or generating unit. An asset or cash-generating unit should be reversed whenever “there has been a change in the estimates used to determine the asset‟s recoverable amount since the last impairment loss was recognised” (paragraph 114). If a reversal of an impairment loss is recognised, “the carrying amount of the asset shall be increased to its recoverable amount” (IAS 36, paragraph 114). Nevertheless, this increase of the CA shall not surpass the CA that would have been determined if the impairment loss had not been recognised. If it does exceed, it is treated as a revaluation of the asset according to the Standard applicable to the asset (paragraphs 117 and 118). The reversal of an impairment loss should also be recognised in profit or loss, except for revalued assets, in analogy to the case of the IL. As to the information disclosure required by IAS 36, we can divide it into four main
7
A cash-generating unit is “the smallest identifiable group of assets that generates cash inflows that are largely independent of the cash inflows from other assets or group of assets (IAS 36, paragraph 6).
Page | 9 „bundles‟ of information: (1) classes of assets (paragraph 126); (2) reportable segments (paragraph 129); (3) individual material impairment (paragraph 130); (4) aggregate material impairment (paragraph 131). Table 1.1 summarizes this information. These disclosures are a minimum to which the companies have to comply with, but they can disclose additional information.
We can wonder if the requirements of this Standard are globally accepted or if there are disagreements with other standards issued by other entities. Hence, it is presented a comparative analysis with FAS 144 – Accounting for the Impairment or Disposal of Long-Lived Assets8, which is the American standard (US GAAP) issued by the Financial Accounting Standards Board9. Although FAS 144 does not apply to intangible assets, we are analysing IAS 36 only to what it is applicable to TFA, and so this has no relevance. There are six main differences between both standards. First, in IAS 36, the level at which impairment is analysed is at the CGU, while in FAS 144 is the asset group. Second, in the first standard, the RA is the higher value between the net fair value and the value in use and in the American standard it is the sum of the expected future cash flows of the asset. This means that FASB gives fewer options to the management to manipulate the results in their favour. Regarding the adjustments in the financial statements when an IL is recognized, whereas in the international standard IL are charged in a contra-account to the asset, in the American standard the impairment losses are directly charged against the asset. Moreover, while in the first the carrying CA is reduced to the RA, in the second the CA is reduced to its FV. The fair value
8 FAS 144 supersedes FAS 121.
9 The American standards are used in this analysis, because they are an influence in accounting standards
worldwide and a great part of the studies about impairment losses uses American companies and, therefore, the American standards. Moreover, in October 2002, both IASB and FASB issued a memorandum of understanding, in an effort to commitment of the convergence of both accounting standards.
Page | 10 becomes the new cost basis instead of the expected future cash flows, which is the RA of the asset. Another key issue are the reversals of impairment losses, in which FAS 144 prohibits reversals and IAS 36 permits. If the conditions that led to the recognition of the IL change or inverse, the US companies cannot reverse the impairment, leaving the asset carried at a lower value than it truly is. However, the prohibition of reversals by FASB is due to the fact that “an impairment loss should result in a new cost basis for the impaired asset. That new cost basis puts the asset on an equal basis with other assets that are not impaired”, so “the new cost basis should not be adjusted subsequently” (US SFAS 121, Appendix A paragraph 105). Finally, IAS 36 requires the companies to disclose more information than FAS 144. To know the comparison of these standards in more detail consult Table 2.1.
3.2. LITERATURE REVIEW
As previously mentioned, the studies10 carried out about impairment losses are two-fold: one part concerns the impairment of assets, mainly goodwill, and the other part is about tangible fixed assets. As so, this subsection is divided as such.
Regarding the impairment losses, there is a main focus in the researches, which is what caused the impairment losses. Before there existed standards regulating the impairment of assets, companies had started recording extraordinary losses related to the loss of value of its assets. There were several European jurisdictions that had “statutory obligations to compare the carrying value of assets with their market value”, but they were not thoroughly followed (Epstein and Jermakowicz, 2008). “The increasing number of asset write-downs and write-offs during the last decade has captured the attention of both the financial press and the standard setting community” (Zucca and
Page | 11 Campbell, 1992). Several articles point earnings management11 as a cause for the impairments. “While the problem of earnings management is not new, it has swelled in a market that is unforgiving of companies that miss their estimates” (Levitt, 1998). Zucca and Campbell (1992) examine earnings management as “a possible explanation for the timing and motivation for discretionary write downs12”. Income smoothing and “big baths” were identified as two possible earnings management patterns13
. According to this research, close to 28% of the firms14 recorded the write-downs in periods of below average earnings, i.e. “big baths”, while 25% recorded the impairment due to the income smoothing15. Kvaal (2005) refers to Riedl (2004) when stating that the “‟big bath‟ is proxied by an exceptionally abrupt fall in pre-write-off earnings, and smoothing is proxied by an exceptionally abrupt rise”. Garrod et al (2007) concluded that earnings management are used to reduce positive pre and post-tax earnings to just a little higher than zero, in order to prevent paying a lot of taxes but also to keep under the radar of the tax authorities16. Moreover, Riedl (2004) found out that before the issuance of SFAS 121, companies‟ write-downs were more correlated with economic factors than with “big baths” related to impairment accounting. In the study of R. R. Duh et al (2009) he adds that FASB prohibits the reversal of impairment losses previously recognized
11
“Strategy used by the management of a company to deliberately manipulate the company's earnings so that the figures match a pre-determined target” (Collected from Investopedia, at http://www.investopedia.com/ask/answers/191.asp - 6th October 2009).
12 Discretionary write-downs are “the write-downs which the FASB would specifically target with their
potential regulation”, which are the ones that do not fit in these three categories: “certain current assets”, “long term equity investments” and “any long term assets, for which disposal is contemplated”.
13 “Income smoothing is characterized by periods in which pre-write-down earnings were higher than
expected. By recording the write-down, reported earnings were closer to (but not less than) the level expected. A "big bath" is characterized by periods in which pre-write-down earnings were already below expected earnings”.
14 The companies included in the sample belong to the NAARS database for the period of 1981 to 1983.
The sample is composed of 77 write-downs by 67 companies. To know the inclusion criteria of the firms in the sample consult the paper.
15 The remaining firms‟ impairments were inconclusive regarding its cause.
16 It is assumed that the tax authorities will audit with more probability the companies that do not have
Page | 12 because a reversal leaves room for earnings management behaviour. What is more, the Securities Exchange Commission (SEC) issued in 2000 the Staff Accounting Bulletin 100 – Restructuring and Impairment Charges, in which it shows the organization‟s apprehension regarding the use of restructurings, purchase accounting, and impairment write-offs to manage earnings in public companies. This shows the overall concern that earnings management is being practiced by companies through impairment recognition or reversal. Of course, not every accounting decision is based on earnings management, but the implications of accounting choices to achieve a certain goal are consistent with the concept of earnings management (Prakash, 2007). Rees et al (1996) noticed that write-downs are normally recorded in periods of low earnings, but he did not find evidence that support the earnings management theory. Another cause pointed out is the recession periods. Prakash (2007) states that “sales declines in recessions have an incremental effect on asset write-downs of procyclical firms and financially constrained firms – firms that are sensitive to business cycles.” What is more, Elliott and Shaw (1988) noticed that the write-down companies are larger and more leveraged. This suggests that impairment might be recognized in a “phase” and not intentionally as implied before. Others pronounce that management changes are the motivation for companies to record impairment losses. In a study by Strong and Meyer (1987) it is concluded that the most important factor in recognizing impairments is “a change in the senior management”, especially if the new senior comes from outside the company. Having all these opinions in mind, it is also vital to incorporate the larger context of the write-downs, to see what the circumstances that led the management to choose certain accounting practices were. In addition, most of these studies were performed when there
Page | 13 were no standards about impairment or almost inexistent. So, we have to consider whether these terms wholly apply nowadays.
There are two main subjects of discussion concerning TFA: the valuation of these assets, whether the best measurement is the fair value or the historical cost, and the depreciation, whether companies should apply the economic or the fiscal criteria. These issues are thoroughly analysed in the Master thesis of Joana Gonzalez. She concluded that there are diverse and opposing opinions regarding these subjects. What concerns the Portuguese listed companies, she found out that 83% of the companies used the cost model to measure TFA and that these companies disclosed more information than the ones using the revaluation model. Regarding the depreciation method, all the companies used the strait-line method due to its greater simplicity and it is the one fiscally accepted and all, except one, disclosed all the required disclosures.
To the best of our knowledge, there are no researches done about disclosures of impairment losses, particularly of Portuguese companies. Before 2005, empirical researches were not possible, because in Portugal only after this date listed companies should apply IAS/IFRS. Thus, we can only find comments on this subject. And so, this paper provides insight into the report of impairment losses by Portuguese listed companies in the financial reports.
In the next section, eight research questions are developed, that focus on the most important issues about impairment of tangible fixed assets, specifically on the recoverable amount and the information that companies have to disclose.
4.RESEARCH QUESTIONS
This research analyses if the information that companies disclose about impairment losses meets the requirements of IAS 36, that is compliance with the regulation, and
Page | 14 also if companies are voluntarily reporting information of impairment of TFA. Some questions are raised with the aim of guiding us to the key issue:
“What do Portuguese listed companies disclose about Impairment of tangible fixed assets?”
It is necessary to know where to find this information in the annual reports of the companies, in order to understand the companies‟ impairments.
RESEARCH QUESTION 1: “Where, in the financial statements, do we find information
about the impairment of assets?”
4.1.RECOGNITION
Looking at the financial statements of each company, we have to consider if there are any impairment losses recognized in the period, because if there are not, the study can be limited.
RESEARCH QUESTION 2A:“Do companies recognize impaired tangible fixed assets?
RESEARCH QUESTION 2B: “If yes, how do they recognize it?” 4.2.MEASUREMENT
The recoverable amount and how to measure it is the most critical issue in what concerns impairment of assets.
RESEARCH QUESTION 3: “How do companies measure the recoverable amount when
assessing an impairment loss: either fair value or value in use?”
At this point we also have to ask two questions that come from this one.
RESEARCH QUESTION 3A: “If they use the fair value less cots to sell, what is the basis of
calculation?”
RESEARCH QUESTION 3B: “If they use the value in use, what is the discount rate, the
useful lives and the cash flows applied in the estimates?”
4.3.DISCLOSURES
It is required by IAS 36 that the companies disclose some information about impairment losses (described in section 3.1).
Page | 15
RESEARCH QUESTION 4: “What information do companies disclose about impairment
losses?”
RESEARCH QUESTION 4A: “Does the information disclosed comply with the mandatory
regulation?
RESEARCH QUESTION 4B: “Are companies disclosing voluntarily information besides the minimum required by the standard? What is disclosed?”
There are no prior studies supporting these questions, but we can presume that companies do not disclose all the information required by the standard, because it is time consuming and one way to manipulate results. To be sure, we should inquiry the accountants of the companies for the reasons of the disclosures (future research). It is even less probable that they disclose additional information. However, we could also expect companies to disclose this information (required) in order to avoid penalties and short of image.
5.METHODOLOGY AND SAMPLE
This section presentsthe methodology applied in this study, namely where the data was collected, the period of analysis, the composition of the sample and how it was examined.
5.1.METHODOLOGY
In order to do this research, data was collected from the annual consolidated financial reports17 of non financial Portuguese listed companies. The period analysed was the year 2008, since it is the most recent period with available data from all the companies18. The reports were collected both from the CMVM (Comissão do Mercado
17 Emphasis was given to the Notes to the financial statements, especially the accounting policies of the
tangible fixed assets, the TFA, as well as the impairment of TFA.
18 However, data was also collected for the year 2007 (in the annual reports of 2008), to be able to make a
comparison between these years and to see the evolution of the disclosures of the companies. Also, the annual reports of 2009 were consulted to crosscheck the information regarding 2008.
Page | 16 de Valores Mobiliários) website and the companies‟ website, with the purpose of validating the data collected. Consolidated reports were selected and not individual reports, because the former guarantees the accordance with IFRS by these companies, as mentioned earlier. Data was collected from the following financial statements: Balance Sheet, Income Statement and the Notes. The Notes were the Statement that provided more information about impairments, namely the accounting policies of TFA and impairments, the movements in the TFA and the impairment accounts and the remaining disclosures. The Income statement was consulted to see if they had impairments/reversals and to crosscheck with the amount disclosed in the Notes. The Balance Sheet only provided the information about the total assets and TFA, for comparison reasons19. Moreover, the Management report was also read, in order to know if there was anything mentioned about impairments. In addition, the Audit Reports (2008) and the CMVM Reports (2007 and 2008) were also read with the purpose of looking for any relevant facts about impairments, but no significant data was found. All the data were put into an Excel file and a database20 was built with numerical and qualitative data, consisting of information of each company regarding the amounts of annual and accumulated impairments losses and of reversals and required disclosures about impairment of TFA.
5.2.SAMPLE AND DATA
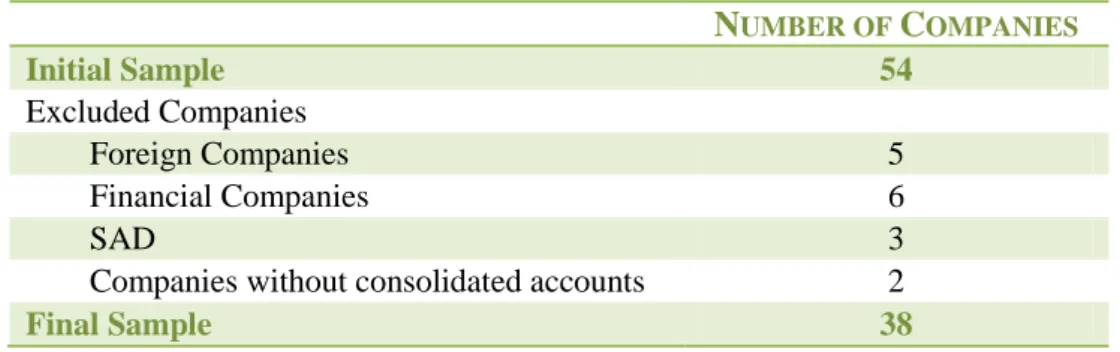
The initial sample consists of all the companies listed in the Euronext Lisbon, which were 54 in 2008. Afterwards, several exclusion criteria were employed in order to obtain a more accurate sample for the purpose of this paper.
19
For example, the percentage of TFA in the Total Assets.
20 This database is composed of two tables: the first has seven columns and 38 lines, with financial
information of each company (annual and accumulated impairment losses and reversals), and the second contains nine columns and 38 lines, with the disclosures of each company on IAS 36.
Page | 17 NUMBER OF COMPANIES Initial Sample 54 Excluded Companies Foreign Companies 5 Financial Companies 6 SAD 3
Companies without consolidated accounts 2
Final Sample 38
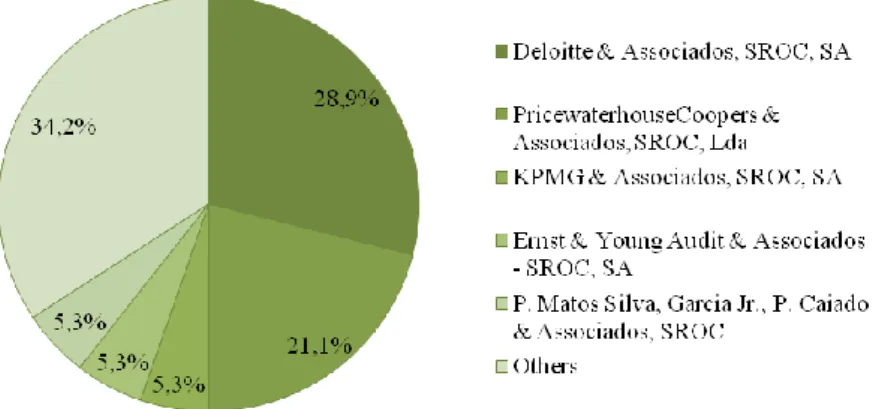
In this sense, the foreign companies were excluded, so as to remain only the Portuguese companies. Then, all the companies in the financial industry were ruled out, because they have a specific way to report its financial statements and also their impairment is expected mainly in investments and clients debts. After that, SAD (Sociedade Anónima Desportiva) were eliminated from the sample in analysis, due to the fact that the reporting period of this type of companies is different from the others21, which may “harm the sample”. Finally, two companies had not reported the consolidated accounts and so they were removed from the sample, for the reason mention earlier. As a result, the final sample (check with Table 1.2) is composed of 38 Portuguese companies listed in the Euronext Lisbon. The distribution of the companies by industry and Audit Company are as follows, respectively:
Graphic 1.1 – Percentage of companies by industry.
Page | 18 Graphic 1.2 – Percentage of companies by Audit Company.
Furthermore, the business volumes are comprised between €13,000 (Papelaria Fernandes) and €6,624,183,478 (PT) and the average number of employees22 is 7 613.
Table 1.3 – Number of companies with the percentage of tangible fixed assets regarding total assets.
As it is shown in Table 1.3, in 23 companies (60.5%), the TFA represent over 30% of the total assets of the company. This is why these assets were chosen in this research.
In the next section, the data will be analysed in detail, in order to discuss and answer the research questions.
6.RESULTS23 6.1.INFORMATION
Regarding RESEARCH QUESTION 1, information about impairment of TFA24 was found in the Balance Sheet, the Income Statement, the Notes to the consolidated accounts and
22 Data regarding the number of employees was collected from the companies‟ websites and the
Management reports.
23 Table 1.4 has information about the results mentioned in the various subsections of this section.
PERCENTAGE OF TFA NUMBER OF COMPANIES
0% - 10% 8 10% - 20% 5 20% - 30% 2 30% - 40% 6 40% - 50% 9 50% - 60% 3 60% - 70% 2 > 70% 3 Total 38
Page | 19 in the Management Report. Companies present and disclose quantitative, which is found in the Income Statement and the Notes, and qualitative information, which is disclosed in the Notes and the Management Report. Most of the times, the companies in the sample just copy the standards into the reports, especially in the accounting policies. But, they also have specific information about the company.
6.2.RECOGNITION
After scrutinizing the databases, there were 14 and 11 companies, in 2008 and 2007 respectively, that did not recognize any impairment of TFA in the period (RESEARCH QUESTION 2A), which left us with 24 and 27 companies, correspondingly, to analyse. The companies that did recognize the impairments (RESEARCH QUESTION 2B), did it in the Income Statement, but under different captions. Only 8 companies (21.1%) disclosed the amount of the impairment losses for 2008. The percentage of these impairments regarding the total TFA ranges from less than 1% to 32%. As to the accumulated impairments, only 11 companies (29%) disclosed the amount. We can see that there is a great difference in the amounts of impairments and these companies are diverse in terms of size, industry and Audit Company.
6.3.MEASUREMENT
Only three companies25 disclosed the method used to calculate the assets‟ recoverable amount (RESEARCH QUESTION 3) and all three of them, applied the Value in Use, and not net Fair Value. Consequently, Research Question 3A cannot be answered with this sample in this period. Martifer only disclosed the discount rates, while the other two also disclosed the cash flows and the useful lives used in the calculations (RESEARCH QUESTION 3B). However, the standard only requires the disclosure of the discount rate.
24 All the impairment losses mentioned in this section refer to the impairment of the tangible fixed assets,
except when is said the contrary.
Page | 20 6.4.DISCLOSURES
The companies mainly divulge (RESEARCH QUESTION 4) when and where they disclose the impairments and reversals and the captions where they are recognized, when they make the tests for impairment and what the recoverable amount is. Moreover, they disclose the amounts of the impairments and reversals recognized in the period, as well as the accumulated IL. All this information is disclosed in the accounting policies of the company, which is where the “theoretical practices”26
of the company are presented, and in the note to the consolidated accounts destined to impairment of assets. As to the compliance of the disclosures (RESEARCH QUESTION 4A), not one single company disclosed all the mandatory information27; they disclose some of the information, but not all of it and each company disclosed different information from the others. Thus, they are not conforming to the standard (consult table 1.3 with the number of companies that accomplished the disclosures). In 2007, out of the 38 companies in the sample, only 17 companies (44.7%) properly divulged the amount of impairments recognized, 15 did it together with depreciation or provisions28 and six did not disclose any information. As to 2008, the number of companies that properly disclosed this information increased to 22 and the ones that did not disclose any information decreased to two. Regarding the reversals, in both years, only 19 companies reported appropriately the amount of the reversals. One important thing to mention is that, nine companies of the sample have the impairments together with the depreciation and, at the same time, do not disclose the
26
It is rather what they say they do then what they actually do.
27 Some of this information concerns material impairment losses. To this extent, the Audit Report of the
companies was consulted and it was assumed that if the auditor did not mention anything regarding impairment of TFA it was because it was not material. In this sense, we may be saying that a company did not meet the requirements, but it can be the case that it was not material and so the company did not have to disclose it. So, the results may not be entirely true in what concerns the disclosures.
28 Some companies disclosed the impairment information in the same “note” of depreciations or
Page | 21 accumulated impairment losses, only for other types of impairment29. Does this mean that they did not recognize impairments or they simply did not disclose it? The lack of relevance and materiality of these disclosures could be the cause, but we cannot know for sure. As regards to the mandatory qualitative disclosures, only three companies (7.9%) disclosed the causes of the impairments30. There was no evidence enough to justify these disclosures: one company (Portucel) is very big and another (Corticeira Amorim) is small; their auditors are all different, although two of them have the same Audit Company; and each one belongs to a different industry. Moreover, 44.7% of the companies did not mention the line items in which the impairments were included31 and 39.5% did not mention the line items where the reversals were integrated32. Only six companies (15%) disclosed information about the cash-generating units, although it is very incomplete comparing to the mandatory information disclosures. They only provided the description of the CGU and left out information about the amount of impairments recognized or reversed by class of assets and the amount of impairments by reporting segment for each CGU, which is mandatory. No apparent reason that leads these companies to disclose or not to disclose some information was found, like the type of industry or the size of the company; they are all diverse in these aspects. Finally, all the companies reported in segments. However, only one company (Sumol+Compal) adopted the IFRS 8 in 200833, but did not meet the disclosure requirements regarding
29 For example, they have accumulated impairments of customers, inventory, goodwill or investments. 30 The causes were: deterioration of economic situation (Corticeira Amorim), estimate of a potential loss
in the sale of some assets (Martifer) and the substitution of recovery boilers in some industrial complexes (Portucel). See Table 10 to read the possible causes of impairment provided by IAS 36.
31 The remaining is divided in “Provisions and Impairment Losses”, “Other Operating Expenses”,
“Depreciation and Amortization” and “Impairment Losses”, by order of decreasing frequency.
32 The residual companies are split in “Other Operating Income”, “Provisions and Impairment Losses”,
“Depreciations and Amortizations” and “Impairment Losses”, by the same order.
33 IFRS 8 Operating Segments replaced IAS 14 Segment Reporting and is applicable to companies “whose
debt or equity instruments are traded in a public market” or “that files, or is in the process of filing, its (consolidated) financial statements with a securities commission or other regulatory organisation for the
Page | 22 segment reporting. Still, 30% of the sample reported the impairment losses by segments (voluntary disclosure - RESEARCH QUESTION 4B), of which 20% did not separate the impairments of each class of assets. Once again, the situation is the same as before, there is no evidence supporting the connection between these disclosures and the size, industry or auditor of the companies. Regarding the voluntary disclosure, 30% of the companies disclosed the IL by reportable segment and two companies reported the cash flows and useful lives used in the calculation of the Value in Use.
These findings prove that the Portuguese listed companies do not disclose all the information necessary and so the understanding of the impairment losses of TFAs can be compromised. The disclosure of this information is poor and, in some cases, useless for the readers of the financial statements. As Ferreira et al (2001) concluded, “the Portuguese companies reveal even less than the required data and the information reported in the financial statements lacks quality.” The fact that the companies do not disclose some information or that it is poor, may be due to the lack of relevance and materiality of the impairments or it could be the fact that the enforcement mechanisms are not severe enough or even not applied.
7.CONCLUSIONS
We can conclude from this research that the Portuguese listed companies lack communication skills, in the sense that they do not transmit properly the information to the users of the financial statements. Moreover, they do not comply with all the requirements of IAS 36, which can damage the perception of the users.
purpose of issuing any class of instruments in a public market”, which the case of this sample. However, it is only effective starting January 2009 and so they did not have to disclose the impairments by reporting segments in 2008.
Page | 23 Given all that was stated before, it is suggested that companies should pay more attention when disclosing information in the annual reports, not only about impairments but also everything else. They should comply with all the requirements of the standards and provide the information in an understandable manner, in order to the users fully comprehend the information provided. To accomplish this, companies could use a more “universal” language in their reports34
. They could also try to avoid copying the standards to the reports, because, in this way, the information is almost worthless for the users; it does not give additional guidance in what respects the activities and practices of the companies.
This paper contributed to provide a database of information about impairment losses of tangible fixed assets and its disclosures, so that other researchers can use it and add to it. Furthermore, this study presented a new perspective about impairment of assets, the perspective of users of the financial statements. What is more, it contributed to the understanding of the Portuguese practices regarding this subject and, as a consequence, a way to improve the enforcement mechanisms in Portugal. Ferreira et al (2001) recommended that “... the security market authority must improve the enforcement mechanisms and the quality of accounting standards and also encourage voluntary reporting”.
Most of the information of impairment losses of TFA here mentioned that were not disclosed by the companies, were, however, disclosed for Goodwill impairments, which was one of the limitations of this study. Another limitation was the fact that the information gathered may not be true, real and impartial, and so this work could have been more reliable if that happened.
Page | 24 One suggestion for future research is to make this study about other assets, namely goodwill impairment, since there is more information on this subject. Future researchers could also introduce the presentation of impairments, in addition to recognition, measurement and disclosures; and also replicate the study for intangible assets or for other periods or even with other sample. As this study is about “what and how” the companies disclose information about impairment losses and if they comply with the regulation, future research could focus on the “why” of these disclosures, by enquiring the accountants of each company. It could be also interesting to develop the subject of enforcement mechanisms, to see if the companies are not complying due to the lack of pressure and effectiveness of these mechanisms.
REFERENCES
Allexander, David and Christopher Nobes. 2007. “Tangible and Intangible Fixed Assets.” In
Financial Accounting an international introduction. 164-194 Prentice Hall.
Dias, Joana, M. G. 2008. “What Do Portuguese Listed Companies Disclose About Tangible Fixed Assets? The Auditor‟s Potential Errors Perspective.” Master Thesis. Universidade Nova de Lisboa.
Duh, Rong-Ruye, Wen-Chih Lee and Ching-Chieh Lin. 2009. “Reversing an impairment loss and earnings management: The role of corporate governance.” The International Journal
of Accounting, Vol. 44, 113-137.
Elliott, John A. and Wayne H. Shaw. 1986. “Write-offs as Accounting Procedures to Manage Perceptions.” Journal of Accounting Research, Vol. 26 (Supplement).
Epstein, Barry J. and Eva K. Jermakovicz. 2008. “Property, Plant and Equipment.” In
Interpretation and Application of the International Financial Reporting Standards,
246-291. New Jersey: John Wiley & Sons, Inc.
Ferreira, Leonor, Helena Isidro and Paulo Alves. 2001. “The Role of Research and Development (R&D) Capitalisation; the Case of Portuguese Listed Companies” Management, broj. 23-24, Godina November 2001 45-53.
Garrod, Neil, Pirkovic S. Ratej and Aljosa Valentincic. 2007. “Political Cost (Dis)Incentives for Earnings Management in Private Firms.” Working Paper Series.
Kvaal, Erlend. 2005. “Topics in Accounting for Impairment of Fixed Assets.” PhD diss. BI Norwegian School of Management.
Levitt, Arthur. 1998. “The Numbers Game”. Speech at New York University, September 28. Prakash, Rachna. 2007. “Macroeconomic Factors and Financial Statements: Asset Writedowns
Page | 25 Rees, Lynn, Susan Gill and Richard Gore. 1996. “An Investigation of Asset Write-downs and
Concurrent Abnormal Accruals.” Journal of Accounting Research, Vol. 34.
Riedl. Edward J. 2004. “An Examination of Long-lived Assets Impairmets.” The Accounting
Review, Vol. 79, No 3.
Staff Accounting Bulletin: No. 100 – Restructuring and Impairment Charges, Title 17 of the Code of Federal Regulations (CFR) Part 211 (Amend), November 1999, U.S. Securities and Exchange Commission.
Strong, John S. and John R. Meyer. 1987. “Asset Writedowns: Managerial Incentives and Security returns.” Journal of Finance, Vol. XLII, No 3.
TOC A Revista da Câmara dos Técnicos Oficiais de Contas. 2007. “Imparidade dos Activos Tangíveis e Intangíveis,” March, 60-62.
Zucca, Linda J. and David R. Campbell. 1992. “A Closer Look at Discretionary Writedowns of Impaired Assets.” Accounting Horizons, Vol. 6, No 3.
OTHER SOURCES
International Accounting Standards Committee Foundation (IASC), International Accounting Standard 36 – Impairment of Assets, International Accounting Standards Board (IASB), London, United Kingdom.
International Accounting Standards Committee Foundation (IASC), International Accounting Standard 16 – Property, Plant and Equipment, International Accounting Standards Board (IASB), London, United Kingdom.
Financial Accounting Foundation (FAF), Financial Accounting Standard 144 - Accounting for the Impairment or Disposal of Long-Lived Assets, Financial Accounting Standards Board (FASB), Norwalk, Connecticut, U.S.A.
Financial Accounting Foundation (FAF), Financial Accounting Standard 121 - Accounting for the Impairment of Long-Lived Assets and for Long-Lived Assets to Be Disposed Of, Financial Accounting Standards Board (FASB), Norwalk, Connecticut, U.S.A.
Regulation (EC) No 1606/2002 of the European Parliament and of the Council on the application of International Accounting Standards, 19th July, Official Journal of the European Communities.
Regulatory-Decree No. 2/90, 12th January and amendments – Regime de Integrações e Amortizações, Diário da República.
www.iasb.org (International Accounting Standards Board) - Accessed between August and December 2009.
www.fasb.org (Financial Accounting Standards Board) - Accessed between August and December 2009.
www.iasplus.com issued by Deloitte - Accessed between August and December 2009.
www.ssrn.com (Social Science Research Network) - Accessed between August and December 2009.
www.jstor.org – Accessed between August and December 2009. www.euronext.com - Accessed between August and December 2009.
www.cmvm.pt (Comissão do Mercado de Valores Mobiliários) - Accessed between August and December 2009.
Page | 26
1. Exhibits
Page | 27 Table 1.1 – Disclosures required by IAS 36.
1) Classes of assets
a) The amount of impairment losses and reversals; b) The line items they are included;
c) The amount of impairment losses and reversals on revalued assets;
2) Reportable Segments
Impairment losses and reversals for each reportable segment, if companies report according to IFRS 8;
3) Individual material impairments a) Causes;
b) Amount;
c) Nature of the asset; d) Reportable segment;
e) Description of the CGU; Amount of impairments by class of assets and
reportable segment for each CGU; If it changes, the description of the previous CGU and reasons for the change;
f) Method of calculus of the recoverable amount, basis of calculus of fair value less costs to sell and discount rate for value in use;
4) Aggregate material impairments a) Main classes of assets; b) Causes;
Page | 28
Table 1.2 – Companies in the final sample.
COMPANIES INDUSTRY BY EURONEXT AUDIT COMPANY WEBSITE
Altri, SGPS, SA Industrials Deloitte www.altri.pt
Brisa - Auto Estradas de Portugal, SA Industrials Deloitte www.brisa.pt Cimpor - Cimentos de Portugal, SGPS, SA Industrials Deloitte www.cimpor.pt
Cofina - SGPS, SA Consumer Services Deloitte www.cofina.pt
Corticeira Amorim - SGPS, SA Consumer Goods PWC www.amorim.pt
EDP - Energias de Portugal, SA Utilities KPMG www.edp.pt
EDP Renováveis, SA Utilities KPMG www.edprenovaveis.com
Estoril Sol, SGPS, S.A. Consumer Services Other www.estoril-solsgps.pt F. Ramada - Investimentos, SGPS, SA Basic Materials Deloitte www.ramada.pt Fisipe - Fibras Sintéticas de Portugal, SA Basic Materials Deloitte www.fisipe.pt
Galp Energia, SGPS, SA Oil & Gas P. Matos Silva & Associados www.galpenergia.com Glintt - Global Intelligent Technologies, SGPS, SA (ex Pararede) Technology Other www.pararede.com
Grupo Media Capital, SGPS, SA Consumer Services Deloitte www.mediacapital.pt Grupo Soares da Costa, SGPS, S.A. Industrials Other www.soaresdacosta.pt
Ibersol - SGPS, SA Consumer Services PWC www.ibersol.pt
Imobiliária Construtora Grão Pará, SA Industrials Other www.graopara.pt
Impresa - SGPS, SA Consumer Services Other www.impresa.pt
Inapa - Investimentos, Participações e Gestão, SA Basic Materials PWC www.inapa.pt Jerónimo Martins - SGPS, SA Consumer Services PWC www.jeronimomartins.pt Lisgráfica - Impressão e Artes Gráficas, SA Industrials Deloitte www.lisgrafica.com
Martifer - SGPS, SA Industrials Other www.martifer.pt
Mota-Engil, SGPS, S.A. Industrials Other www.mota-engil.pt
Novabase, SGPS, SA Technology PWC www.novabase.pt
Papelaria Fernandes - Indústria e Comércio, SA Basic Materials Other www.papelariafernandes.pt Portucel - Empresa Produtora de Pasta e Papel, SA Basic Materials PWC www.portucelsoporcel.com
Portugal Telecom, SGPS, S.A. Telecommunications P. Matos Silva & Associados www.telecom.pt
Reditus - SGPS, SA Technology Other www.reditus.pt
REN - Redes Energéticas Nacionais, SGPS, SA Utilities Other www.ren.pt SAG Gest - Soluções Automóvel Globais, SGPS, SA Consumer Services Ernst & Young www.sag.pt Semapa - Sociedade Investimento e Gestão, SGPS, SA Industrials PWC www.semapa.pt
Sociedade Comercial Orey Antunes, SA Industrials Ernst & Young www.orey.com
Sonae - SGPS, SA Consumer Services Deloitte www.sonae.pt
Sonae Indústria, SGPS, SA Industrials PWC www.sonaeindustria.com
Sonaecom - SGPS, SA Telecommunications Deloitte www.sonaecom.pt Sumol+Compal, S.A. (ex - Sumolis) Consumer Goods Other www.sumolcompal.pt Teixeira Duarte - Engenharia e Construções, SA Industrials Other www.tduarte.pt
Toyota Caetano Portugal, SA Industrials Deloitte www.toyotacaetano.pt ZON Multimédia - Serviços de Telecomunicações e Multimédia, SGPS, SA Consumer Services Other www.zon.pt
Page | 29 Table 1.4 –Disclosures of impairment information required by IAS 36.
DISCLOSED SEPARATELY
DISCLOSED TOGETHER WITH
DEPRECIATION OR
AMORTIZATION
DID NOT DISCLOSE
REQUIRED DISCLOSURES # % # % # %
Amount of IL of TFA recognized in the period 22 45.8% 14 36.8% 2 5.3% Amount of Reversals of IL of TFA recognized in the period 19 39.6% 13 34.2% 6 15.8% Line Item in the Income Statement in which the IL were
recognized 21 55.3% - - 17 44.7%
Line Item in the Income Statement in which the Reversal of
IL were recognized 23 60.5% - - 15 39.5%
Amount of IL of TFA of revalued assets recognized in the
period 0 0.0% 0 0% 0 0.0%
Amount of Reversals of IL of TFA of revalued assets
recognized in the period 0 0.0% 0 0% 0 0.0%
IL and reversals of IL of TFA by reportable segment 4 10.5% 7 18.4% 27 71.1% Causes of the IL of TFA recognized in the period 3 7.9% - - 35 92.1%
Nature of the Asset 9 18.8% - - 29 76.3%
Description of the Cash-Generating Unit 6 15.8% - - 32 84.2% Amount of IL or Reversal of IL of TFA by class of assets
and by reportable segment for each CGU 0 0.0% 0 0.0% 0 0.0% If the CGU changes, the description of the previous and
reasons for the change 0 0.0% 0 0.0% 0 0.0%
Whether the Recoverable Amount is the Fair Value less
Costs to Sell or Value in Use 3 7.9% - - 35 92.1%
If the Fair Value less Costs to Sell, the basis used to
determine it 0 0.0% - - 38 100%
If Value in Use, the discount rate(s) used in the current
estimate and previous estimate (if any) 3 7.9% - - 35 92.1% The main classes of assets affected by the IL or Reversals of
2. Other Exhibits
Page | 1 Table 2.1 – IAS 36 versus FAS 144: a comparative analysis.
TOPICS IAS 36 FAS 144
Impairment loss
When the carrying amount of the assets is greater than its recoverable amount
When the carrying amount of the assets is not recoverable and exceeds its fair value
Impairment testing
Whenever there is any indication that the asset may be impaired
whenever events or changes in circumstances indicate that its carrying amount may not be recoverable
Level of Impairment analysis
Cash-Generating Unit (CGU) Asset group
Recoverable amount
The highest value between the asset's fair value minus costs to sell and its value in use
Sum of the expected future cash flows directly associated with and that are expected to arise as a direct result of the use and eventual disposition of the asset (without interest charges)
Recording the impairment
The impairment charges are
accumulated in a contra-account to the asset
The impairment charges are directly recorded against the asset, creating a new cost basis
Impairment adjustment
Decrease the carrying amount of the asset to its recoverable amount
Reduce the carrying amount of the asset to its fair value (the fair value becomes the new cost basis instead of the expected future cash flows)
Reversal of impairment
When the recoverable amount is greater than carrying amount of the asset
Not allowed
Reversal adjustment
Increase the asset's carrying amount to its recoverable amount, but only to the maximum value of the carrying amount of the asset if no impairment had been recognized
Not allowed
Revalued assets' impairment
Any impairment loss (reversal) in revalued assets is treated as a decrease (increase) in the revaluation
Not allowed
Statement of recognition
Statement of Profit and Loss Income Statement, as a component of income from continuing
Page | 2
Disclosures 5) Amount of impairment losses and reversals, the line items they are included and the amount of impairment losses and reversals on revalued assets;
6) Impairment losses and reversals for each reportable segment, if
companies report according to IFRS 8;
7) For material impairments and reversals:
a) Causes; b) Amount;
c) Nature of the asset; d) Reportable segment; e) Description of the CGU;
Amount of impairments by class of assets and reportable segment for each CGU; If it changes, the description of the previous CGU and reasons for the change;
f) Method of calculus of the recoverable amount, basis of calculus of fair value less costs to sell and discount rate for value in use;
8) For impairments that are material in aggregate for the financial
statements:
c) Main classes of assets; d) Causes;
1) Description of the asset impaired and the cause of the impairment loss;
2) Amount of the impairment loss and the caption in the income statement in which the
impairment loss is aggregated; 3) Method used to determine fair
value;
4) The business segment(s) affected, under FASB Statement 131;
Page | 3 Table 2.2 – Summary of the previous empirical research.
AUTHOR/DATE OBJECTIVES COUNTRY RESULTS AND CONCLUSIONS
Linda J. Zucca; David R. Campbell; 1992
Cover the gap in the empirical research that applies directly to the write-downs, which might be covered by the standards (at this time there were no standards regarding impairment of assets).
U.S.A. The majority of the firms wrote down their assets in a period of already below normal earnings (a "big bath"), but 25% offset the write-down with other gains or unusually high earnings (income smoothing).
Neil Garrod; Pirkovic S. Ratej; Aljosa Valentincic; 2007
Study the impact of economic incentives subject to political cost on accounting choice.
Slovenia Profit firms adopt earnings-decreasing accounting policies, in order to decrease (but not annul) the current period corporate tax. Conversely, the firms that would not pay current taxes manage earnings upward. Moreover, they find that some earnings management occurs in the operating profit level, but the “real” economic transactions are not managed, because it leads to the reduction of the value of the firm.
Rong-Ruye Duh; Wen-Chih Lee; Ching-Chieh Lin; 2009
Analyse whether the reversal of an impairment loss is an opportunity to manage earnings and if it is
connected with managers‟ incentives. In addition, it studies the corporate governance mechanism as an agent that can mitigate this behaviour.
Taiwan The firms that recognize more impairment losses are the more likely to reverse impairment losses, if it avoids an earnings decline in a following period, which is consistent with the "cookie jar" reserve hypothesis. This is more evident in firms with higher debt ratios. However, an effective corporate governance mechanism could mitigate such behaviour.
Edward J. Riedl; 2004
Contrast the determinants of reported write-off amounts before and after SFAS 121 (i.e., the relative
associations across these two regimes).
U.S.A. The reporting of write-offs under SFAS 121 has decreased in quality, consistent with criticism o the standard. Economic factors have a weaker mapping into write-offs reported after SFAS 121 (it is consistent across macro, industry and firm specific variables). Moreover, there is a higher connection between write-offs and “big bath” behaviour after the standard was introduced. It implies that this is an opportunistic reporting by managers rather than the provision of their private information.
Rees et al Analyse whether the companies reporting permanent
assets impairment are engaged in earnings management in the year of the write-down.
U.S.A. Abnormal accruals in the write-down year are reliable indicators of firm value, and so there is no evidence supporting the idea of earnings management in these periods of abnormal accruals.
Joana Gonzalez 2008
Analyse the accounting disclosures of tangible fixed assets, focusing on the potential errors that might have in the financial statements.
Portugal The companies disclose less information than required by law and voluntary disclosures are scarce.
Page | 4 Table 2.3 – Percentage of tangible fixed assets regarding total assets.
COMPANIES TOTAL ASSETS TOTAL FIXED ASSETS
(TFA)
TFA AS A PERCENTAGE OF
TOTAL ASSETS Altri, SGPS, SA 1,114,850,747 € 473,140,189 € 42.4% Brisa - Auto Estradas de Portugal, SA 5,593,808 € 50,491 € 0.9% Cimpor - Cimentos de Portugal, SGPS, SA 4,615,255 € 2,007,926 € 43.5%
Cofina - SGPS, SA 243,717,225 € 11,543,485 € 4.7% Corticeira Amorim - SGPS, SA 574,722 € 179,777 € 31.3% EDP - Energias de Portugal, SA 35,709,095 € 82,450 € 0.2%
EDP Renováveis, SA 9,396,556 € 7,570,466 € 80.6% Estoril Sol, SGPS, S.A. 343,926,252 € 158,287,187 € 46.0% F. Ramada - Investimentos, SGPS, SA 196,775,010 € 7,487,031 € 3.8% Fisipe - Fibras Sintéticas de Portugal, SA 56,774,873 € 27,025,405 € 47.6%
Galp Energia, SGPS, SA 6,623,000 € 2,760,142 € 41.7% Glintt - Global Intelligent Technologies, SGPS, SA (ex Pararede) 198,662,092 € 4,287,287 € 2.2%
Grupo Media Capital, SGPS, SA 448,124,298 € 39,134,926 € 8.7% Grupo Soares da Costa, SGPS, S.A. 1,380,360,221 € 533,622,505 € 38.7%
Ibersol - SGPS, SA 212,480,977 € 118,483,939 € 55.8% Imobiliária Construtora Grão Pará, SA 93,056,172 € 58,771,448 € 63.2% Impresa - SGPS, SA 519,071,075 € 43,354,398 € 8.4% Inapa - Investimentos, Participações e Gestão, SA 762,811 € 104,288 € 13.7%
Jerónimo Martins - SGPS, SA 3,726,565 € 1,874,863 € 50.3% Lisgráfica - Impressão e Artes Gráficas, SA 74,915,501 € 32,798,605 € 43.8% Martifer - SGPS, SA 1,348,500,668 € 503,425,141 € 37.3% Mota-Engil, SGPS, S.A. 3,709,651,254 € 1,639,401,157 € 44.2% Novabase, SGPS, SA 203,210,000 € 8,121,000 € 4.0% Papelaria Fernandes - Indústria e Comércio, SA 27,768 € 19,723 € 71.0% Portucel - Empresa Produtora de Pasta e Papel, SA 2,451,338,367 € 1,220,017,686 € 49.8% Portugal Telecom, SGPS, S.A. 13,713,103,128 € 4,637,837,013 € 33.8% Reditus - SGPS, SA 131,277,168 € 15,085,454 € 11.5% REN - Redes Energéticas Nacionais, SGPS, SA 3,823,007 € 2,847,243 € 74.5% SAG Gest - Soluções Automóvel Globais, SGPS, SA 895,706,015 € 376,643,109 € 42.0% Semapa - Sociedade Investimento e Gestão, SGPS, SA 3,280,478,217 € 1,775,576,229 € 54.1% Sociedade Comercial Orey Antunes, SA 77,076,957 € 10,585,324 € 13.7% Sonae - SGPS, SA 7,306,190,411 € 2,507,943,036 € 34.3% Sonae Indústria, SGPS, SA 1,918,366,492 € 1,202,504,678 € 62.7% Sonaecom - SGPS, SA 1,973,441,436 € 585,741,539 € 29.7% Sumol+Compal, S.A. (ex - Sumolis) 649,922,796 € 97,435,930 € 15.0% Teixeira Duarte - Engenharia e Construções, SA 3,178,037 € 506,670 € 15.9% Toyota Caetano Portugal, SA 342,620,660 € 100,359,672 € 29.3% ZON Multimédia - Serviços de Telecomunicações e Multimédia, SGPS, SA 1,323,095,179 € 468,007,263 € 35.4%
Page | 5 Table 2.4 – Possible causes of impairment losses mentioned in IAS 36.
CAUSES FOR IMPAIRMENT Companies that
disclosed the cause EXTERNAL CAUSES
Market value decline -
Negative change in technology, markets, economy or laws Corticeira Amorim
Increases in market interest rates -
Company stock price is below Book Value -
INTERNAL CAUSES
Obsolescence or physical damage Portucel
Asset is part of a restructuring or held for disposal -
Worse economic performance than expected -
OTHER Martifer
Total of disclosures of the cause of impairment 3 Total of companies that disclosed the cause of impairment 3