Repositório ISCTE-IUL
Deposited in Repositório ISCTE-IUL:
2019-04-09
Deposited version:
Post-print
Peer-review status of attached file:
Peer-reviewed
Citation for published item:
Morgado, A., Sequeira, T. N., Santos, M., Ferreira-Lopes, A. & Balcão-Reis, A. (2016). Measuring labour mismatch in Europe. Social Indicators Research. 129 (1), 161-179
Further information on publisher's website:
10.1007/s11205-015-1097-0
Publisher's copyright statement:
This is the peer reviewed version of the following article: Morgado, A., Sequeira, T. N., Santos, M., Ferreira-Lopes, A. & Balcão-Reis, A. (2016). Measuring labour mismatch in Europe. Social Indicators Research. 129 (1), 161-179, which has been published in final form at
https://dx.doi.org/10.1007/s11205-015-1097-0. This article may be used for non-commercial purposes in accordance with the Publisher's Terms and Conditions for self-archiving.
Use policy
Creative Commons CC BY 4.0
The full-text may be used and/or reproduced, and given to third parties in any format or medium, without prior permission or charge, for personal research or study, educational, or not-for-profit purposes provided that:
• a full bibliographic reference is made to the original source • a link is made to the metadata record in the Repository • the full-text is not changed in any way
The full-text must not be sold in any format or medium without the formal permission of the copyright holders.
Serviços de Informação e Documentação, Instituto Universitário de Lisboa (ISCTE-IUL) Av. das Forças Armadas, Edifício II, 1649-026 Lisboa Portugal
Measuring Labour Mismatch in Europe
∗
Ant´
onio Morgado
†Tiago Neves Sequeira
‡Marcelo Santos
§Alexandra Ferreira-Lopes
¶Ana Balc˜
ao Reis
∥Abstract
We calculate aggregate measures of mismatch in the labour market for 30 European countries. These indicators measure vertical mismatch (related to the level of education, e.g. overeducation, and undereducation) and horizontal mismatch (related to the field of education) and are comparable across countries and through time. We obtain that in European countries between 15% to nearly 35% of workers have a job for which they have more (or less) qualifications than the usual level. Approximately 20% to nearly 50% work in a job for which they do not have the usual field qualification. There is a great variability on mismatch incidence across European labour markets. Undereducation affects more workers than overeducation in most European countries. Low correlations between mismatch and unemployment indicate that mismatch should be regarded as an additional informative variable, useful to characterize labour markets. We also study the influence of the different measures of mismatch on the evolution of per capita output in both the short and long-run. We find evidence of strong short-run effects of mismatch.
JEL Classification: J24, O50.
Keywords: Education, Human Capital, Mismatch, Labour Market.
∗We kindly acknowledge financial support by Funda¸c˜ao para a Ciˆencia e Tecnologia, under project Education
Mismatches and Productivity Differences (PTDC/EGE-ECO/112499/2009). The raw micro-data used in this paper are from the Labour Force Survey (LFS) and were supplied by the Eurostat, under contract LFS/2012/22, which we acknowledge. The responsibility for the conclusions in this paper is the authors’ and not of Eurostat, the European Commission, or any of the national authorities whose data have been used.
†ISCAL - IPL. Polithecnic Institute of Lisbon.
‡Corresponding author. Departamento de Gest˜ao e Economia and CEFAGE-UBI. Universidade da Beira
Interior. Estrada do Sineiro. 6200-209 Covilh˜a, Portugal. email: [email protected].
§Departamento de Gest˜ao e Economia and CEFAGE-UBI. Universidade da Beira Interior.
¶Instituto Universit´ario de Lisboa, ISCTE-IUL, ISCTE Business School Economics Department, BRU-IUL
(Business Research Unit), Lisboa, Portugal, and CEFAGE-UBI.
1
Introduction
Mismatch in labour markets is usually associated with the presence of overeducation and undereducation, meaning the extent to which individuals possess a level of education and/or training above or below the one required for their job, respectively. Some researchers also look at field or horizontal mismatch. This has been essentially used to estimate private returns for both types of mismatch. In fact, the existence of overeducation in labour markets may question the benefits of public funding of higher education, even if overeducation may have positive private returns or premia. Until now, mismatch measures have been obtained mainly through individual questionnaires, using subjective measures and for just a few countries.1
Alternative methods2 such as job analysis or realized matches have also been used, but in a
minority of studies. While the first method supposes a detailed description of the required skills for each profession, which is available only for a few countries in the world, the second is based on measuring deviations from a central measure of the distribution. Until now, the use of the realized matches method has faced the scarcity of large databases with sufficient information to perform the analysis. Consequently, aggregated labor mismatch comparisons between different countries and across several years are absent from the literature.
We obtain new evidence of mismatch using aggregate measures that are comparable across countries and over time. As becomes evident from the survey provided by Leuven and Oost-erbeek (2011) (11), there have been no earlier attempts to obtain aggregate and comparable measures of mismatch. Instead, the literature has focused on estimating the returns of mis-match, that is, the conditional change on wages due to mismatch.
We calculate values of several different types of mismatch for 30 countries for the period between 1993 and 2011 using a dataset from the Labour Force Survey. Our main objective in this paper is to provide (equilibrium) measures of mismatch in European countries and thus the realized matches method fits our purposes perfectly well . Our contribution to the literature is three-fold: (i) we provide new aggregate evidence on vertical mismatch (total, under- and overeducation, strong under- and overeducation) as for horizontal, or field, mismatch that is
1We have found articles that individually evaluate the effects of mismatch measures in USA, Canada, UK,
Netherlands, France, Germany, Spain, Portugal and Hong Kong. Those measures are not comparable due to different sources, year coverage, and methods. Sloane (2002) (20) presents a detailed review of some of these papers.
comparable by countries and years, presenting a new panel dataset with 30 countries during nearly 20 years; (ii) we provide joint and comparable evidence on vertical mismatch and horizontal mismatch, and (iii) we relate the constructed measures with the short and long-run evolution of the economy.
This work has the following structure. In Section 2, we revise the existing literature on labour mismatch. In Section 3 we describe the methodology and data used. Section 4 de-scribes our new measures of mismatch, detailing the evidence they highlight for European countries and Section 5 analyses the influence of mismatch in the short and long-run economic performance. Section 6 concludes.
2
Literature Review
Mismatch has been widely referred to in the literature, specifically related to unemployment duration and wage inequality, for which Ordine and Rose (2011) (16) and Budria and Moro-Egido (2008) (3) are good examples. Undereducation and overeducation are specific types of mismatch. We may think that mismatch is a transitory short-term phenomenon, associated with rigidities in flows in and out of employment. Actually, overeducation is referred to by Ordine and Rose (2011) (16) as a voluntary short-term strategy to enter the labour market, but as they point out, it may also be a consequence of low individual ability for that level of education or it may just be a matter of choice related to compensating advantages in the choice occupation/payoff. Also, overeducation can be the outcome of long periods of unemployment, giving rise to an exacerbation of the availability to enter the labour market loosing the wage premia associated with higher education. Tracing the reasons for mismatches between labour supply and demand is very important, as they can potentially be very costly to the economy, by restricting productivity growth (see Leuven and Oosterbeek, 2011 (11)). Hence, measuring mismatch adequately is central to our subsequent analysis. We do not use the mismatch measures to estimate returns to mismatched workers, as earlier literature did. Instead, we aggregate individual mismatch to obtain national mismatch measures.
Following Hartog (2000) (10), we identify and discuss three methods of measuring over and undereducation, which we describe briefly:
education for the job titles in an occupational classification. The Dictionary of Occu-pational Titles is the result of such an analysis. Detecting mismatch using this method consists basically in comparing a current worker’s situation with the standard match described in, e.g., the Dictionary of Occupational Titles.
2. Worker Self-Assessment, in which the worker specifies the education she deems necessary for the job. This can be done directly through the explicit specification of the type of schooling required, or indirectly, through comparison to the workers’ actual education, assessing whether a higher, or lower, or different education is needed.
3. Realized Matches, in which the required education for a job or occupation is derived from what workers in that job or occupation usually have attained. Mismatch in this methodology is, therefore, assessed by comparing a worker’s education to the mean or mode of education of workers in the same job or occupation, resulting in a measure similar to the variance of the distribution of education levels for the workers in that job or occupation.
Even though objective, Job Analysis can be dated, and has a large measurement error in relation to the assignment of job level codes to any survey responses on the type of work. Also, this assignment can be country-specific, which invalidates international comparisons. Furthermore, any error or ad-hoc choice as far as the matching education/occupation/job is concerned, has a contamination effect throughout the whole analysis, as that matching depends on the personal judgement of job analysts. For Portugal, an occupational classification exists in
Quadros de Pessoal3, and a matching of level and type of education for each type of occupation
has been done in a very aggregate form (Coelho et al. , 1982 (5)). This can be seen in Kiker
et al. (1997) (13), where the authors conclude that this method detects the higher mismatch
(in relation to Realized Matches).4
3A matched employer-employee dataset with information for all firms with at least one wage earner. 4Specifically, Job Analysis detects that, of all workers, 33.1% are overeducated, 37.5% are undereducated
and 29.4% are correct matches. The methodology of Realized Matches methodology, using the mean as the reference, detects 85.6% of correct matches (9.4% overeducation and 5% of undereducation), but using the mode as the reference, correct matches are no more than 57.5% (25.5% overeducation and 17% undereduca-tion). These results are in line with those we obtain for Portugal (in 1995, near 12% overeducation and 4% undereducation, compares with the mean results of 9.4% and 5%, respectively), although we analyse a more recent period. This comparative study was performed using Quadros de Pessoal for the period 1985-1991. Comparison with Worker Self-Assessment method is not feasible.
Worker Self-Assessment is as an alternative to Job Analysis but is subjective. Even though it deals with the survey respondent’s job specifically and does not seek to match the responses to any pre-existing standard, it rests on workers’ own judgement. The worker may overstate the requirements of education and/or training to the job due to a status effect, or the re-sponses may reproduce the hiring standards, not the match between education/training and job/occupation. Actually, as school levels increase with time, employers tend to adjust hir-ing standards, even though the nature and skills of a job may not have changed accordhir-ingly. Worker Self-Assessment is widely used due to its relative simplicity. Budria and Moro-Egido (2008) (3) use the worker responses from the survey of European Community Household Panel (ECHP) to cue the following questions: (a) Do you feel that you have skills or qualifications to do a more demanding job than the one you have now? and (b) Have you had formal training or education that has given you skills needed for your present type of work? The answers are then classified according to the following rule: if ‘yes’ to both, the worker is overqualified, if ‘no’ to both, the worker is incorrectly qualified, if ‘yes’ to question (a) and ‘no’ to question (b), the worker is strongly mismatched, and finally, if ‘no’ to question (a) and ‘yes’ to question (b), the worker is correctly qualified.
An example of the use of Realized Matches methodology can be found in Kiker and Santos (1991) (12) for Portugal, where they classify a worker as overeducated if he has the number of years of schooling greater than one standard deviation above the mean for his (essentially) three-digit occupational code, whereas a worker is classified as undereducated if his years of schooling are more than one standard deviation below the mean for his occupational code. Also, Mendes de Oliveira et al. (2000) (15) use this method, but instead of the mean, they use the mode as the reference. This methodology to measure mismatch has been criticized for using the endogenous (equilibrium) assignment of jobs, which depends on hiring standards and labour market conditions, to track an error in that same assignment, that is, mismatch, without using any exogenous information to separate correct matches from mismatches. It uses observations on the realized equilibrium between demand and supply. Thus, it measures verified mismatch.
There are fewer examples in the literature that measure field, or horizontal, mismatch. Robst (2007) measures horizontal mismatch in the US using the self-assessment approach. Wolbers (2003) studies Field mismatch for 13 European countries using a Job Analysis
ap-proach.
3
Methodology and Data
Using the Labour Force Survey (LFS) we propose to measure mismatch using the Realized Matches approach, following the works of Kiker (13), (15), and (12). We choose this method-ology as we wish to guarantee international comparison of results as well as time-coherence.
The Labour Force Survey (LFS) database contains worker specific information in relation to (reference to Eurostat variable code):
• highest level of education or training successfully completed (HATLEVEL) • field of highest level of education or training successfully complete (HATFIELD) • occupation (ISCO4D)
• economic activity of the local unit (NACE3D, NA113D).
There is information for the following 30 countries: Austria, Belgium, Bulgaria, Cyprus, Czech Republic, Denmark, Estonia, Finland, France, Germany, Greece, Hungary, Iceland, Ireland, Italy, Latvia, Lithuania, Luxembourg, Malta, Netherlands, Norway, Poland, Portugal, Romania, Slovak Republic, Slovenia, Spain, Sweden, Switzerland and United Kingdom. Most countries have information available for the HATLEVEL variable from 1993 to 2011 (19 years) and for the HATFIELD variable from 2003 to 2011 (9 years). In the Appendix we include information about the number of observations for both variables and each country. Definitions for both variables are also in the Appendix.
We start by calculating the average highest level of education, measured in years of educa-tion, attained by workers in a given occupation in a certain economic activity in each country. Because in different waves of the LFS, the included ISCED levels in the database are different, we had to consider a correspondence scale between ISCED levels and years of education.5 In the database the HATLEVEL variable (after conversion into years of education) oscillates between 0 years and 19 years, with an average of around 11 years of education.
5This procedure has now become common since large country surveys use ISCED levels and not years of
education as a measure of schooling attainment. (see e.g. Biagetti and Scicchitano (2001) (2) and Gloker and Steiner (2011) (9)). The definition of the source HATLEVEL variable and the correspondence scale between the HATLEVEL and years of education are in the Appendix.
If a worker lies beyond one standard-deviation from the mean, we consider that there is vertical mismatch and signal it with 1 or -1 depending on being above or below the high or low limits of the interval. In those cases we say that the individual is overeducated or undereducated, respectively. We also signal the cases that lie beyond two standard-deviations from the mean, and signal those with 2 or -2, respectively depending on wether the observation is over or under the limit of the interval. In these cases, we say that the individual is strongly overeducated and strongly undereducated, respectively. Our measure of vertical mismatch is the proportion of cases signaled -2, -1, 1 and 2 in relation to the total number of observations for a given country in a given year. They represent respectively undereducation and overeducation. That measure will have a value between 0 and 1, such that 0 means no mismatch and 1 means that all workers are mismatched. Overeducation and undereducation are additive and total the percentage of vertical mismatch.
More precisely, let ei represent the highest level of education for worker i as indicated in
the data of LFS (e is the average and se is the standard-error of ei). Let oi be the ocupation
of that worker and ai the economic activity according to NACE classification. We define the
indicator function, specific for country c and year y as
IEicy(ei|oi, ai, ci, yi) = −2 ⇐= ei− e < −2se
IEicy(ei|oi, ai, ci, yi) = −1 ⇐= −2se < ei− e < −se
IEicy(ei|oi, ai, ci, yi) = 0⇐= −se< ei− e < se
IEicy(ei|oi, ai, ci, yi) = 1⇐= se < ei− e < 2se
IEicy(ei|oi, ai, ci, yi) = 2 ⇐= ei− e > 2se
Thus, our measure of mismatch for a given country c and year y is
M Ec,y =
∑
i:IEicy̸=0
|IEicy|
ncy
An overeducation measure can thus be obtained using just IE = 1 or IE = 2 and an undereducation measure using IE = −1 or IE = −2. A strongly overeducated measure is obtained using just IE = 2 and a strongly undereducated measure is obtained using just
IE = −2. This methodology allows us to identify the proportion of workers that have less
education or more education than what is typically required for the job in a given occupation, economic activity, and country (which is the interpretation of the value for the mean level of education). Hence ,the sum of both proportions yields the level of mismatch, which is the
value of indicator M Ec,y.
We also apply this methodology to measure the mismatch in the field of education, i.e., if a worker has not completed the usual field of education to perform a given job. We establish variable fi, representing the field of education for worker i (f is the average and sf is the
standard-error of fi).6 Therefore, the objective is to understand whether a worker possesses
adequate training for her job or if she is performing a task completely unrelated to the training she received, which will be a case of horizontal mismatch. Our measure of horizontal mismatch is thus: IFicy(fi|oi, ai, ci, yi) = 0⇐= −sf < fi − f < sf M Fc,y = ∑ i:IFicy̸=0 |IFicy| ncy
This measure is also country and year-specific. These measures are comparable across country and over time.
4
Mismatch in Europe
In this section we will concentrate on describing the mismatch measures in Europe. First, we analyse vertical mismatch (under and overeducation) and then we analyse horizontal mis-match.7
4.1
Under and Overeducation (vertical mismatch) in Europe
There is a great diversity in the level and evolution of vertical mismatch across countries and also on the prevalence of under and overeducation. This may reinforce the evidence for specific labour markets in each of the European countries and thus the possibility that those labour markets are affected by idiossincratic shocks. The following figures show the evolution
6An alternative approach here would be to consider any deviation from the mode. However, given that the
definitions of the source variable HATFIELD have a certain notion of ‘proximity’ between the needed skills to attain different fields of study (e.g. Humanities, languages and arts (200) is closer to Foreign languages (222) than to Computer science (481)) we choose the approach that measures distance from the average, which we think better captures this notion of ‘proximity’ between fields of study.
7The whole database with the mismatch measures, by country, year, sector of activity, and occupation is
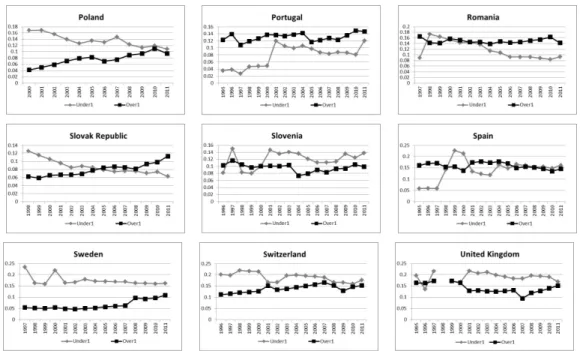
of vertical mismatch (the sum of under- and overeducation) by country throughout the years (Figure 1). The first insight from the figures is the great diversity in the incidence of vertical mismatch across countries. Switzerland and UK tend to have the highest level within the Northern and Central Europe countries, Italy the highest amongst the Southern countries and Estonia and Romania the highest amongst the Eastern European countries. Denmark, Portugal, and Slovak Republic tend to have the lowest level of vertical mismatch in their respective groups. From the first inspection of the figures it is not possible to anticipate any relationship with income levels, or even growth or unemployment. There seems to be a convergence of vertical mismatch levels amongst Northern and Central European countries, with a slight decrease in mismatch after 1997 in some countries, a pattern that appears to occur in the Southern and Eastern European countries only after 2001.
Figure 1: Vertical Mismatch for a set of Regions in Europe
When under- and overeducation are dissected by country (see Figure 2), there is again evidence according to which vertical mismatch is a country-level phenomenon. Undereducation is a more prevalent phenomenon than overducation; considering all the country and year pairs for which we have data; in 76.5% of the cases undereducation is higher than overeducation.
For almost half of the countries undereducation is stronger than overeducation for the whole period. In a smaller set of countries there are mixed results and only for Portugal is there more incidence of overeducation than of undereducation.8 Also here, it is not possible to
anticipate a clear relationship with income, growth, or unemployment although we can note that southern European countries tend to be in the group of countries in which overeducation tends to dominate and the richest and northern European countries tend to be in the group of countries in which undereducation dominates.
4.2
Horizontal Mismatch in Europe
Regarding horizontal (or field) mismatch, there is also great diversity across countries. Norway, Poland, Spain, and Estonia present the highest levels of horizontal mismatch with nearly 40% of workers not matching the average field for each occupation and activity. The lowest levels of horizontal mismatch are seen in Germany, Denmark, Portugal, Cyprus, Greece, and Slovak Republic. There is an evident time pattern for a drop in horizontal mismatch after 2008, which is more evident for Northern, Central, and Southern European countries than for Eastern European Countries (see Figure 3).
8Undereducation is always higher than overeducation in Austria, Bulgaria, Denmark, Estonia, Finland,
France, Hungary, Latvia, Netherlands, Norway, Poland, Sweeden, and Switzerland. Undereducation is higher than overeducation in a majority of the years in the sample in Belgium, Czech Republic, Ireland. Lithuania, Luxembourg, Slovenia and United Kingdom. In Iceland, Cyprus, Germany, Malta, Slovak Republic, and Spain there are mixed results (undereducation and overeducation levels are very close and there are switches of the one that prevails along the time series). In Italy, Greece and Romania overeducation is higher than undereducation in a majority of the years in the sample and Portugal is the only country that presents higher levels of over-than of undereducation in the whole country time-series.
Figure 2: Undereducation and overeducation across time for a set of 30 countries
4.3
Mismatch by Sector and Occupation
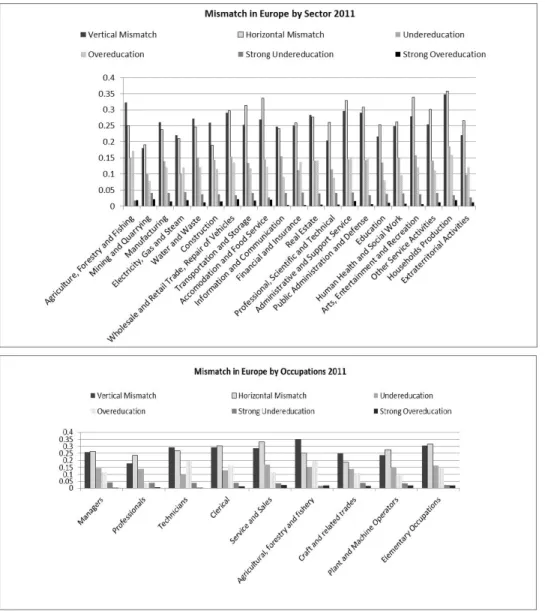
In the whole database vertical mismatch is higher in “household production” and “agriculture, forestry and fishery”. There are a few sectors with more overeducated workers than underedu-cated, which are “agriculture, forestry and fishing” (A), “information and communication”(J), “financial and insurance” (K) “real estate” (L), “administrative and support services“ (N), “public administration and defense” (O), and “extraterritorial organizations” (U). When com-paring strong undereducation and strong overeducation, strong undereducation is higher for all economic sectors of activity. Interestingly, horizontal mismatch tends to be quite correlated with vertical mismatch across sectors of economic activity, with quite similar levels. Excep-tions are for “agriculture, forestry and fishery”where horizontal mismatch is quite smaller and for “Transportation and Storage”, “Accomodation and Food Service”, “Professional, Scientific and Technical” and “Arts, Entertainment and Recreation”, for which horizontal mismatch is much higher than vertical mismatch.
When analysed by professions or occupations, vertical mismatch is higher for “agricultural, forestry and fishery” workers, “elementary occupations”, “services and sales”, “technicians”, and “clericals”. On the contrary, mismatch is lower amongst “managers”and “professionals”. Overeducation is prevalent among “technicians”, “clerical”, “agricultural, forestry and fishery” workers and undereducated workers prevail in “managers”, “professionals”, “service and sales”, “craft and related trades”, “plant and machine operators” and “elementary occupations”. Horizontal mismatch tends to be higher for “elementary occupations” and “service and sales” and lower for “crafts and related trades”. Data of mismatch by sector and occupation are plotted in Figure 4.
Interestingly, correlations between vertical mismatch9 by sector and occupations between
countries are low and differ considerably between countries. Table 1 shows the correlations between each country vertical mismatch level and the European level given by the whole dataset obtained for the year 2011. The table reveals a great heterogeneity between countries meaning that the distribution of vertical mismatch proportions between sectors of activity and occupations is quite diverse across European countries. It is not even possible to identify groups of countries in which both correlations (sectoral and occupational) are high or low, nor
9We do not perform this analysis for horizontal mismatch due to the small number of time-series observations
Figure 4: Mismatch in Europe by Sector and Occupation 2011
by income level, geographic proximity or any other criteria.
4.4
Mismatch per country: summary statistics
In this section, we analyse some of the properties of the newly created mismatch series. Table 2 presents some statistics. On average, for European countries 25.9% workers are mismatched, i.e., have quite different levels of education than the average for the profession, sector, and country. Of those, more are undereducated (near 15%) and the rest (near 11%) are overedu-cated. Strong over and undereducation is low when compared to the total, meaning that, on average amongst the European countries, strong undereducation is 3.6% while strong
overe-Table 1: Correlations between each country vertical mismatch and European mismatch by sector and occupation
Country Sectoral Mismatch Occupational Mismatch
Austria 0.20 0.25 Belgium 0.23 0.60 Bulgaria 0.21 0.12 Cyprus 0.41 0.77 Czech Rep -0.02 0.00 Germany 0.22 0.37 Denmark 0.26 0.70 Estonia -0.11 0.70 Finland 0.44 0.25 France 0.66 0.75 Greece 0.38 0.21 Hungary 0.38 0.68 Iceland 0.33 0.73 Ireland 0.57 0.48 Italy 0.11 0.31 Latvia 0.28 0.71 Lithuania 0.47 0.56 Luxembourg 0.60 0.43 Malta -0.11 0.20 Netherlands 0.51 0.42 Norway 0.44 0.65 Poland 0.57 0.66 Portugal -0.09 0.16 Romania 0.44 0.65 Slovenia 0.41 0.31 Slovak Republic -0.14 0.02 Spain 0.61 0.72 Sweden 0.47 0.82 Switzerland 0.14 0.52 United Kingdom 0.83 0.82
Note: Correlations are country data correlations with EU data in 2011. Example: the vertical mismatch by sectors in Austria has a correlation of 20% with the vertical mismatch by sectors in Europe.
Table 2: Descriptive Statistics and Unit Root Tests
Variable Vert. Mismatch Undered. Overed. Hor. Mismatch St. Under St. Over
Average 0.259 0.146 0.113 0.300 0.036 0.016 Median 0.261 0.150 0.112 0.287 0.036 0.015 St. Deviation 0.053 0.042 0.036 0.061 0.017 0.013 Maximum 0.388 0.281 0.207 0.461 0.093 0.062 Minimum 0.135 0.026 0.038 0.190 0.001 0.000 Autocorrelation 0.33 0.44 0.43 0.45 0.36 0.44 Panel UR (2 lags) 0.042 0.285 0.678 – 1.929 1.811** (p-value) (0.517) (0.612) (0.751) (0.973) (0.035)
Panel UR (2 lags) w. trend 1.678 2.635 1.294 – 2.385 1.781
(p-value) (0.953) (0.996) (0.902) (0.991) (0.963)
Notes: * means significance at 10% level, ** at 5% level and *** at 1% level. Panel Autocorrelation is the mean of the AC(1) coefficient for the 30 countries in the database. Panel UR tests are the Pesaran (2007) panel unit root test in which the null is that the series are I(1). Variables: Vert.
Mismatch=Vertical Mismatch; Undered=Undereducated; Overed=Overeducated; Hor. Mismatch= Horizontal Mismatch; St. Under= Strongly undereducated and St.Over=Strongly overeducated.
ducation is 1.6%. Additionally, horizontal mismatch is around 30%. The averages for the variables are very close to the median, meaning that the data are quite evenly distributed around the mean. Those variables are relatively persistent with autocorrelation coefficients around 0.4. Most countries present high autocorrelation coefficients.
The Pesaran (2007) test for unit roots indicates that the null of no-cointegration is rejected, with one exception: the test without trend for the strong overeducated measure. Although the power of this test is low for moderate time-series dimension panels, this is an indication for the estimation strategy we use in the following Section, meaning that stationary econometric methods should not be applied.
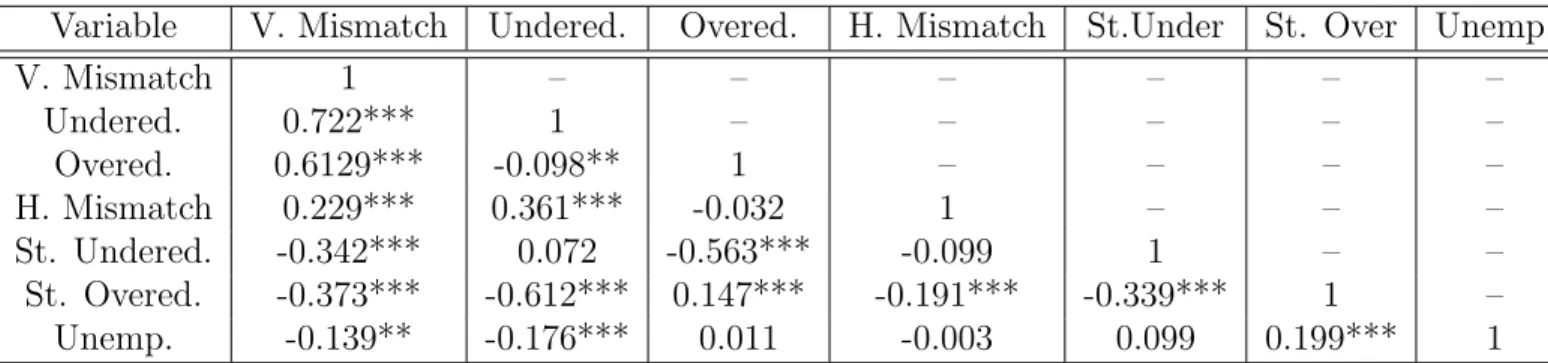
In what follows we will relate our different measures of mismatch amongst themselves and with unemployment (from the Eurostat). Correlations between the incidence of mis-match according to the different measures are shown in Table 3. Undereducation and strong overeducation are negatively correlated and the same is found for strong undereducation and overeducation. Undereducation is positively correlated with horizontal mismatch while strong overeducation is negatively correlated with horizontal mismatch.
Correlations with unemployment are also interesting. First, these correlations are low (below 0.2). This makes our mismatch measures interesting complements of unemployment to characterize the labour market, giving additional information to politicians and analysts concerned with labour market features and distortions. Second, undereducation is negatively
Table 3: Correlations between mismatch measures
Variable V. Mismatch Undered. Overed. H. Mismatch St.Under St. Over Unemp.
V. Mismatch 1 – – – – – – Undered. 0.722*** 1 – – – – – Overed. 0.6129*** -0.098** 1 – – – – H. Mismatch 0.229*** 0.361*** -0.032 1 – – – St. Undered. -0.342*** 0.072 -0.563*** -0.099 1 – – St. Overed. -0.373*** -0.612*** 0.147*** -0.191*** -0.339*** 1 – Unemp. -0.139** -0.176*** 0.011 -0.003 0.099 0.199*** 1
Notes: * means significance at 10% level, ** at 5% level and *** at 1% level. Variables: V. Mismatch=Vertical Mismatch; Undered=Undereducated; Overed=Overeducated; H. Mismatch= Horizontal Mismatch; St. Under= Strongly undereducated; St.Over=Strongly overeducated and
Unemp=Unemployment.
correlated with unemployment, while strong overeducation is positively correlated with unem-ployment (the correlation of overeducation with unemunem-ployment is not significantly different from zero). This suggests that undereducation and (strong) overeducation occur at different moments of the business cycle and/or have different meanings in terms of situation in the la-bor market. Undereducation seems to occur when unemployment is low, suggesting that it is linked to periods or countries with tight labour markets. On the other hand, overeducation, or at least strong overeducation seems to be linked to periods of high unemployment, suggesting that it is in these periods (and/or countries) that workers are willing to accept jobs for which they are overqualified.
5
The Influence of Mismatch in Output per capita
Until now, we have presented new aggregate measures of mismatch in the level of education and field of education and the associated data for European countries. We characterized these data overall and between countries and concluded for a highly diverse picture amongst Euro-pean countries concerning incidence of mismatch. We have also seen that the various types of mismatch are weakly correlated with unemployment, which makes them useful to charac-terize labour market features. In this section we further study possible mismatch associations with income among European countries. Usually labour market features are associated with short-run movements on output (e.g. den Haan et al., 2000 (6)). However, issues such as unemployment and labour market rigidities have increasingly been regarded as structural de-terminants of the economies’ evolution through time (e.g. Mauro and Carmeci, 2003 (14)).
This is why we wish to distinguish short-run from long-run effects of mismatch in our analysis. We use the panel data mean group cointegration method of Pesaran and Smith (1995) (17). This estimator is quite appropriate for our setup as we want to distinguish between short and long-run effects of mismatch. With this estimator, the intercepts, slope coefficients, and error variances are allowed to differ across groups, which seems to fit our evidence of widely differing labour market features across European countries.10 This estimator is also robust to non-stationarity, which is the case for our mismatch measures, as indicated in Table 2.
5.1
Data and Specification
Annual data for per capita output are from the Penn World Tables (PWT), version 8.0. The economic growth rate is calculated from the same variable. Also from the PWT 8.0, we use the share of investment in output (specifically, the share of gross capital formation at current PPP, named csh i), the share of government expenditures in output (specifically, the share of government consumption at current PPP, named as csh g) and the human capital index. These are the usual determinants of economic growth and income in empirical growth exercises. Finally, we also use the annual average of the unemployment rate, from the Eurostat, which comes from the Labour Force Survey and is thus compatible with the mismatch variables discussed earlier. Given that mismatch is a labour market phenomenon, with some potential relationship with unemployment, we think this is a natural choice. Regressions use annual data from 1993 to 2011.
Generally, our model can be specified by the following error correction equation:
∆yit= ϕi(yi,t−1− θ′iXit) + p−1 ∑ j=1 λ∗ij∆yit−1+ q−1 ∑ j=0 δij∗∆Xi,t−j+ µi+ ϵit (1)
where the parameter ϕi is the error-correcting speed of adjustment term, estimated for each
country i. This parameter is expected to be significantly negative under the prior assumption that the variables show a return to a long-run equilibrium.11 The vector θ′
i refers to the 10We present results based on the xtpmg STATA command developed by Backburn III and Frank (2007)
(1). In Pesaran and Smith (1995) (17), the empirical application is for 38 industries for 30 years. In Pesaran, Shin and Smith (1999) (19) one application for the OECD countries uses 24 countries and 31 years and the other is for 10 Asian countries for 16 years. These are comparable dimensions for our panel database.
11It is worth noting that according to the Granger Representation Theorem if and only if ϕ
long-run relationship between the variables, Xit is a k×1 vector of explanatory variables, from
which, for us, the most relevant is the various forms of labor mismatch detailed above, δij∗ are the k×1 coefficient vectors for the lagged differences in explanatory variables ∆Xi,t−j (j being
the introduced lags). λ∗ij are scalars and µi is the group-specific effect. All coefficients are
allowed to be heterogeneous across different countries.
5.2
Results
We divide the results into two main sets. In the first each type of mismatch is entered (as a one lagged level) as the only variable in regressions for the differences in the log of per
capita output (regression results shown in Table 4). Of the 30 countries outlined above, only
Malta does not have sufficient time-series data to enter in regressions. In the second there are other regressors than mismatch explaining economic growth (or the difference in the log of per
capita output), for which regression results are shown in Table 5. In this case, besides Malta,
Switzerland also is excluded due to missing unemployment data. In this analysis we exclude the horizontal mismatch from the set of mismatch measures entering the regressions due to its quite lower time-series dimension, which would greatly decrease the degrees of freedom. One common result is the strong and negative sign for the error correction term which confirms the existence of a long-run cointegrating causal relationship between the variables in each regression, which also validates our approach.
As can be seen in Table 4, there is a significant and negative effect of vertical mismatch on the evolution of per capita output in the short run and a positive effect of horizontal mismatch on long-run economic growth. An increase in the proportion of vertical mismatched workers of 1 percentage point (e.g. from 20% to 21%) would decrease economic growth by 0.427 percentage points, a meaningful quantitative effect. On the contrary, a similar increase in horizontal mismatch would increase growth by an almost equal 0.431 percentage points. Regarding other measures of mismatch, there is a significantly negative effect of undereducation. There is also only one significant result of mismatch in the long-run relationship, which is a negative effect of strong undereducation.
Results in Table 5, which include a set of other variables usually regarded as determinants of the evolution of per capita GDP (in both the short and long-run), the negative and robust
effect of mismatch in the short run is confirmed. However there is a difference in the origin of this negative effect when other regressors are considered (when compared with results in Table 4). In fact, only overeducation and strong overeducation are now significantly related to the short-run evolution of output (with a negative sign) and undereducation appeared with a non-significant coefficient. Quantitatively, the effect of overall mismatch decreases. Now an increase in 1 percentage point in the proportion of mismatched workers implies a decrease in only 0.29 percentage points in the growth of per capita output. However, when dissected to analyse the effect of overeducation the effect is now much greater. An increase in overeducated workers of 1 percentage point would decrease growth by 0.82, and a similar increase in strongly overeducated workers would decrease growth by more than 2 percentage points.
We may now analyse the effects of other variables in the regression. Long-run effects are detected only due to human capital, confirming the positive effect of this variable, also reported in other empirical research. In fact this variable has sizeable effects in long-run growth in most specifications. Regarding short-run effects, and besides the already analysed effect of mismatch, we find significant positive effects of human capital and significant negative effects of government consumption. The effect of human capital in the short run, although somewhat lower than the effect of this same variable in the long-run, is interesting, as human capital is usually regarded as a long-run determinant of growth. The negative effect of government consumption is quite well founded in macroeconomic theory, in both the short and in the long-run. There are two unexpected results on our empirical application. The significant positive effect of unemployment in the short run and the non-significant effect of the investment share in both the short the long run. Interestingly, the exclusion of the government share from the regressions would yield positive and significant results for the investment share, suggesting a crowding-out effect of government consumption. It should also be noted that the fact that our sample includes only developed countries may also imply a small effect of investment even in the long-run. The positive effect of unemployment, much stronger in the short than in the long-run, may be linked with a positive effect of more flexible labour markets on the economy, a hypothesis that deserves further testing. The several changes made to this specification (excluding government share, excluding unemployment) do not change the significant and negative signs of the mismatch and overeducation coefficients. This makes us confident about the robustness of the negative effect of mismatch on the short-run evolution of per capita
Table 4: Pooled Mean Group Estimator
Mismatch Variable V. Mismatch Undered. Overed. H. Mismatch St. Under St. Over
Long-Run Cointegrating Relationship
M ismatcht−1 4.528 0.886 31.273 2.991 -14.463* 6.292
(p-values) (0.137) (0.811) (0.105) (0.559) (0.070) (0.714) Short-Run
M ismatcht−1 -0.427*** -0.330** -0.201 0.431*** -0.280 -0.337
(p-values) (0.001) (0.018) (0.460) (0.001) (0.386) (0.647)
Error Correction Term -0.158*** -0.158*** -0.149*** -0.287*** -0.125*** -0.128***
(p-values) (0.000) (0.000) (0.000) (0.000) (0.000) (0.000)
Constant 1.736*** 1.679*** 1.573*** 2.854*** 1.310*** 1.325***
(p-values) (0.000) (0.000) (0.000) (0.000) (0.000) (0.000)
Notes: * means significance at 10% level, ** at 5% level and *** at 1% level. Dependent variable is the log of the per capita output first differences. Variables: V. Mismatch=Vertical Mismatch; Undered=Undereducated; Overed=Overeducated; H. Mismatch= Horizontal Mismatch; St. Under=
Strongly undereducated, and St.Over=Strongly overeducated.
output.
5.3
Country Effects
One advantage of using heterogeneous panel data estimators, such as the mean group estimator we used, is that we can study the effects in each country and compare them. Table 6 shows the countries’ results, based on the simpler regressions presented in Table 4, with the overall measure of mismatch. Results obtained using other measures of mismatch are discussed in the text. It is possible to present results by country pertaining to the regressions presented in Table 5. However, the aim here is to maximize the time series available by country and the number of countries with available data.12 As expected, negative signs indicating a negative
effect of mismatch on output per capita are abundant. Significant long-run results appear in Belgium, Czech Republic, Estonia, France, Ireland, Iceland, Luxembourg, Norway and Romania. Short-run significant results appear in Denmark, Estonia, Iceland, Norway, Poland and Romania. Positive effects of mismatch are found in Greece in both the short and long run. When the same regressions are run but with undereducation and overeducation, there are many more countries with significant effects from overeducation than from undereducation. The proportion of undereducated workers affects significantly per capita output in Denmark and Slovak Republic (with a negative sign) and in Cyprus (with a positive sign). The proportion of overeducated workers affect significantly per capita output in Belgium, Luxembourg and
Table 5: Pooled Mean Group Estimator (more regressors)
Mismatch Variable V. Mismatch Undered. Overed. St. Under St. Over
Long-Run Cointegrating Relationship
M ismatcht−1 -0.831 -0.305 -1.319 0.569 0.226 (p-values) (0.281) (0.610) (0.375) (0.614) (0.952) InvestmentSharet−1 -1.004 2.533 -1.216 0.098 0.453 (p-values) (0.265) (0.341) (0.632) (0.903) (0.840) GovernmentSharet−1 0.015 -0.980 -18.151 0.036 3.234 (p-values) (0.994) (0.570) (0.362) (0.952) (0.372) HumanCapitalt−1 2.927** -1.763 -1.321 2.024*** 3.465*** (p-values) (0.035) (0.626) (0.624) (0.000) (0.001) U nemploymentt−1 0.050 0.149 0.138* 0.031 0.091 (p-values) (0.588) (0.264) (0.059) (0.139) (0.479) Short-Run M ismatcht−1 -0.293* -0.196 -0.818** -0.326 -2.054** (p-values) (0.054) (0.191) (0.043) (0.389) (0.024) InvestmentSharet−1 -0.014 -0.194 0.046 -0.318 -0.148 (p-values) (0.932) (0.386) (0.814) (0.233) (0.683) GovernmentSharet−1 -0.749** -1.141*** -0.561 -1.211*** -1.087*** (p-values) (0.019) (0.000) (0.226) (0.000) (0.004) HumanCapitalt−1 1.055** 1.007** 1.161*** 0.926** 1.198*** (p-values) (0.023) (0.013) (0.004) (0.012) (0.004) U nemploymentt−1 0.008** 0.006 0.010** 0.006 0.007 (p-values) (0.045) (0.126) (0.043) (0.198) (0.178)
Error Correction Term -0.421*** -0.456*** -0.405*** -0.423*** -0.535***
(p-values) (0.000) (0.000) (0.000) (0.000) (0.000)
Constant 1.182 1.718** 0.687 1.734** 1.956**
(p-values) (0.201) (0.021) (0.484) (0.050) (0.050)
Notes: * means significance at 10% level, ** at 5% level and *** at 1% level. Dependent variable is the log of the per capita output first differences. Variables: V. Mismatch=Vertical Mismatch; Undered=Undereducated; Overed=Overeducated; St. Under= Strongly undereducated and
Slovenia (only in the long run), Bulgaria (only in the short run), France, Iceland, Norway (in both the short and long run – all with a negative sign) – in Slovakia (in the short and long run) and UK (only in the short run) – with a positive sign.
6
Conclusions
We provide new evidence on aggregate mismatch levels (total, under- and overeducation) com-parable by countries and years, presenting a new panel dataset with 30 countries for approxi-mately 20 years, between 1993 and 2011. We also provide a measure of horizontal mismatch for the same 30 countries for a period of 9 years. Additionally, we study the relationship between different measures of mismatch and between mismatch and unemployment. The weak correlation we obtain between mismatch and unemployment implies that mismatch measures may be regarded as supplying additional information about labour markets when compared to the simple analysis of the unemployment rate, Finally, we relate the constructed measures with the evolution of output per capita in both the short and the long-run.
We obtain that in European countries between 15% to nearly 35% of workers have a job for which they have more (or less) qualifications than the usual level, depending on the country. Approximately 20% to nearly 50% work in a job for which they do not have the usual field qualification. There is a great difference in mismatch amongst European labour markets. This may reinforce the evidence for specific labour markets in each European country and thus the possibility that those labour markets are affected by idiosyncratic shocks. Undereducation affects more workers than overeducation in most European countries. Among sectors of activ-ity, “agriculture, forestry and fishery”and “household production” are the ones in which there is the highest proportion of mismatch. Among occupations, it is also among “agricultural, forestry and fishery”workers that both vertical and horizontal mismatch is higher. However, this also differs considerably among European countries.
We study the influence of the different measures of mismatch on the evolution of per capita output in both the short and the long run. Despite the very different mismatch figures in different European labour markets, we have found a robust negative effect of mismatch on the short-run evolution of per capita output in Europe, an effect that is robust to the introduction of the usual predictors of business cycles and growth. These negative effects of mismatch may
Table 6: Effects of Mismatch on per capita Output per country Country V. Mismatch (LR) V. Mismatch (SR)
Austria -2.211 -0.231 Belgium -1.423** -0.250 Bulgaria -21.25 -0.325 Switzerland 8.964 0.530 Cyprus 3.087 0.128 Czech Rep -11.04** -1.925 Germany -4.940 -1.279 Denmark -2.283 -0.295* Estonia -12.02*** -1.713** Spain 1.983 -0.204 Finland -0.416 -0.107 France -2.201* 0.375 Greece 1.912** 0.285* Hungary -1.455 -0.143 Ireland -2.053*** -0.171 Iceland -2.053*** -1.411** Italy -0.478 -0.226 Lithuania 4.142 -0.272 Luxembourg -4.473* -0.448 Latvia 4.031 -0.580 Malta – – Netherlands -0.09 -0.021 Norway -6.665* -1.076** Poland 21.57 -1.708** Portugal -12.53 -0.349 Romania -12.41** -1.603* Sweden -0.664 -0.179 Slovenia -1.251 -0.116 Slovak Republic -83.30 -0.018 United Kingdom 3.256 0.324
Notes: * means significance at 10% level, ** at 5% level and *** at 1% level. Dependent variable is the log of the per capita output first differences. Variables: V. Mismatch=Vertical Mismatch; SR=Short-run; LR=Long-run.
be attributed essentially to overeducation in the most complete specification and when results are detailed by countries.
The presentation of new and comparable mismatch measures for European countries opens a wide avenue of empirical research on the features of European labour markets and also on the determinants of labour mismatch. The data presented here highlight the low integration of labour markets in Europe and a significant number of workers who are mismatched regard-ing level and field of education. Furthermore, the high level of mismatch in some European countries and the negative effects of mismatch (namely that of overeducation) we found on the short-run evolution of the economy may have policy implications on the design of fund-ing schemes of education in order to avoid public fundfund-ing of overeducation and to adjust the supply of human capital to its demand.
References
[1] Backburn III, E. and Frank, M. (2007). Estimation of nonstationary heterogeneous panels. STATA Journal, 7(2): 197-208.
[2] Biagetti, M. and Scicchitano, S. (2011). Education and Wage Inequality in Europe. Eco-nomics Bulletin, 31(3): 2620-2628.
[3] Budr´ıa, S. and Moro-Egido, A. (2008). Education, educational mismatch, and wage in-equality: Evidence for Spain. Economics of Education Review, 27: 332-341.
[4] Canning, D. and Pedroni, P.(2008). Infrastructure, long-run economic growth and causality tests for cointegrated panels. Manchester School, 76(5): 504–527.
[5] Coelho, H.M., Soares, L.M., and Feliz, M.I.B. (1982). Os N´ıveis de Qualifica¸c˜ao na Con-trata¸c˜ao Colectiva, Sua Aplica¸c˜ao a Algumas Empresas P´ublicas do Sector dos Transportes e Comunica¸c˜oes, Minist´erio do Trabalho.
[6] den Haan, W., Ramey, G. and Watson, J. (2000). Job Destruction and Propagation of Shocks. American Economic Review, 90(3): 482-98.
[7] Engle, R. and Granger, C. (1987). Cointegration and Error Correction: Representations, Estimation and Testing. Econometrica 55(2): 252-276.
[8] EUROSTAT (2012). Labour Force Survey Microdata, supplied by the EUROSTAT under contract LFS/2012/22.
[9] Glocker, D. and Steiner, V. (2011). Returns to Education Across Europe. CEPR Discussion Paper Series No.8568.
[10] Hartog, J. (2000). Over-education and earnings: where are we, where should we go? Economics of Education Review, 19: 131-147.
[11] Leuven, E. and Oosterbeek, H. (2011). Overeducation and Mismatch in the Labor Market. Handbook of the Economics of Education, chapter 3, volume 4: 283-326
[12] Kiker, B.F., and Santos, M.C. (1991). Human capital and earnings in Portugal. Economics of Education Review, 10(3): 187-203.
[13] Kiker, B.F., Santos, M.C., and Mendes de Oliveira, M. (1997). Overeducation and Un-dereducation: Evidence for Portugal. Economics of Education Review, 16 (2): 111-125.
[14] Mauro, L. and Carmeci, G. (2003). Long run growth and investment in education: Does unemployment matter? Journal of Macroeconomics, 25(1): 123-137.
[15] Mendes de Oliveira, M., Santos, M.C., and Kiker, B.F. (2000). The role of human capital and technological change in overeducation. Economics of Education Review, 19: 199-206.
[16] Ordine, P. and Rose, G. (2011). Educational Mismatch and Wait Unemployment. Alma Laurea Working Papers 19.
[17] Pesaran, M.H., and Smith, P. (1995). Estimating long-run relationships from dynamic heterogeneous panels. Journal of Econometrics 68: 79113.
[18] Pesaran, M.H. (2007). A simple panel unit root test in the presence of cross-section dependence. Journal of Applied Econometrics, 22(2): 265–312.
[19] Pesaran, M.H., Shin, Y., and Smith, R. (1999). Pooled mean group estimation of dynamic heterogeneous panels. Journal of the American Statistical Association, 94(446): 621-634.
[20] Sloane, P. (2002). Much ado about nothing? What does the over-education literature really tell us? Keynote address, International Conference on Over-education in Europe.
[21] Robst, J. (2007). Education and job match: The relatedness of college major and work, Economics of Education Review, vol. 26(4),pp. 397-407.
[22] Wolbers, M. (2003). Job Mismatches and their Labour Market Effects among School Leavers in Europe, European Sociological Review, vol.19 (3), pp.249-266.
A
Appendix
A.1
Definitions of the Source Variables
HATLEVEL Definition Years of Schooling
0 No formal education or below ISCED 1 0
10 ISCED 0-1 (pre-primary education) 1
11 ISCED 1 (primary education or first stage of basic education) 5
21 ISCED 2 (Lower secondary education or first stage of basic education) 8
22 ISCED 3 (upper secondary education; access to labour market)-shorter than 2 years 10
31 ISCED 3c (2 years and more) 13
32 ISCED 3a,b (upper secondary education providing access to level 5) 13
30 ISCED 3 (without distinction a,b, or c possible, 2 years +) 13
33 ISCED 3c (3 years or longer) or ISCED 4c 13
34 ISCED 3b or ISCED 4b 13
35 ISCED 3a or ISCED 4a 13
36 ISCED 3 or 4 (without distinction a, b or c possible) 13
41 ISCED 4a, b (post secondary, non-tertiary education giving access to level 5) 14
42 ISCED 4c 14
43 ISCED 4 (without distinction a, b or c possible) 14
51 ISCED 5b (first stage of tertiary education; provides access to an occupation) 17
52 ISCED 5b (first stage of tertiary education theorectically based; provides access to research programmes) 17
60 ISCED 6 (second stage of tertiary education, leading to advanced research qualification) 19
HATFIELD Definition
0 General Programmes
100 Teacher training and education science
200 Humanities, languages and arts
222 Foreign Languages
300 Social sciences, businesses and law
400 Science, mathematics and computing
420 Life sciences (including biology and environmental science)
440 Physical science (including Physics, Chemistry and earth science)
460 Mathematics and statistics
481 Computer science
482 Computer use
500 Engineering, manufacturing and construction
600 Agriculture and veterinary
700 Health and welfare
Economic Activity Definition
A Agriculture, Forestry and Fishing
B Mining and Quarrying
C Manufacturing
D Electricity, Gas and Steam
E Water and Waste
F Construction
G Wholesale and Retail Trade, Repair of Vehicles
H Transportation and Storage
I Accomodation and Food Service
J Information and Communication
K Financial and Insurance
L Real Estate
M Professional, Scientific and Technical
N Administrative and Support Service
O Public Administration and Defense
P Education
Q Human Health and Social Work
R Arts, Entertainment and Recreation
S Other Service Activities
T Households Production U Extraterritorial Activities Occupation Definition 100 Managers 200 Professionals 300 Technicians 400 Clerical
500 Service and Sales workers
600 Agricultural, forestry and fishery workers
700 Craft and related trades
800 Plant and Machine Operators
900 Elementary Occupations
A.2
Number of Observations by Country for HATLEVEL variable
Country Obs. Country Obs. Country Obs. Country Obs. Austria 1288556 France 3087955 Lithuania 341138 Slovak Rep. 672149 Belgium 942070 Germany 1130341 Luxembourg 296124 Slovenia 464774 Bulgaria 531795 Greece 2232709 Malta 52721 Spain 2433548
Cyprus 234948 Hungary 1830379 Netherlands 1293398 Sweden 1647500 Czech Rep. 1342063 Iceland 94197 Norway 351623 Switzerland 491162
Denmark 574749 Ireland 1562564 Poland 1643658 United Kingdom 1435754 Estonia 147989 Italy 3858707 Portugal 1143686
A.3
Number of Observations by Country for HATFIEL variable
Country Obs. Country Obs. Country Obs. Country Obs. Austria 711155 France 1251307 Lithuania 237564 Slovak Rep. 460423 Belgium 322322 Germany 649987 Luxembourg 145196 Slovenia 281122 Bulgaria 281195 Greece 821746 Malta 15973 Spain 306184 Cyprus 141340 Hungary 1043699 Netherlands 614926 Sweden 1139786 Czech Rep. 749145 Iceland 43033 Norway 173987 Switzerland 269252
Denmark 327599 Ireland 431997 Poland 1002464 United Kingdom 477807 Estonia 84242 Italy 1606183 Portugal 221632