1
Fibrous Structures in Augmentation for Rotator Cuff
Repair: An Experimental Comparison
Tânia Peixoto1, Fábio A. M. Pereira1,2, Paula L. Silva1,3, Rui M. Guedes3,4, João Torres5, Maria A. Lopes6,*
1
Universidade de Trás-Os-Montes e Alto Douro, Quinta de Prados 5000-801 Vila Real, Portugal
2
CITAB, Centro de Investigação e de Tecnologias Agroambientais e Biológicas, Quinta de Prados, 5001-801 Vila Real, Portugal
3
INEGI - Instituto de Engenharia Mecânica e Gestão Industrial, Rua Dr. Roberto Frias, 4200-465 Porto, Portugal
4
Departamento de Engenharia Mecânica, Faculdade de Engenharia da Universidade do Porto, 4200-465 Porto, Portugal
5
Faculdade de Medicina da Universidade do Porto, Hospital de São João, Largo Hernâni Monteiro, 4200 Porto, Portugal
6
REQUIMTE-LAQV, Departamento de Engenharia Metalúrgica e Materiais, Faculdade de Engenharia, Universidade do Porto, Rua Dr. Roberto Frias, 4200-465 Porto, Portugal
*Corresponding author: Maria A. Lopes
REQUIMTE-LAQV, Departamento de Engenharia Metalúrgica e Materiais, Faculdade de Engenharia, Universidade do Porto, Rua Dr. Roberto Frias, 4200-465 Porto, Portugal
E-mail address: [email protected] (M. A. Lopes)
3 4 5 6 7 8 9 10 11 12 13 14 15 16 17 18 19 20 21 22 23 24 25 26 27 28 29 30 31 32 33 34 35 36 37 38 39 40 41 42 43 44 45 46 47 48 49 50 51 52 53 54 55 56 57 58 59 60
2
Fibrous Structures in Augmentation for Rotator Cuff
Repair: An Experimental Comparison
Keywords: Rotator Cuff; Warp-Knitting; Scaffold; Augmentation.
Abstract
Background and purpose: Rotator cuff tendon (RCT) injuries are difficult to manage as current strategies do not restore tissue functionality. Driven by this market demand, several devices have been developed during the last years, however, to develop a structure that properly mimics the mechanical performance of the native tissue remains a challenge. This way, in this work we study a set of design criteria for a synthetic graft development for RCT repair and reconstruction, in order to achieve a structure with an adequate mechanical performance to substitute the damaged tissue, and that can also act as a scaffold, allowing and guiding tissue ingrowth.
Materials and Methods: Two three-dimensional (3D) and two planar (2D) warp-knitted structures were developed using polyethylene terephthalate (PET) yarn, and are characterized in terms of their morphology, absorption and wicking behavior, and mechanical properties. Results: The present warp-knitted structures mimic the non-linear mechanical behavior of the native tissue. A less porous planar structure was concluded to be the best to provide mechanical augmentation, as it demonstrated mechanical properties suitable for RCT repair. Pre-tensioning techniques were adequate to increase this type of textile's mechanical properties. Furthermore, the physical properties of this structure can allow and guide tissue ingrowth, demonstrating its potential to act also as a scaffold.
Conclusions: As this is a relatively new field of application of knitting technologies, this work provides important information on how a warp-knitted structure should be tailored and treated post-production, in order to be used for RCT repair.
1. Introduction
The rotator cuff (RC) consists of four muscles (subscapularis, supraspinatus, infraspinatus and teres minor) that end in short, flat, broad tendons, which fuse with the articular capsule of the humerus. This functional anatomical unit is critical for normal shoulder movement and stability [1-3]. Rotator cuff tendon (RCT) injuries are frequent, and often result in pain, substantial tissue morbidity and disability, affecting mainly athletes,
3 4 5 6 7 8 9 10 11 12 13 14 15 16 17 18 19 20 21 22 23 24 25 26 27 28 29 30 31 32 33 34 35 36 37 38 39 40 41 42 43 44 45 46 47 48 49 50 51 52 53 54 55 56 57 58 59 60
3 active workers and the elder population [4,5]. As our society continues to age and remain active, these conditions not only have an impact on people’s quality of life and activities of daily living, but also represent significant economic burden [4,6]. Tendon injuries are difficult to manage and although spontaneous healing can occur, it cannot recapitulate the complex structure, composition, and organization of the native tissue, resulting in scar-like tissue with biochemical and mechanical properties inferior to those of the intact tissue [4,7-9]. Furthermore, standard surgical interventions often fail, as current strategies do not fully restore tissue functionality [4,9].
Driven by this market demand, several biological and synthetic scaffolds have been developed during the last 15 years, some, usually in the form of patches, just to share mechanical loads with the native tissue, providing additional mechanical support to the original repair and others to fully replace the tendon, act as a vehicle for cells and gradually promote the native tissue regeneration [9-13]. However, the major challenge remains to develop a structure that properly mimics the mechanical performance of the native tissue [9,10,13,14]. Although the requirements of scaffolds are multifaceted and specific to the structure and function of the tissue of interest, ideal scaffolds should have good biocompatibility, highly porous and interconnected microstructures, and suitable mechanical support [9,15]. Textile manufacturing techniques have recently attracted great attention as biofabrication tools for engineering tissue constructs. Through suitable combinations of material, fiber type and manufacturing technique, fiber-based scaffolds can be engineered to obtain properties similar to the native tissue and to match critical scaffold criteria [16,17].
In this work, it is proposed a knitting technology to fabricate a tendon graft, using a synthetic polymer, polyethylene terephthalate (PET). PET was chosen as it is used in the field of tendons and ligaments due to its mechanical properties, and because biodegradable materials available FDA approved do not have the mechanical performance needed for the envisaged application [9,18,19]. We studied a set of design criteria for a synthetic graft development for RCT repair and reconstruction, in order to achieve a structure with an adequate mechanical performance to substitute the damage tissue, and that can act also as a scaffold, allowing and guiding tissue ingrowth. For this, two three-dimensional (3D) and two planar (2D) warp-knitted structures were developed and characterized in order to understand the impact of certain design parameters in the overall performance of the structures, if these type of structures have potential to satisfy the necessary requirements for RCT repair, and how they could be tailored to further improve their properties. The knitted constructs obtained
3 4 5 6 7 8 9 10 11 12 13 14 15 16 17 18 19 20 21 22 23 24 25 26 27 28 29 30 31 32 33 34 35 36 37 38 39 40 41 42 43 44 45 46 47 48 49 50 51 52 53 54 55 56 57 58 59 60
4 are described below in terms of their morphology, absorption and wicking behavior, and mechanical properties.
2. Materials and Methods 2.1. Materials
Two 3D (or spacer) warp-knitted structures (A and B) and two planar (2D or conventional) warp-knitted structures (C and D), made of multifilament PET yarn, were evaluated to determine their potential as scaffolds for RCT repair and reconstruction. The 3D fabrics were produced on a double needle-bar machine (LIBA, DG, Germany). They consist on warp-knitted double face constructions, composed by two different face layers, an upper one and an inferior one connected by a spacer yarn, in this case, a PET monofilament, that prevents the crushing of the structure. The 2D fabrics were produced on a single needle-bar machine (LIBA, Racop, Germany). The resulting structures are known as single face fabrics. PET yarns were purchased from Sarla Europe, LDA (Portugal).
2.2. Morphological and surface characterization 2.2.1. Scanning Electronic Microscopy (SEM)
To study the surface characteristics, namely the morphology and fiber organization of the constructs, Scanning Electronic Microscopy analysis was performed (SEM, 1.2. kV, Quanta 400FEG (FEI, USA)). SEM images were taken under 40×, 150× and 500× magnification. Fibers’ diameter and pore size were estimated for each specimen. All samples were coated with gold/palladium using a SPI Sputter Coater to provide conduction.
2.2.2. Porosity
To assess the total porosity of the knitted structures, five specimens of each, measuring 75 mm in length and 25 mm in width, were considered. The thickness of each specimen was measured at four separate points using a digital caliper with an accuracy of ± 0.001 mm, and averaged, to calculate the cross-sectional area and thus, determine a geometrical volume (Vg), considering a parallelepiped composed 100% of PET, and each sample was weighted to determine the solid volume (Vs). For a material, the value of Vs can be obtained from the fraction between the weight (w) of the solid and the density (ρ) of the sample. Porosity can be defined as the difference between the geometric volume (Vg) and the solid Volume (Vs) of the sample (Equation 1). 3 4 5 6 7 8 9 10 11 12 13 14 15 16 17 18 19 20 21 22 23 24 25 26 27 28 29 30 31 32 33 34 35 36 37 38 39 40 41 42 43 44 45 46 47 48 49 50 51 52 53 54 55 56 57 58 59 60
5 𝑃𝑜𝑟𝑜𝑠𝑖𝑡𝑦 = (Vg− Vs)
Vg × 100% (Equation 1) Where,
𝑉𝑔 = (𝜔 × 𝑡) × 𝑙 (Equation 2) Where 𝜔 is the width, 𝑡 the thickness, and l the length of the specimen.
and,
V𝑠 = w
ρPET (Equation 3) Where 𝜌PET = 1,38 g/cm³.
2.3. Absorption tests
2.3.1. Liquid Absorptive capacity test
Our testing protocol was based on the International Standard D570-98, Standard Test Method for “Water Absorption of Plastics”. The absorptive capacity method provides a measure of the amount of liquid held within a test piece after specified times of immersion and drainage. This method measures the liquid stored within the test piece itself after drainage has occurred vertically. For each structure, five specimens were considered, measuring 75 mm in length and 25 mm in width. An analytical balance capable of reading 0.0001 g was used. Dry specimens were weighted (W0), and then were placed in containers of distilled water maintained at room temperature, entirely immersed. The specimens were again weighted after 60 s, 15 min, 30 min, 1 h, 2 h, 4 h, 8 h, 12 h and 24 h immersion (W). The increase in weight during immersion (Equation 4) was calculated in percentage. Any changes in appearance of the specimens were noted.
𝐼𝑛𝑐𝑟𝑒𝑎𝑠𝑒 𝑖𝑛 𝑤𝑒𝑖𝑔ℎ𝑡, % =W−W0
W0 × 100 (Equation 4) Where W0 and W represent the specimens’ weight when dry (before immersion) and after
specific immersion times, respectively.
2.3.2. Liquid Wicking rate test
Liquid wicking rate is defined as the measure of the capillarity of the test material, i.e. the rate at which the liquid is transported into the fabric by capillary action. The capillarity method measures the rate of vertical capillary rise in a specimen strip suspended in the test liquid. As soon as the liquid touches the bottom of the fabric, the capillary forces are generated and this allows the liquid to rise against the gravity. Five specimens of each construct were tested, measuring 200 mm in length and 25 mm in width. The specimens were
3 4 5 6 7 8 9 10 11 12 13 14 15 16 17 18 19 20 21 22 23 24 25 26 27 28 29 30 31 32 33 34 35 36 37 38 39 40 41 42 43 44 45 46 47 48 49 50 51 52 53 54 55 56 57 58 59 60
6 suspended vertically with the bottom end dipped in a reservoir of distilled water with a specific dye. In order to ensure that the bottom ends of the specimens could be immersed vertically at a depth of 30 mm into the water, the bottom end of each specimen was clamped with a clip. The wicking heights were measured after 10 s, 30 s, 60 s and then every minute for 10 min and recorded for a direct evaluation of the structures wicking ability.
2.4. Mechanical Characterization 2.4.1. Tensile testing
The testing protocol was based on the International Standard ISO 13934-1 “Textiles – Tensile Properties of Fabrics: Determination of maximum force and elongation at maximum force using the strip method”. For each structure, eight specimens were cut on the longitudinal direction of the fabric, measuring 140 mm in length and 20 mm in width. Material testing dumbbell shapes were created so these 20 mm strips were 10 mm at their narrowest point. The grip-to-grip gauge length was 40 mm. As it was referenced, the thickness of each specimen was measured at four separate points using a digital caliper with an accuracy of ± 0.001 mm, and averaged. The mean thickness determined for 3D structure A was 2.8 mm, 2.2 mm for 3D structure B and 0.4 mm for 2D structures C and D.
Specimens were tested to failure in tension using a Shimadzu EZ-LX Long-Stroke Model tensile testing machine with a 5 kN load cell, at a rate of 10 mm/min until failure. Paperboard was used to prevent slippage and jaw-breaks. Maximum tensile stress (MPa), Young’s modulus (MPa), breaking strain (%), stiffness (N/mm) and toughness (J/mm3
) were accessed. Our specimen size matched mean values published for RCT dimensions [20], so the measured material properties of the constructs could be compared with published data of human RC. The Young’s modulus was calculated from the steepest pre-yield slope of the stress-strain curve. Stiffness (N/mm) was calculated from the pre-yield slope of the force-elongation curve. Toughness (J/mm3) was calculated as the area under the stress-strain curve to failure of each sample.
Tensile tests in wet conditions were also performed to determine if the mechanical strength of the constructs was affected. Test specimens were immersed for a period of one hour in distilled water, at room temperature and before testing, all surface water was wiped off with a dry cloth, as described in the International Standard ISO 13934-1. The remaining test conditions were the same as described above.
3 4 5 6 7 8 9 10 11 12 13 14 15 16 17 18 19 20 21 22 23 24 25 26 27 28 29 30 31 32 33 34 35 36 37 38 39 40 41 42 43 44 45 46 47 48 49 50 51 52 53 54 55 56 57 58 59 60
7 2.4.2. Cyclic tests
Cyclic tests were performed to provide a more accurate idea of how the structures will perform in vivo, as these structures are under cyclic loads for extended periods of time. The cyclic test enables the estimation of the permanent deformation accumulation process during each loading cycle.
Specimens of the four structures under study were tested and five specimens of each were considered. The specimens had test dimensions of 40 mm in length and 10 mm in width and were tested in load/unload cycles, using the same tensile testing machine of the anteriorly described tests, at a rate of 10 mm/min. All samples were tested under crescent loads, whereas the last load being applied was lower than the maximum failure load of each structure. Two types of tests were performed: first, all specimens were tested at each new cycle maintaining the accumulated deformation from the previous cycle; second, all specimens were tested after removing the accumulated deformation from the previous cycle, i.e. maintaining the initial test length of 40 mm. Young’s modulus (MPa) and stiffness (N/mm) values were determined as described in “2.4.1. Tensile testing”. The deformation energy absorbed (J/mm3) was calculated as the area under the cyclic stress-strain loop of each sample.
2.5. Statistical Analysis
All numerical data are presented as averages and standard deviations. Statistical analysis was performed in order to interpret the results obtained. One way analysis of variance (ANOVA) was used. The comparison between two average values was performed using Tukey’s test with p < 0.05 indicating statistical significance.
3. Results
3.1. Morphological and surface characterization 3.1.1. Scanning Electronic Microscopy (SEM)
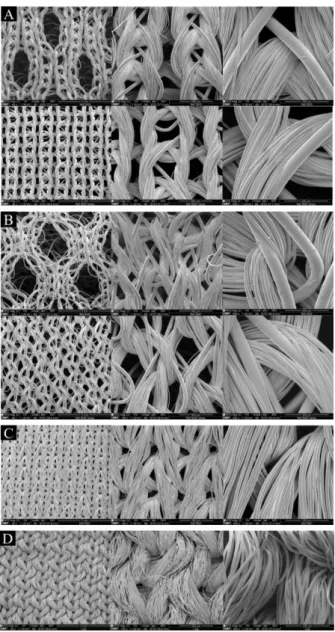
In order to study the surface characteristics, specifically fiber morphology and organization and pore size, SEM images were taken of the four structures (Figure 1). Since constructs A and B are double face constructions, SEM images of both faces were obtained.
All matrices present very regular and well-controlled patterns, with well oriented fibers. All structures were developed using multifilament PET yarns, with 132 ± 5 filaments per yarn, with an average diameter of each filament of 9.5 ± 0.5 μm and 15.0 ± 0.5 μm. This variation was due to differences between yarn lots. Furthermore, the 3D constructions also
3 4 5 6 7 8 9 10 11 12 13 14 15 16 17 18 19 20 21 22 23 24 25 26 27 28 29 30 31 32 33 34 35 36 37 38 39 40 41 42 43 44 45 46 47 48 49 50 51 52 53 54 55 56 57 58 59 60
8 have a PET monofilament, the spacer yarn that connects the two faces, with an average diameter of 56.5 ± 0.8 μm.
Structures A and B present two different types of pores in the upper face layer: one with an oval shape, measuring an average of 919.8 ± 25.3 μm in width and 2220.0 ± 56.9 μm in length and 1450.4 ± 39.1 μm in width and 2220.0 ± 45.5 μm in length, and other circular shaped, with an average diameter of 284.5 ± 37.3 μm and 235.0 ± 25.5 μm, respectively. Their lower face layers are more closed, with structure A presenting a circular shaped pore with a mean diameter of 350.0 ± 27.1 μm and structure B an oval shaped pore measuring 350.0 ± 34.2 μm in width and 470.2 ± 18.8 μm in length. Structure C presents a mean pore size of 85.0 ± 7.6 μm in width and 180.4 ± 21.1 μm in length. Structure D is a more closed structure, presenting a circular shaped pore with an average diameter of 100.0 ± 15.5 μm.
Figure 1. SEM images obtained of the two 3D (A and B) and of the two 2D (C and D) warp-knitted structures under 40×, 150× and 500× magnification.
3 4 5 6 7 8 9 10 11 12 13 14 15 16 17 18 19 20 21 22 23 24 25 26 27 28 29 30 31 32 33 34 35 36 37 38 39 40 41 42 43 44 45 46 47 48 49 50 51 52 53 54 55 56 57 58 59 60
9
3.1.2. Porosity
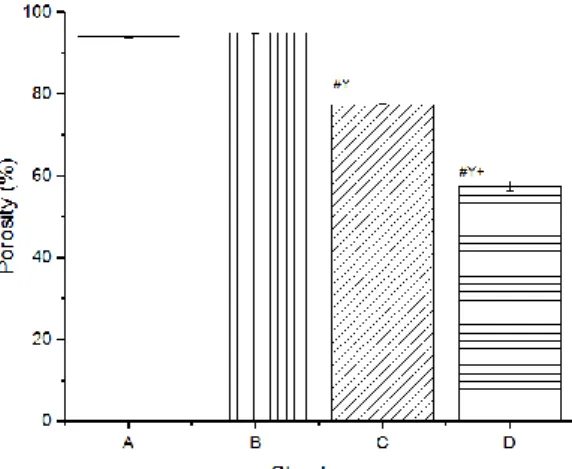
Figure 2 displays the porosity levels determined for all structures under study. Both 3D structures A and B presented a high porosity (94.0 ± 0.1% and 95.0 ± 0.1%, respectively), 2D structure C presented a relatively high porosity (77.5 ± 0.2%), and finally 2D structure D showed the lowest porosity compared with the previous (57.5 ± 1.2%). Both 3D warp-knitted structures showed the highest porosity level, as it was expected, not only because these structures have bigger pores in comparison with the planar ones, but also due to the empty spaces that emerge from the union of both faces. Structure C also demonstrated a reasonable high porosity level, which was also perceptible by observing the SEM images. Although structure D appeared to be a more closed construct, these results showed that this structure presents a medium porosity level.
Figure 2. Porosity levels of the 3D (A and B) and 2D (C and D) structures under study. Significant difference compared to A (#), B (Y), C (+), p < 0.0001.
3.2. Absorption tests
3.2.1. Liquid Absorptive capacity test
Figure 3 shows the increase in weight (%) in specific times, for all structures under study. For all structures, there was an increase in weight, indicating water uptake, in the first 60 seconds. After that time, it remained constant, which means that the equilibrium water uptake of the polymeric scaffold specimens (when all the pores were assumed to be filled with water) was reached. The structures that reveal the highest increase in weight were the 3D structures A and B, with an increase of 262.0 ± 18.6% and 282.0 ± 18.2%, respectively. Regarding the 2D constructs, structure C suffered an increase in weight of about 164.2 ± 7.2% and finally, structure D revealed the lowest increase, of about 138.1 ± 2.2%.
3 4 5 6 7 8 9 10 11 12 13 14 15 16 17 18 19 20 21 22 23 24 25 26 27 28 29 30 31 32 33 34 35 36 37 38 39 40 41 42 43 44 45 46 47 48 49 50 51 52 53 54 55 56 57 58 59 60
10
Figure 3. Relationship between the weight change of the two 3D warp-knitted structures (A and B) and the two 2D warp-knitted structures (C and D) and the immersion time in water. Data are presented as mean ± SD.
3.2.2. Liquid Wicking rate test
Figure 4 shows the vertical wicking results obtained for the four constructs under study. The rate of water rise through the capillaries was found to be higher for the initial period and thereafter it slowed down gradually to reach a saturation level. In the first minute, the wicking height of structure C was higher than the wicking height of the structures A, B and D, which in turn, exhibited a similar behavior. After that, the wicking height of structure D was higher than the others, reaching an average final height of 10.6 ± 0.1 cm. The second highest wicking height was reached by structure A, with an average of 10.1 ± 0.4 cm, followed by structure C, with an average wicking height of 9.3 ± 0.4 cm, and finally structure B, with an average of 8.6 ± 0.1 cm. A steady state was obtained for all structures at about 8 minutes within the test. This can be due to the overweight of water and the dominance of gravity effect as the water rose.
Figure 4. Relationship between the wicking behavior of the two 3D warp-knitted structures (A and B) and the two 2D warp-knitted structures (C and D) over time. Data are presented as mean ± SD.
3 4 5 6 7 8 9 10 11 12 13 14 15 16 17 18 19 20 21 22 23 24 25 26 27 28 29 30 31 32 33 34 35 36 37 38 39 40 41 42 43 44 45 46 47 48 49 50 51 52 53 54 55 56 57 58 59 60
11 3.3. Mechanical Characterization
3.3.1. Tensile testing
The force-elongation and stress-strain typical curves obtained for each structure, in both dry and wet test conditions, are represented in Figure 5. The variations in the tensile properties of the different structures under study are reported in Table 1 and represented in Figure 6.
(a)
(b)
Figure 5. Force (N) / Elongation (mm) and Stress (MPa) / Strain (%) representative curves of the 3D (A and B) and the 2D (C and D) warp-knitted structures under study, under (a) dry conditions and (b) wet conditions.
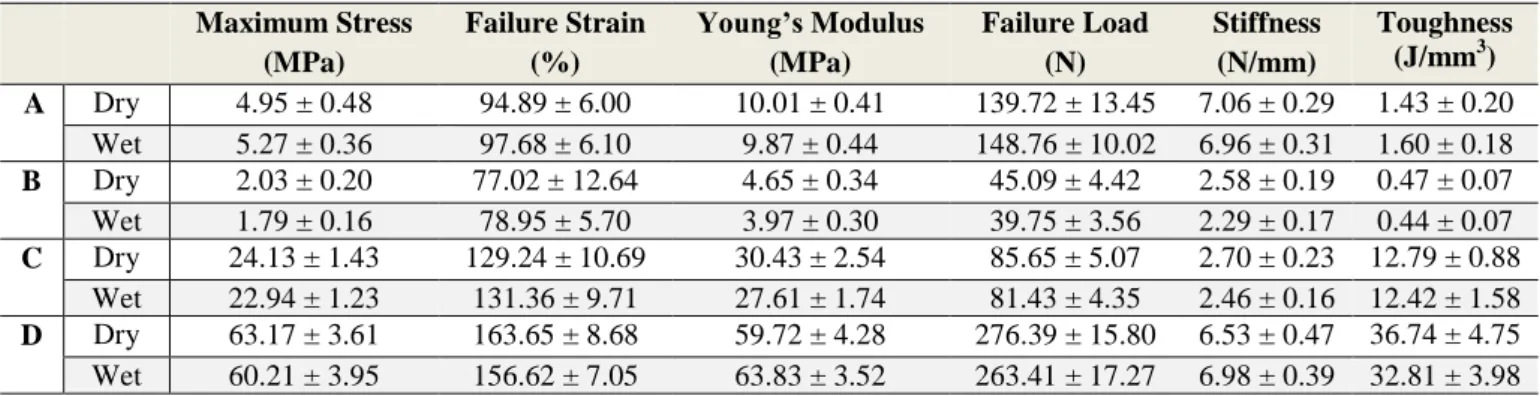
Table 1. Estimated values of the mechanical parameters under study, of the 3D (A and B) and 2D (C and D) structures developed, under dry and wet conditions. Data are presented as mean ± SD.
Maximum Stress (MPa) Failure Strain (%) Young’s Modulus (MPa) Failure Load (N) Stiffness (N/mm) Toughness (J/mm3) A Dry 4.95 ± 0.48 94.89 ± 6.00 10.01 ± 0.41 139.72 ± 13.45 7.06 ± 0.29 1.43 ± 0.20 Wet 5.27 ± 0.36 97.68 ± 6.10 9.87 ± 0.44 148.76 ± 10.02 6.96 ± 0.31 1.60 ± 0.18 B Dry 2.03 ± 0.20 77.02 ± 12.64 4.65 ± 0.34 45.09 ± 4.42 2.58 ± 0.19 0.47 ± 0.07 Wet 1.79 ± 0.16 78.95 ± 5.70 3.97 ± 0.30 39.75 ± 3.56 2.29 ± 0.17 0.44 ± 0.07 C Dry 24.13 ± 1.43 129.24 ± 10.69 30.43 ± 2.54 85.65 ± 5.07 2.70 ± 0.23 12.79 ± 0.88 Wet 22.94 ± 1.23 131.36 ± 9.71 27.61 ± 1.74 81.43 ± 4.35 2.46 ± 0.16 12.42 ± 1.58 D Dry 63.17 ± 3.61 163.65 ± 8.68 59.72 ± 4.28 276.39 ± 15.80 6.53 ± 0.47 36.74 ± 4.75 Wet 60.21 ± 3.95 156.62 ± 7.05 63.83 ± 3.52 263.41 ± 17.27 6.98 ± 0.39 32.81 ± 3.98 3 4 5 6 7 8 9 10 11 12 13 14 15 16 17 18 19 20 21 22 23 24 25 26 27 28 29 30 31 32 33 34 35 36 37 38 39 40 41 42 43 44 45 46 47 48 49 50 51 52 53 54 55 56 57 58 59 60
12 As there were no significant statistical differences between the dry and wet tensile tests for all parameters under study, only dry conditions were considered for further tests.
All four matrices required 10% to 35% elongation until they began to carry substantial load. In general, the maximum stress, failure strain, Young’s modulus, and toughness values, were higher for the 2D structures, in particular for structure D. Both 3D warp-knitted structure A and 2D warp-knitted structure D presented the highest failure load and stiffness values, in comparison with the others.
(a) (b)
(c) (d)
(e) (f)
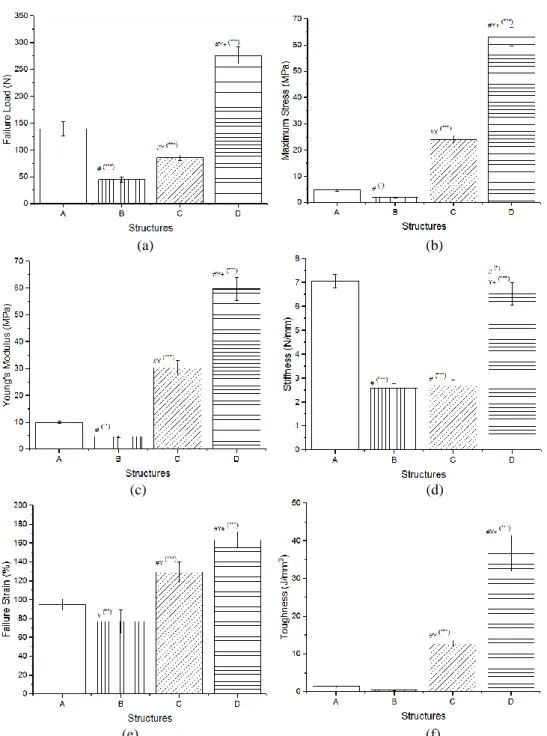
Figure 6. Mechanical parameters under study of the 3D (A and B) and the 2D (C and D) constructs: (a) Failure load (N); (b) Maximum Stress (MPa); (c) Young’s Modulus (MPa); (d) Stiffness (N/mm); (e) Failure Strain (%);
(f) Toughness (J/mm3). Significant difference compared to A (#), B (Y), C (+), with (*) p < 0.05, (**) p < 0.01 and (***) p < 0.0001. 3 4 5 6 7 8 9 10 11 12 13 14 15 16 17 18 19 20 21 22 23 24 25 26 27 28 29 30 31 32 33 34 35 36 37 38 39 40 41 42 43 44 45 46 47 48 49 50 51 52 53 54 55 56 57 58 59 60
13
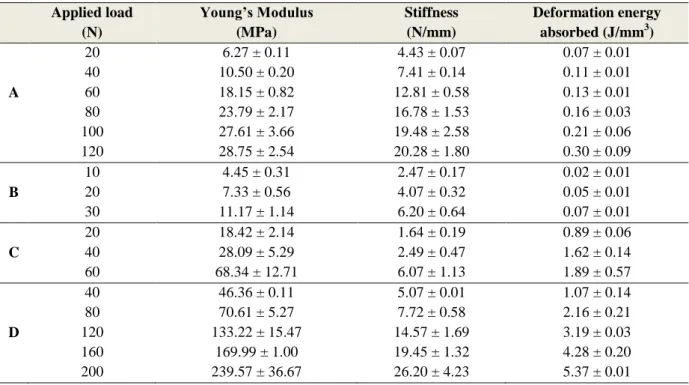
3.3.2. Cyclic tests
In this section, it is reported the results obtained from the cyclic tests, namely the Young’s modulus (MPa), stiffness (N/mm) and deformation energy absorbed (J/mm3
) variations under different loads (Table 2), for all structures. The force-elongation typical curves obtained for each structure, in both test conditions, are presented in Figure 7.
For each parameter under study, there were no differences between the values measured in both test conditions, for each structure. As it is visible in Figure 7 (a), under cyclic loading, the structures never regained their original shape and despite a small recovery, they suffered increasing deformations at each cycle. In Figure 7 (b), it is visible that the initial portion of each curve decreased with increasing loads, meaning that at each cycle, the amount of necessary elongation until the structures began to carry substantial load decreased. As it can be seen from the values listed in Table 2, the Young’s modulus and stiffness values increased with increasing load, for all structures. Comparing the values obtained from the first and the last cycle, 3D structure A suffered an increase of ~170% in the Young’s modulus and stiffness values, 3D structure B suffered an increase of ~150%, 2D structure C suffered an increase of ~143%, while 2D structure D verified an increase of ~240%. In general, the area of the hysteresis loop also increased with the load applied.
Table 2. Measurements obtained from the cyclic tests of the 3D (A and B) and the 2D (C and D) warp-knitted structures under study. Data are presented as mean ± SD.
Applied load (N) Young’s Modulus (MPa) Stiffness (N/mm) Deformation energy absorbed (J/mm3) A 20 40 60 80 100 120 6.27 ± 0.11 10.50 ± 0.20 18.15 ± 0.82 23.79 ± 2.17 27.61 ± 3.66 28.75 ± 2.54 4.43 ± 0.07 7.41 ± 0.14 12.81 ± 0.58 16.78 ± 1.53 19.48 ± 2.58 20.28 ± 1.80 0.07 ± 0.01 0.11 ± 0.01 0.13 ± 0.01 0.16 ± 0.03 0.21 ± 0.06 0.30 ± 0.09 B 10 20 30 4.45 ± 0.31 7.33 ± 0.56 11.17 ± 1.14 2.47 ± 0.17 4.07 ± 0.32 6.20 ± 0.64 0.02 ± 0.01 0.05 ± 0.01 0.07 ± 0.01 C 20 40 60 18.42 ± 2.14 28.09 ± 5.29 68.34 ± 12.71 1.64 ± 0.19 2.49 ± 0.47 6.07 ± 1.13 0.89 ± 0.06 1.62 ± 0.14 1.89 ± 0.57 D 40 80 120 160 200 46.36 ± 0.11 70.61 ± 5.27 133.22 ± 15.47 169.99 ± 1.00 239.57 ± 36.67 5.07 ± 0.01 7.72 ± 0.58 14.57 ± 1.69 19.45 ± 1.32 26.20 ± 4.23 1.07 ± 0.14 2.16 ± 0.21 3.19 ± 0.03 4.28 ± 0.20 5.37 ± 0.01 3 4 5 6 7 8 9 10 11 12 13 14 15 16 17 18 19 20 21 22 23 24 25 26 27 28 29 30 31 32 33 34 35 36 37 38 39 40 41 42 43 44 45 46 47 48 49 50 51 52 53 54 55 56 57 58 59 60
14
(a) (b)
Figure 7. Force (N) / Elongation (mm) representative curves obtained from the cyclic tests of the 3D (A and B) and 2D (C and D) structures under study, in which in (a) the test was continuous, while in (b) the specimen
length was readjusted at each cycle to maintain the initial length of 40 mm.
3 4 5 6 7 8 9 10 11 12 13 14 15 16 17 18 19 20 21 22 23 24 25 26 27 28 29 30 31 32 33 34 35 36 37 38 39 40 41 42 43 44 45 46 47 48 49 50 51 52 53 54 55 56 57 58 59 60
15 4. Discussion
Warp-knitted fabrics possess highly ordered loop structures arranged vertically, with uniform and regular pore sizes, enhanced porosity/volume and versatile mechanical properties, providing sufficient internal connective space for tissue ingrowth [15]. Furthermore, it can be manipulated by the surgeon, i.e., can be cut and adapted in size, without unravel, thus enabling the surgeon to adapt the scaffold to the patient needs, which overcomes this limitation of existing devices. For these reasons, this type of textile was chosen for the development of the synthetic graft for RCT repair and reconstruction.
Our main goal was to develop a structure that properly mimics the mechanical performance of the native tissue. This way, the construct could not be too porous, or its mechanical strength could be compromised. As we wanted to test different pore dimensions, the 3D structures, A and B, were developed with two different faces, an upper one with larger pores, and a lower one more compact, to provide mechanical strength to the construct. The two 2D structures, C and D, were also developed with different pore dimensions, being structure D more compact than structure C. Also, multifilament yarn was chosen as the base filament for the structures development as studies show that multifilament scaffolds have enhanced mechanical properties, as they are generally stronger, afford greater tensile strength, and have better elastic recovery than monofilament scaffolds. These properties are likely a result of load sharing between the numerous filaments within the structure [21]. Due to the characteristics of the manufacturing process, it was used monofilament yarn for the connection of the two face layers in the 3D structures to ensure that the spacer yarn lied correctly inside the knitted fabric.
Warp-knitted constructs, like the native tendons, exhibit anisotropic properties, i.e. higher mechanical properties in the direction in which the fibers are arranged, and it is in this direction that these fabrics are meant to be cut and implanted. For this reason, all tests, including tensile tests, were performed in the longitudinal direction of the knitted matrix.
Due to PET’s level of hydrophobicity, the structures’ absorption capacity is related to porosity. Porous materials can uptake and store more water whereas nonporous materials can store a more limited amount of water, which was proved when comparing with the porosity results, since the structures that have the highest porosity, the 3D structures, showed the highest water uptake, while the 2D structures, with the lowest porosity, showed a lower water uptake capacity. However, besides the observed increase in weight of all structures, the mechanical properties did not change with wet conditions, which was expected due the level of hydrophobicity of the fiber present in the structures. This factor also greatly influences the
3 4 5 6 7 8 9 10 11 12 13 14 15 16 17 18 19 20 21 22 23 24 25 26 27 28 29 30 31 32 33 34 35 36 37 38 39 40 41 42 43 44 45 46 47 48 49 50 51 52 53 54 55 56 57 58 59 60
16 wicking behavior of the structures, as hydrophobic fibers show less affinity for the water, increasing the wicking rate. The use of multifilament yarn, along with small, uniformly distributed and interconnected pores in the fabric structure is found to be effective in faster wicking [22], as it was observed in the results.
The mechanical properties obtained of the 2D warp-knitted structures were, in general, better than for the 3D warp-knitted structures. When analyzing the relationship between the thickness of the structures (higher for the 3D constructs) and mechanical properties, it was concluded that these parameters were, in general, inversely correlated. However, these results were also influenced by the fact that the 3D warp-knitted structures possess higher porosity levels in comparison with the 2D structures. Porosity and mechanical strength are inter-related parameters for fiber-based scaffolds. It has been shown that a decrease in the porosity of a fibrous scaffold is associated with an increase in mechanical strength [23], what is observable in the obtained results.
The mechanical properties of engineered tissue constructs should exhibit stress–strain responses comparable to the tissues they are intended to replace [24]. As it is observed in Figure 5, the stress–strain behavior of the four structures displayed the characteristic toe, linear, yield and failure regions that are typically found in stress-strain curves of tendons. The examination of the stress-strain characteristics showed a two-stage deformation process [25]. In a first stage, the deformation of the knitted fabric is mainly due to the straightening of the yarns. This initial deformation is due to slippage with friction of the fibers in the interlacing regions, and it is ruled by Coulombs' law. This phenomenon depends on the friction coefficient and the normal force acting in the slippage direction between the fibers. At this point the fibers have not yet been permanently deformed. From the mechanical point of view, in this initial stage of deformation, the fabric behaves like a structure. In the second stage, the load in transferred directly to the yarn. Once the structure becomes blocked, the fibers begin to deform by the force applied (the length of the fibers increases according to Hooke's law). From the mechanical point of view, in this second stage of deformation, the fabric behaves like a continuous material. In order to understand the effect of this behavior on the performance of the structures under study, cyclic tests were performed.
In cyclic testing, despite a visible elastic recovery after the unloading phase, the structures never regained their original shape, even under small loads, which means that they undergo permanent deformations. When the load was removed, a part of the deformation disappeared (residual elastic deformation), and a part remained as a permanent deformation that cannot be recovered. Also, as it is noticeable in Figure 7 (a), these structures suffered
3 4 5 6 7 8 9 10 11 12 13 14 15 16 17 18 19 20 21 22 23 24 25 26 27 28 29 30 31 32 33 34 35 36 37 38 39 40 41 42 43 44 45 46 47 48 49 50 51 52 53 54 55 56 57 58 59 60
17 increasing deformations at each cycle. It was noted the fabrics laxity increased with increasing load, meaning that the permanent deformation was higher that the elastic recovery, and at each cycle, the fabric got more loose.
Also, similarly with what is observed in tendons, these structures suffered a significant amount of hysteresis. This means that the polymer exhibits viscoelastic properties, i.e. involves both elastic and viscous components, which at normal loading and unloading rates leads to hysteresis. The unloading curve does not follow the respective loading curve and the area enclosed by the loading and unloading paths represents the energy dissipated during the deformation and recovery phases, which is not stored as potential energy and thus, it is not available to return the body to its original (unstressed) dimension once the applied stress is removed [26]. In all of our structures, the area of the hysteresis loop increased with the load applied, meaning that at each cycle, the amount of energy dissipated was higher, hence the fact that our structures suffered increasing deformations. However, as stated, there was a residual recovery, which means that not all the energy is dissipated and there is a small amount used for this small structural recovery.
With the tensile tests, it was verified that the constructs under study have great elasticity, as it is typical of a warp-knitted structure due to its conformation. Under load, these structures suffered large deformations. Also, it was noticeable that all four matrices required a significant amount of elongation until they began to carry substantial load, which corresponds to the initial behavior of the loop structure changing shape to accommodate the load applied. In cyclic testing, throughout the cycles, the structures became stiffer, lost some elasticity, meaning that the resistance to deformation increased, which resulted in smaller elongations at each cycle. As it is visible in Figure 7 (b), it was found that the initial structural behavior decreased with increasing loads. Although a small structural effect of the fabric still exists, as it is noticeable in the initial region of the last curve, at each cycle, the structures became more rigid, until a point that the mechanical response was basically taken only upon the yarns (they began to carry substantial load almost immediately). When the maximum simple readjustment of shape has been made, sideways compression of the yarns in adjacent loops and bending into high curvatures cause the load to rise rapidly. Finally the load is transferred more directly to tension along the yarn axis [27].
Aurora et al [14] proved that it is important to employ scaffolds with tendon-like properties to improve the biomechanics of rotator cuff repairs. Therefore, when developing a synthetic graft for tendon repair, it has to be taken into account that it should match the mechanical properties of the pre-damaged tissue for optimal function [28]. Tendons response
3 4 5 6 7 8 9 10 11 12 13 14 15 16 17 18 19 20 21 22 23 24 25 26 27 28 29 30 31 32 33 34 35 36 37 38 39 40 41 42 43 44 45 46 47 48 49 50 51 52 53 54 55 56 57 58 59 60
18 to load is non-linear and anisotropic, presenting a viscoelastic behavior, due to the viscous properties of the collagen fibers and ground substance [9, 28]. This way, through this analysis, we concluded that the highly ordered loop patterns of the warp-knitted structures indeed mimic the native tissue non-linear mechanical behavior.
Reduced mechanical properties have been demonstrated in torn RCT, encouraging the augmentation of repairs with scaffolds to provide adequate mechanical support [7]. The scaffold should be capable of shielding the native tissue from stress generated during functional excise, providing mechanical support to allow the biologic repair to proceed without experiencing excessive and disruptive loads. Thus, the strength of the device should be similar to the tissue itself, therefore ensuring that the device will not fail under normal loads. The device should also have stiffness that allows for substantial load sharing, providing reinforcement and at the same time ensuring that some load will be applied across the repair site, required for optimal biologic repair [29,30].
Stress at failure has been reported as 11.5 ± 5 MPa, based on a study of 8 supraspinatus tendons, and as 16.5 ± 7.1 MPa, based on a study of 11 cadavers, whereas a lower estimate of 8 MPa was also measured in other report [7]. The 2D warp-knitted structures C and D have greater maximum stress values compared with a range of published values for human supraspinatus tendons.
The ultimate load for human supraspinatus tendon strips has been previously reported at 88 to 411N, according to the location, and the sum of the ultimate load of all strips, which is an estimation of the ultimate load of the whole tendon, averaged 800 N. However, taking into account the human supraspinatus tendon usually functions at only 25% to 30% of its ultimate tensile strength [7], it can be consider that all structures demonstrate sufficient tensile strength, since all structures demonstrated to have an ultimate load superior than 30% of the previously reported range for human RCT strips. The structure that exhibit the maximum load failure value was D (~ 270 N), which was more than 30% of the estimated ultimate load of the whole tendon.
Scaffolds for RCT repair should aim to approximate the Young’s modulus (50-170 MPa) [7] and stiffness (~ 200 N/mm) of human RCT [10]. In the obtained test results, stiffness values are far from the reference value. However, as it was shown earlier, in cyclic testing, if the structure is pre-tensioned, both Young’s modulus and stiffness values increase. Given our cyclic tests results and as stated by Camino et al [25], to increase the stiffness of knitted fabrics, pre-tensioning techniques are required. Also, apart from the higher Young’s modulus values seen for structure D, only structure C showed a potential adequate Young’s
3 4 5 6 7 8 9 10 11 12 13 14 15 16 17 18 19 20 21 22 23 24 25 26 27 28 29 30 31 32 33 34 35 36 37 38 39 40 41 42 43 44 45 46 47 48 49 50 51 52 53 54 55 56 57 58 59 60
19 modulus if pre-tensioned. No published human RCT toughness values are available for comparison with our measured values.
Human tendon failure strain values have been reported between 1.11% and 4.87% [7]. The structures under study demonstrated high failure strain values, with a considerable part of that deformation corresponding to the initial structural behavior. However, as it was stated during the report of cyclic testing, it was found that this initial deformation decreased significantly throughout the cycles. This is important as scaffold devices should be designed with a short initial toe region to match RC properties [30]. This way, pre-tensioning techniques were revealed to be adequate not only to decrease the structures’ prolonged toe region, but also because they could potentially decrease some of the reported failure strain.
Indeed, structure D would be the best to provide mechanical augmentation, as it mimics both the non-linearity and the mechanical properties of the native tissue. These results, in concordance with the works of Aurora et al. and Sahoo et al. [31, 32], also indicate the importance of performing a laboratorial preconditioning of the developed structure before implantation. Furthermore, after surgical repair, tendons are subjected to cyclic loads during healing and the subsequent rehabilitation. This way, it is expected that the device’s mechanical performance will become more stabilized and repeatable after implantation.
We also explored the possibility of the fibrous structures being used also as scaffolds, by providing physical and spatial cues to allow and guide tissue ingrowth. The fiber material, morphology of the scaffold (fiber type, diameter and alignment, pore size and total porosity), and the interactions between the fibers play critical roles in the proper function of the engineered scaffolds [23]. Cells tend to orientate and elongate themselves along the alignment of the fibers, depositing ECM components in that direction, so the directions of alignment of the ECM and the scaffold fibers should be the same [10,23]. Also, studies show that cells are able to organize around and grow mostly aligned along the axis of small diameter fibers, this way the type of filament used in the present structures provides a larger cell-material contact surface area [17,21,23]. Besides, the pore size of the knitted fabric should be at least ~ 100 μm to allow cellular ingrowth [17], and between 100–150 μm to provide the necessary space for neovascularization in vivo is [33,34], criteria that all structures attended. The constructs’ high porosity level and adequate water uptake and wicking behavior would also facilitate not only cellular recruitment, internalization and migration, but the diffusion and transport of nutrients, oxygen and metabolic waste along the structure, and the rate of angiogenesis, thus improving the healing rate of the tissue [16, 35-37]. However, biological in vitro and in vivo characterization is required to validate these results. Due to PET’s level of hydrophobicity,
3 4 5 6 7 8 9 10 11 12 13 14 15 16 17 18 19 20 21 22 23 24 25 26 27 28 29 30 31 32 33 34 35 36 37 38 39 40 41 42 43 44 45 46 47 48 49 50 51 52 53 54 55 56 57 58 59 60
20 surface modification techniques can be applied to further enhance cell-biomaterial interactions, optimizing the intrinsic healing of the native tissue [38].
5. Conclusions
In this work, we studied a set of design criteria for a synthetic graft development for RCT repair. We successfully achieved a structure that demonstrated an adequate mechanical performance to substitute the damaged tissue, which was our main goal. The physical properties of this structure can allow and guide tissue ingrowth, demonstrating its potential to act also as a scaffold.
As this is a relatively new field of application of knitting technologies, this work provides important information on how a warp-knitted structure should be tailored and treated post-production to increase its properties, in order to be used as scaffold for RCT repair.
Acknowledgements
Support for this work was provided by FEDER under Program PT2020 (project UID/QUI/50006/2013-POCI/01/0145/FEDER/007265), by FEDER/COMPETE/POCI, under Project POCI-01-0145-FEDER-006958 and National Funds by FCT, under the project UID/AGR/04033/2013. Authors also acknowledge the contribution of CITEVE (Centro Tecnológico das Industrias Têxtil e do Vestuário de Portugal) and LMA (Leandro Manuel Araújo, Lda).
References
[1] Brand, R. A. (2008). Surgical Anatomy of the Rotator Cuff and the Natural History of Degenerative Periarthritis. Clinical Orthopaedics and Related Research, 466(3), 543-551. doi: 10.1007/s11999007-0103-5
[2] Opsha, O., Malik, A., Baltazar, R., Primakov, D., Beltran, S., Miller, T. T., & Beltran, J. (2008). MRI of the rotator cuff and internal derangement. European journal of radiology, 68(1), 36-56. doi: 10.1016/j.ejrad.2008.02.018
[3] Karas, V., Wang, V. M., Dhawan, A., & Cole, B. J. (2011). Biomechanical factors in rotator cuff pathology. Sports medicine and arthroscopy review, 19(3), 202-206. doi: 10.1097/JSA.0b013e318225cc99
[4] Docheva, D., Müller, S. A., Majewski, M., & Evans, C. H. (2015). Biologics for tendon repair. Advanced drug delivery reviews, 84, 222-239. doi: 10.1016/j.addr.2014.11.015
3 4 5 6 7 8 9 10 11 12 13 14 15 16 17 18 19 20 21 22 23 24 25 26 27 28 29 30 31 32 33 34 35 36 37 38 39 40 41 42 43 44 45 46 47 48 49 50 51 52 53 54 55 56 57 58 59 60
21 [5] Wani, Z., Abdulla, M., Habeebullah, A., & Kalogriantis, S. (2016). Rotator cuff tears: Review of epidemiology, clinical assessment and operative treatment. Trauma, 18(3), 190204. doi: 10.1177/1460408615596770
[6] Mather, R. C., Koenig, L., Acevedo, D., Dall, T. M., Gallo, P., Romeo, A., ... & Williams Jr, G. (2013). The societal and economic value of rotator cuff repair. The Journal of bone and joint surgery. American volume, 95(22), 1993-200. doi: 10.2106/JBJS.L.01495
[7] Chaudhury, S., Holland, C., Thompson, M. S., Vollrath, F., & Carr, A. J. (2012). Tensile and shear mechanical properties of rotator cuff repair patches. Journal of shoulder and elbow surgery, 21(9), 1168-1176. doi: 10.1016/j.jse.2011.08.045
[8] Lee, N., Erisken, C., Iskratsch, T., Sheetz, M., Levine, W. N., & Lu, H. H. (2017). Polymer fiberbased models of connective tissue repair and healing. Biomaterials, 112, 303312. doi: 10.1016/j.biomaterials.2016.10.013
[9] Morais, D. S., Torres, J., Guedes, R. M., & Lopes, M. A. (2015). Current approaches and future trends to promote tendon repair. Annals of biomedical engineering, 43(9), 20252035. doi: 10.1007/s10439-0151369-5
[10] Chainani, A., & Little, D. (2016). Current status of tissue-engineered scaffolds for rotator cuff repair. Techniques in Orthopaedics, 31(2), 91-97. doi:10.1097/BTO.0000000000000168 [11] Rodrigues, M. T., Reis, R. L., & Gomes, M. E. (2013). Engineering tendon and ligament tissues: present developments towards successful clinical products. Journal of tissue engineering and regenerative medicine, 7(9), 673-686. doi: 10.1002/term.1459
[12] Ricchetti, E. T., Aurora, A., Iannotti, J. P., & Derwin, K. A. (2012). Scaffold devices for rotator cuff repair. Journal of shoulder and elbow surgery, 21(2), 251-265. doi: 10.1016/j.jse.2011.10.003
[13] Amini, M. H., Ricchetti, E. T., Iannotti, J. P., & Derwin, K. A. (2017). An Update on Scaffold Devices for Rotator Cuff Repair. Techniques in Shoulder & Elbow Surgery, 18(3), 101-112. doi: 10.1097/BTE.0000000000000122
[14] Aurora, A., McCarron, J. A., van den Bogert, A. J., Gatica, J. E., Iannotti, J. P., & Derwin, K. A. (2012). The biomechanical role of scaffolds in augmented rotator cuff tendon repairs. Journal of shoulder and elbow surgery, 21(8), 1064-1071. doi: 10.1016/j.jse.2011.05.014
[15] Wang, X., Han, C., Hu, X., Sun, H., You, C., Gao, C., & Haiyang, Y. (2011). Applications of knitted mesh fabrication techniques to scaffolds for tissue engineering and regenerative medicine. Journal of the mechanical behavior of biomedical materials, 4(7), 922- 932. doi: 10.1016/j.jmbbm.2011.04.009 3 4 5 6 7 8 9 10 11 12 13 14 15 16 17 18 19 20 21 22 23 24 25 26 27 28 29 30 31 32 33 34 35 36 37 38 39 40 41 42 43 44 45 46 47 48 49 50 51 52 53 54 55 56 57 58 59 60
22 [16] Aibibu, D., Hild, M., Wöltje, M., & Cherif, C. (2016). Textile cell-free scaffolds for in situ tissue engineering applications. Journal of Materials Science: Materials in Medicine, 27(3):63. doi: 10.1007/s10856015-5656-3
[17] Akbari, M., Tamayol, A., Bagherifard, S., Serex, L., Mostafalu, P., Faramarzi, N., & Khademhosseini, A. (2016). Textile technologies and tissue engineering: a path toward organ weaving. Advanced healthcare materials, 5(7), 751-766. doi: 10.1002/adhm.20150051
[18] Longo, U. G., Lamberti, A., Maffulli, N., & Denaro, V. (2010). Tendon augmentation grafts: a systematic review. British medical bulletin, 94(1), 165-188. doi: 10.1093/bmb/ldp051
[19] Maitz, M. F. (2015). Applications of synthetic polymers in clinical medicine. Biosurface and Biotribology, 1(3), 161-176. doi: 10.1016/j.bsbt.2015.08.002
[20] Itoi, E., Hsu, H. C., Carmichael, S. W., Morrey, B. F., & An, K. N. (1995). Morphology of the torn rotator cuff. Journal of anatomy, 186 (Pt2), 429, www.ncbi.nlm.nih.gov/pmc/articles/PMC1167203/pdf/janat00133-0185.pdf
[21] Edwards, S. L., & Werkmeister, J. A. (2012). Mechanical evaluation and cell response of woven polyetheretherketone scaffolds. Journal of Biomedical Materials Research Part A, 100(12), 3326-3331. doi: 10.1002/jbm.a.34286
[22] Kumar, B., & Das, A. (2014). Vertical wicking behavior of knitted fabrics. Fibers and Polymers, 15(3), 625-631. doi: 10.1007/s12221-014-0625-x
[23] Kun, M., Chan, C., & Ramakrishna, S. (2009). Textile-based scaffolds for tissue engineering. Advanced textiles for wound care. Cambridge: Woodhead Publishing in Textiles, 85, 289-321. doi: 10.1533/9781845696306.2.289
[24] Courtney, T., Sacks, M. S., Stankus, J., Guan, J., & Wagner, W. R. (2006). Design and analysis of tissue engineering scaffolds that mimic soft tissue mechanical anisotropy. Biomaterials, 27(19), 3631-3638. doi: 10.1016/j.biomaterials.2006.02.024
[25] Camino, G., Duquesne, S. & Magniez, C. (2007). Multifunctional Barriers for Flexible Structure: Textile, Leather and Paper. Springer, pp.159-160. doi: 10.1007/978-3-54071920- 5_9
[26] Özkaya, N., Leger, D., Goldsheyder, D., & Nordin, M. (2017). Mechanical properties of biological tissues. In Fundamentals of Biomechanics (pp. 361-387). Springer International Publishing. doi: 10.1007/978-3-319-44738-4_15
[27] Hurd, J. C. H., & Doyle, P. J. (1953). Fundamental aspects of the design of knitted fabrics. Journal of the Textile Institute Proceedings, 44(8), P561-P578. doi:10.1080/19447015308687861 3 4 5 6 7 8 9 10 11 12 13 14 15 16 17 18 19 20 21 22 23 24 25 26 27 28 29 30 31 32 33 34 35 36 37 38 39 40 41 42 43 44 45 46 47 48 49 50 51 52 53 54 55 56 57 58 59 60
23 [28] Duenwald, S. E., Vanderby, R., & Lakes, R. S. (2009). Viscoelastic relaxation and recovery of tendon. Annals of biomedical engineering, 37(6), 1131-1140. doi: 10.1007/s10439-009-9687-0
[29] Chen, J., Xu, J., Wang, A., & Zheng, M. (2009). Scaffolds for tendon and ligament repair: review of the efficacy of commercial products. Expert review of medical devices, 6(1), 61-73. doi: 10.1586/17434440.6.1.61
[30] Ratcliffe, A., Butler, D. L., Dyment, N. A., Cagle, P. J., Proctor, C. S., Ratcliffe, S. S., & Flatow, E. L. (2015). Scaffolds for tendon and ligament repair and regeneration. Annals of biomedical engineering, 43(3), 819-831. doi: 10.1007/s10439-015-1263-1
[31] Aurora, A., Mesiha, M., Tan, C. D., Walker, E., Sahoo, S., Iannotti, J. P., ... & Derwin, K. A. (2011). Mechanical characterization and biocompatibility of a novel reinforced fascia patch for rotator cuff repair. Journal of Biomedical Materials Research Part A, 99(2), 221- 230. doi: 10.1002/jbm.a.33179
[32] Sahoo, S., Greeson, C. B., McCarron, J. A., Milks, R. A., Aurora, A., Walker, E., ... & Derwin, K. A. (2012). Effect of pretension and suture needle type on mechanical properties of acellular human dermis patches for rotator cuff repair. Journal of shoulder and elbow surgery, 21(10), 1413-1421. doi: 10.1016/j.jse.2011.10.028
[33] Loh, Q. L., & Choong, C. (2013). Three-dimensional scaffolds for tissue engineering applications: role of porosity and pore size. Tissue Engineering Part B: Reviews, 19(6), 485- 502. doi: 10.1089/ten.teb.2012.0437
[34] Chiu, Y. C., Cheng, M. H., Engel, H., Kao, S. W., Larson, J. C., Gupta, S., & Brey, E. M. (2011). The role of pore size on vascularization and tissue remodeling in PEG hydrogels. Biomaterials, 32(26), 6045-6051. doi: 10.1016/j.biomaterials.2011.04.066
[35] Smith, B. D., & Grande, D. A. (2015). The current state of scaffolds for musculoskeletal regenerative applications. Nature Reviews Rheumatology, 11(4), 213-222. doi: 10.1038/nrrheum.2015.27
[36] Serra, I. R., Fradique, R., Vallejo, M. C. S., Correia, T. R., Miguel, S. P., & Correia, I. J. (2015). Production and characterization of chitosan/gelatin/β-TCP scaffolds for improved bone tissue regeneration. Materials Science and Engineering: C, 55, 592604. doi: 10.1016/j.msec.2015.05.072
[37] Tabbaa, S., & Burg, K. J. (2015). The effect of wicking fibres in tissueengineered bone scaffolds. Journal of tissue engineering and regenerative medicine, 9(4), 469-472. doi: 10.1002/term.1937 3 4 5 6 7 8 9 10 11 12 13 14 15 16 17 18 19 20 21 22 23 24 25 26 27 28 29 30 31 32 33 34 35 36 37 38 39 40 41 42 43 44 45 46 47 48 49 50 51 52 53 54 55 56 57 58 59 60
24 [38] Katti, D. S., Vasita, R., & Shanmugam, K. (2008). Improved biomaterials for tissue engineering applications: surface modification of polymers. Current topics in medicinal chemistry, 8(4), 341-353. doi: 10.2174/156802608783790893 3 4 5 6 7 8 9 10 11 12 13 14 15 16 17 18 19 20 21 22 23 24 25 26 27 28 29 30 31 32 33 34 35 36 37 38 39 40 41 42 43 44 45 46 47 48 49 50 51 52 53 54 55 56 57 58 59 60
25 Figure Captions
Figure 1. SEM images obtained of the two 3D (A and B) and of the two 2D (C and D) warp-knitted structures under 40×, 150× and 500× magnification.
Figure 2. Porosity levels of the 3D (A and B) and 2D (C and D) structures under study. Significant difference compared to A (#), B (Y), C (+), p < 0.0001.
Figure 3. Relationship between the weight change of the two 3D warp-knitted structures (A and B) and the two 2D warp-knitted structures (C and D) and the immersion time in water. Data are presented as mean ± SD.
Figure 4. Relationship between the wicking behavior of the two 3D warp-knitted structures (A and B) and the two 2D warp-knitted structures (C and D) over time. Data are presented as mean ± SD.
Figure 5. Force (N) / Elongation (mm) and Stress (MPa) / Strain (%) representative curves of the 3D (A and B) and the 2D (C and D) warp-knitted structures under study, under (a) dry conditions and (b) wet conditions.
Figure 6. Mechanical parameters under study of the 3D (A and B) and the 2D (C and D) constructs: (a) Failure load (N); (b) Maximum Stress (MPa); (c) Young’s Modulus (MPa); (d) Stiffness (N/mm); (e) Failure Strain (%); (f) Toughness (J/mm3). Significant difference compared to A (#), B (Y), C (+), with (*) p < 0.05, (**) p < 0.01 and (***) p < 0.0001. Figure 7. Force (N) / Elongation (mm) representative curves obtained from the cyclic tests of the 3D (A and B) and 2D (C and D) structures under study, in which in (a) the test was continuous, while in (b) the specimen length was readjusted at each cycle to maintain the initial length of 40 mm. 3 4 5 6 7 8 9 10 11 12 13 14 15 16 17 18 19 20 21 22 23 24 25 26 27 28 29 30 31 32 33 34 35 36 37 38 39 40 41 42 43 44 45 46 47 48 49 50 51 52 53 54 55 56 57 58 59 60
26 Table Captions
Table 1. Estimated values of the mechanical parameters under study, of the 3D (A and B) and 2D (C and D) structures developed, under dry and wet conditions. Data are presented as mean ± SD.
Table 2. Measurements obtained from the cyclic tests of the 3D (A and B) and the 2D (C and D) warp-knitted structures under study. Data are presented as mean ± SD.
3 4 5 6 7 8 9 10 11 12 13 14 15 16 17 18 19 20 21 22 23 24 25 26 27 28 29 30 31 32 33 34 35 36 37 38 39 40 41 42 43 44 45 46 47 48 49 50 51 52 53 54 55 56 57 58 59 60