Master Degree in Economics from Nova - School of Business and Economics.
What Drives Internal Carbon Pricing as a
Climate Risk Management Tool?
Phillip Meier, 3132
A project carried out under the supervision of:
Maria A.
C
UNHA-
E-S
Áand Renato R
OSAAbstract
Recent developments in climate regulation have led corporations to adjust their business models to prepare for the transition to a low-carbon economy. To respond to existing legislation and hedge against future climate regulations risk, an increasing number of mainly large corporations voluntarily embed an internal carbon value in decision-making processes as part of their business strategy. The aim of this study is to investigate the main forces that drive the adoption of such practice. A sample of 261 firms participating in the Carbon Disclosure Project is used to test a framework based on stakeholder theory and the resource-based view. The binary logistic regression analysis provides empirical evidence for the positive effect of institutional and stakeholder pressure on internal carbon pricing adoption. This paper finds that large corporations that employ a sustainability committee and rely on carbon-intense operations are more likely to adopt it. The results of this research should be of interest to policymakers, executive directors and external stakeholders engaged in climate change mitigation and adaptation policies.
Keywords: Internal carbon pricing, Carbon Disclosure Project, Carbon management system, Climate risk management.
1. Introduction
Climate change entails severe risks to mankind, from threatened food supply due to extreme periods of drought and shifting rain patterns to higher frequencies of catastrophic flooding caused by shrinking ice sheets and rising sea levels (IPCC, 2014). Strong evidence exists that this phenomenon is largely caused by anthropogenic activities: Economic and population growth as well as ever-intensifying industrialization have driven up the level of carbon dioxide and other human-made emissions in the atmosphere, leading to the greenhouse gas (GHG) effect and substantially contributing to change the global climatic system (Stern, 2007). To combat these severe and irreversible consequences for humankind and the natural ecosystems, urgent action in permanently reducing human-made GHG emissions is required. Effective decision-making would not only mitigate the risks associated with climatic change in this century and beyond but also scale down the entire costs of adaptation in the long-term and establish a basis for climate-friendly and sustainable development (IPCC, 2014).
Consequently, governments and policy makers worldwide have placed climate change on their agenda and prioritize the goal of the transition to a low carbon economy. In 2015, nearly 200 countries signed the Paris Agreement and committed to combat global warming and its impacts, striving to limit global temperature increase below two degrees Celsius above pre-industrial levels by 2100 (UN, 2015). Hence, different types of intervention have been proposed by policy makers, such as carbon taxation, emission trading schemes or subsidies to promote eco-efficient innovations and technologies (Stern, 2007). Environmental awareness moving into the focus of society additionally strengthens the pressure from other stakeholders like non-governmental organizations, customers or shareholders to reduce their carbon footprint and operate environmentally consciously (Jeswani et al., 2008). Whilst engaging in socio-political discussions and influencing policy-makers towards more favorable solutions in the past, the majority of businesses have accepted the challenge of a carbon-constrained economy in the near future and actively control their carbon emissions, invest in more ecologically friendly research and
development and capitalize on the market opportunities and potentials that open up due to shifting interests from customers and institutional bodies (Weinhofer and Busch, 2013).
One corporate instrument that is steadily gaining higher popularity among business leaders is internal carbon pricing (ICP). Companies embed an internal value on their carbon emissions into their business strategy to stress-test their operations and investments, assess and manage hidden inefficiencies, climate risks and opportunities, anticipate more intense and far-reaching carbon regulations and foster the transition towards a low-carbon business model (Bartlett, 2017). Having emerged as a powerful and cost-effective risk management approach, empirical research exploring key determinants of ICP adoption is still very scarce. This paper pursues contributes to fill this gap by analyzing (i) the impact of stakeholders´ and institutional pressure as well as (ii) the influence of organizational capabilities and a firm´s carbon footprint on ICP implementation leading to the following research question:
What are the main factors that determine the business decision to implement internal carbon pricing initiatives?
The remainder of this study is structured as follows: The next section summarizes prior economic research on corporate climate change adaptation. In section 3, we present our analytical framework and develop testable hypotheses. Section 4 presents information about the sample, the data collection process and the measurement of the employed variables, followed by a description of the statistical methodology in section 5. Furthermore, the main empirical results are illustrated and their validity checked by running various robustness tests. Finally, the last section offers conclusions.
2. Literature Review
Although natural science has been addressing climate change and its respective risks for decades, its mitigation is a rather recent issue receiving increasing attention within today´s corporate world (Linnenluecke et al., 2013). Climate change and more intense carbon emissions will cause severe negative
impacts on corporations in various dimensions. These risks might affect companies both directly and indirectly and include physical, regulatory, financial and legal liability risks as well as reputational patterns (Lash and Wellington, 2007). Consequently, firms need to handle and manage the negative impacts on their operations more thoroughly than ever before (Winn et al., 2011).1
Prior research on corporate climate change management mainly addressed voluntary carbon disclosure, its drivers and outcomes (e.g. Stanny, 2013; Griffin et al. 2017), as well as the effect of corporate carbon emissions on financial outcomes and enterprise value (e.g. Giannarakis et al., 2017). Various authors have already proposed several climate change risk mitigation measures at the firm-level, including the participation in political activities, trading emission certificates and operational improvements (e.g. Kolk and Pinkse, 2007; Weihnhofer and Busch, 2013). However, little research addressed the characteristics of corporate carbon management activities, directly targeting emission reductions and their determinants.
This paper is most closely related to Yunus et al. (2015) who researched the relationship between the introduction of a carbon management strategy and internal organizational as well as corporate governance factors among Australia´s 200 largest companies. The results of the logistic regression analysis revealed a significant correlation with the presence of an environmental management system, an environmental committee as well as larger board size and board independence. We have also taken into account the findings of Luo and Tang (2016), who investigated the factors that affect the quality of corporate carbon management systems among companies that voluntarily participated in the Carbon Disclosure Project (CDP). By running an ordinary least squares regression, the firm´s regulatory and legal environment, the presence of an emission trading scheme (ETS), stronger pressure from competitors, as well as higher carbon exposure showed a positive correlation with higher quality of carbon management systems. In
contrast, Böttcher and Müller (2015) focused their study more specifically on the dynamics within the German automotive supplier sector. They estimated a structural equation model to conclude that stakeholder pressure and to some extent competitiveness expectations are driving the development of low-carbon products, productions and logistics. Damert et al. (2017) reaffirmed the relevance of institutional and stakeholder pressure as key determinants of emission reduction activities whilst focusing on 45 leading companies from the steel, automotive and cement sectors. However, no direct relationship between corporate carbon strategies and long-term improvements in carbon and financial performance was found.
Our study, instead, explicitly analyzes the key drivers of ICP adoption. We contribute to the literature by establishing a framework that combines stakeholder and institutional theory with the resource-based view, namely corporate organization and structural factors. Assessing how external pressure from various stakeholders, internal factors as well as the firm´s carbon intensity might influence ICP implementation will be valuable for both stakeholders and policy makers.
3. Analytical Framework
In this section, we describe the main hypotheses to be tested regarding the decision to adopt ICP. We distinguish between external and internal factors.
3.1 Theoretical Background
Freeman´s (1984) pioneering book about stakeholder theory argued that satisfying all stakeholders and not only direct stockholders and customers is essential for organizational success in the long term. (Mitchell et al., 1997). Due to the rising general interest about GHG mitigation, firms are pressured to react to their stakeholder´s claims by managing environmental topics and implementing appropriate policies. Especially the regulatory environment is very influential in shaping internal strategies and policies (Pulver, 2007). Institutional theory argues that firms operating within the same country or
industry, and hence being the target of a common regulatory environment, face similar levels and sources of institutional pressure and will therefore follow similar internal approaches, known as “coercive isomorphism” (DiMaggio & Powell, 1993).
Additionally, internal characteristics seem to play a crucial role in taking climate action and initiating environmental policies. The resource-based view argues that a firm´s internal structure as well as its resources and capabilities are pivotal in meeting emerging challenges and uniquely determine stakeholder relations (Barney, 1986). Especially when practices like ICP schemes are relatively novel and recent, organizational characteristics might be decisive as benefits and costs of implementing such a measure are not yet clear (Di Maggio and Powell, 1983).
3.2 Hypotheses Development
In this section, we present the seven hypotheses to be tested. Hypotheses 1 to 3 focus on external factors related to the claims of stakeholder theory while hypotheses 4 to 7 test the influence of internal factors. H1: Firms operating in countries with severe climate regulation and legislation are more likely to implement internal carbon pricing mechanisms.
Prior literature has shown that increasing compliance costs incurred by climate regulation and legislation as well as growing liability for their carbon footprint are the major drivers for companies to actively manage and reduce their emission levels (e.g. Luo and Tang, 2014; Böttcher and Müller, 2015; Damert et al., 2017). As slowly but surely the vision of worldwide carbon pricing begins to seem more likely, the momentum of tightening future climate regulations to achieve the national targets of the Paris Agreement is arriving. To hedge against these compliance risks, corporations adjust by setting emission reduction targets in the present, thus anticipating those regulations (Pinkse, 2007; Damert et al., 2017). Voluntarily adopting an internal carbon value hence offers the opportunity to ensure regulatory compliance with climate laws and potentially decrease operating costs in the long-term (Bartlett, 2017).
H2: Firms with a higher ratio of financial leverage are more likely to implement internal carbon pricing mechanisms.
Due to closer scrutiny by regulatory bodies in recent years, also creditors are requiring greater transparency from their borrowers on their carbon footprint. Generally, financial institutions provide loans for major purchases or projects. In return, they expect the borrowing firm to pay back the loan consistently and responsibly. Therefore, creditors might be very sensitive towards financial risks which can be potentially caused by climate-related regulations and carbon-intense operations. Especially in highly regulated countries where carbon regulations are in practice, they incorporate potential non-compliance within their lending risk assessment, resulting in stricter requirements and additional fees for affected firms (Schneider, 2011). Consequently, their influence on the borrowing firm´s operations increases with the extent of corporate financial debt (Artiach et al., 2009). Previous studies have already found evidence of a positive relationship between higher financial gearing and both the degree of environmental disclosures (Alciatore and Dee, 2006) and the adoption of carbon management tools (Yunus et al, 2015). H3: Firms facing greater societal pressure and awareness about climate change are more likely to implement internal carbon pricing mechanisms.1
Due to large media attention and consequently, rising societal interest by non-governmental organizations, customers and the civil society (Lorenzoni and Pidgeon, 2006), firms are urged to embed environmental compliance within their business strategy (Weinhofer and Hoffmann, 2010; Yunus et al., 2015). To close an impending legitimacy gap, maintain their reputation and ensure long-term competitiveness, companies have not only disclosed their carbon emissions in the past but also started various initiatives proactively like improving the environmental performance within their processes
1 One might assume that societal pressure could influence regulation intensity and hence, should be employed as a
mediator variable in this model. However, the Spearman correlation matrix in the Annex presents a slightly negative but significant coefficient. Therefore, it can be inferred that a mediating effect is not present. In addition, we tested for interaction effects among the remaining explanatory variables but could not find any significant result.
(Sangle, 2011), developing green product lines, participating in political lobbying and launching public relations campaigns (Lee, 2012; Damert et al., 2017). In addition, public organizations like the CDP (Carbon Disclose Project), the I4CE (Intstitute for Climate Economics) or the epe (enterprises pour l ́environnement) are increasingly spreading awareness about ICP as a long-term climate change mitigation strategy and hence, intensifying societal pressure.
H4: Firms with an environmental committee are more likely to implement internal carbon pricing mechanisms than those without.
Prior studies additionally considered internal organization and corporate governance factors as crucial determinants of carbon management adoption and quality (e.g. Yunus et al., 2015).
One way to show strong commitment towards environmental sustainability is the constitution of an environmental committee composed most commonly by independent experts. They are responsible for steering corporate social responsibility activities and undertaking environmental initiatives with transparency and credibility (Eccles et al., 2012) whilst aiming at ensuring legitimacy and minimizing reputational risk within the corporate organization (Yunus et al., 2015). Thus, such a committee offers guidance in reporting on GHG emissions and introducing carbon reduction initiatives to increase the value of the firm (Ashforth and Gibbs, 1990).
H5: Firms with a higher number of board members are more likely to implement internal carbon pricing mechanisms.
Yunus et al. (2015) have shown the relevance of the internal board structure for successful corporate governance. These practices of effective and diligent management are generally carried out by the board of directors. The board´s members are respectively also held liable for the consequences of the firm´s sustainability and environmental performance (Kiel & Nicholson, 2005). A number of studies argue that larger boards derive benefits from more experience and greater specialist expertise (Dalton et al., 1999;
Adams and Mehran, 2008) which respectively improves the firm´s governance and particularly adds value in developing climate-related strategies (Rankin et al., 2011).
H6: Firms with a higher share of independent directors are more likely to implement internal carbon pricing mechanisms.
In addition, board´s composition needs to be considered when examining the impact on corporate governance success. One crucial characteristic is the share of board members that act independently, referred to as independent directors, which has been addressed in numerous studies (e.g., Hermalin and Weisbach, 2003; Adams and Ferreira, 2007). Independent directors deliver great value to the company by scrutinizing managerial actions and corporate strategy development whilst holding the management responsible for their decisions. Being independent from the executive board and hence being hardly driven by economic self-interest, they operate as the trustees of the shareholders, ensure corporate compliance and achieve the right balance between financial, social and ecological interests (Morck, 2008). Therefore, board independence not only fosters monitoring and disclosure processes (Peasnell et al., 2005) but also addresses non-economic questions like the current climate change debate in favor of external stakeholders (Galbreath, 2010; Yunus et al., 2015). As ICP can indeed be considered as a corporate environmental initiative, facilitated by social concerns, board independence might provide guidance and facilitate its implementation.
H7: Firms with higher carbon intensity within their operations are more likely to implement internal carbon pricing mechanisms.
Especially high emitting companies and industries are the main target of the general public, environmental lobby groups (Brammer and Pavelin, 2006; Gamerschlag et al., 2011; Luo and Tang, 2014), and regulatory authorities (Patten, 2002) within the scope of today´s discussion about climate change mitigation. Prior research has shown that heavy emitters disclose more climate-related information (Line
et al., 2002; Reverte, 2009). As the risk of making stranded investments is greatest for firms with high carbon exposure, the benefits of actively managing their environmental operations grow with total greenhouse gas emissions (Anton et al., 2004). Thus, it is very likely that heavy emitters strive to anticipate mandatory environmental regulations and mitigate climate risk proactively by implementing ICP systems (Luo and Tang, 2016).
4. Data
4.1 Sample Description
This study relies on the data from the largest 500 corporations worldwide, measured by total revenue, which are represented by the Fortune Global 500 ranking 2017. This index has been chosen for two reasons. Firstly, society, environmental groups, media and governments pay greatest attention to especially large and highly polluting companies, pressure them to disclose more information publicly and to show commitment to sustainable operations (Eleftheriadis and Anagnostopoulou, 2015). Secondly, larger firms tend to be in a better position with respect to developing environmental strategies than smaller peers as they can ensure a desired market environment more easily and have greater financial and human resources to implement these initiatives (Bansal, 2005; Gamerschlag et al., 2011; Weinhofer and Hoffmann, 2010). The data used in this study were collected from the CDP questionnaire and complemented with publicly available datasets like annual, sustainability and corporate citizenship reports, economic classifications, acknowledged surveys and online databank services for financial information. We eliminated the corporations with incomplete datasets and end up with 261 firms that fully fulfill the sampling requirements. Exactly a third of these companies are located in the U.S. The majority of the remaining firms are either Asian or Western European. Whilst 60 financial institutions are included, 46 firms operate in industries which are classified as environmental-sensitive, namely Energy, Utilities and Materials (Reverte, 2009).
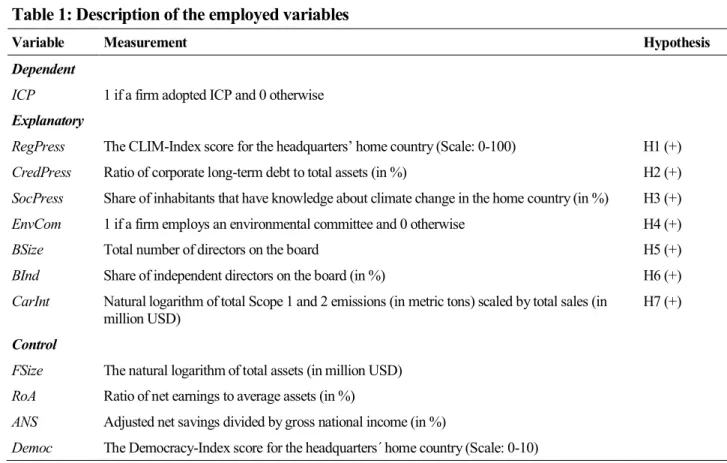
4.2 Description of the variables 4.2.1 Dependent Variable
As this study aims to understand whether a corporation implemented an ICP mechanism or not, the dependent variable is a dichotomous variable (ICP) is used that equals “1” if the firm has adopted such a scheme and “0” otherwise. Within the CDP survey from 2017, firms have been asked if they are already putting a price on carbon, are planning to do so within the following two years or not considering it at all. However, the second option is not binding and highly speculative. Hence, the answer had been restricted to the current state and information was collected manually from the corporate responses. Additionally, companies can voluntarily disclose information on how they calculate the value they employ per ton of emitted carbon dioxide equivalents and to which projects, operations and divisions they apply it. Since responses to these questions are largely not available or inconsistent and less comparable, the information was considered not suitable for this research.
Table 1: Description of the employed variables
Variable Measurement Hypothesis
Dependent
ICP 1 if a firm adopted ICP and 0 otherwise
Explanatory
RegPress The CLIM-Index score for the headquarters’ home country (Scale: 0-100) H1 (+)
CredPress Ratio of corporate long-term debt to total assets (in %) H2 (+)
SocPress Share of inhabitants that have knowledge about climate change in the home country (in %) H3 (+)
EnvCom 1 if a firm employs an environmental committee and 0 otherwise H4 (+)
BSize Total number of directors on the board H5 (+)
BInd Share of independent directors on the board (in %) H6 (+)
CarInt Natural logarithm of total Scope 1 and 2 emissions (in metric tons) scaled by total sales (in million USD)
H7 (+)
Control
FSize The natural logarithm of total assets (in million USD)
RoA Ratio of net earnings to average assets (in %)
ANS Adjusted net savings divided by gross national income (in %)
4.2.2 Independent Variables: External Factors
To capture the impact of institutional, legislative and regulatory pressure (RegPress) on corporate environmental strategies, we used the CLIM (Climate Laws, Institutions and Measures) Index by the European Bank for Reconstruction and Development, scaled from 0 to 100. This index is globally comparable, measuring extensiveness of climate change mitigation policies by evaluating policy measures, anchored laws and institutions at the country level (EBRD, 2011). In accordance with the “Country-of-Origin Effect” (Levy and Kolk, 2002), the corporate headquarters’ location is pivotal for the individual score of the analyzed firm. Pressure executed from creditors (CredPress) is described by the ratio of financial leverage which is computed as long-term debt scaled by total assets. Highly leveraged firms tend to be more intensively monitored and influenced by credit grantors and financial institutions (Cormier et al., 2015). To describe societal pressure (SocPress) on corporate environmental performance, the Gallup poll from 2009 is used. This survey on the public opinion about climate change is considered to be one of the most comprehensive surveys in this field. 206,193 respondents from 128 countries were asked about their awareness and knowledge about climate change, whether they experience it as a personal threat and whether they view it as caused by natural or anthropogenic activities (Pugliese and Ray, 2009). Consequently, public awareness in the headquarters’ country is taken as a proxy for societal pressure whilst controlling for the emancipation of the population.
4.2.3 Independent Variables: Internal Factors
Two different approaches are used to measure the organizational variables. The presence of an environmental committee (EnvCom) is described by a dichotomous variable that uses the value “1” if the analyzed firm has established a committee that explicitly deals with corporate social responsibility, environmental concerns or sustainability issues and “0” if not (Rankin et al., 2011). Board size (BSize) as a pivotal characteristic of corporate governance is measured by the number of directors on the corporate
independent directors on the board (Yunus et al, 2015). Information about organizational factors is gained from annual reports, corporate websites and Bloomberg.
Carbon intensity (CarInt) is described as the natural logarithm of total Scope 1 and Scope 2 emissions1 in relation to total sales (in million US-Dollars) which is in line with prior approaches (e.g. Anton et al., 2004; Luo and Tang, 2016). Data on corporate emission levels has been found in the companies´ CDP survey responses and compared with information from sustainability reports and Bloomberg.
4.2.4 Control Variables
Although our study focuses on the influence of stakeholder theory and internal resources, we need to control for other factors that might affect the empirical results of our analysis. Thus, firm size, a financial profitability indicator, the home country’s adjusted net savings and the political emancipation of their inhabitants were added as control variables to the proposed model.
As earlier explained, larger firms are scrutinized more intensely by various stakeholders (Bansal, 2005) and consequently are incentivized to engage in social and environmental initiatives (Anton et al., 2014). These hypotheses are confirmed by prior research which confirmed a positive relationship between company size and both voluntary carbon disclosure (e.g. Brammer and Pavelin, 2006; Luo and Tang, 2014) and the implementation of climate change mitigation strategies (e.g. González-Benito and González-Benito, 2006; Weinhofer and Hoffmann, 2010; Damert and Baumgartner, 2017). Hence, firm size (FSize) is used as a control variable, expressed by the natural logarithm of total assets in million US-Dollars (Stanny, 2013; Luo and Tang, 2014).
Not only the size of the company but also its financial health will increase public pressure and societal demands to ensure sustainable operations and disclose corporate social activities (Gamerschlag et al.,
1 Scope 1 emissions measure direct GHG emissions from sources and operations that are owned or controlled by the
analyzed company while Scope 2 emissions cover indirect GHG emissions from the generation of consumed electricity, heat or steam.
2011). Additionally, the resource dependence theory argues that more profitable companies have greater resources to implement advanced and costly environmental management tools (Hillary, 2004). Consequently, larger and more successful companies are expected to engage more actively in carbon management activities. As proposed in previous studies, Return on Assets (RoA) operates as a proxy for financial performance (e.g. Bansal, 2005; Damert et al., 2017).
To account for the economic performance of the home country, gross domestic product (GDP) per capita was commonly used in prior studies (e.g. Luo and Tang, 2014) as countries with a smaller GDP may not have the financial capabilities to sacrifice economic growth for climate protection measures. However, a country´s GDP does not incorporate information about depletion of its stock of natural capital. Therefore, adjusted net savings (ANS) will be employed as a macroeconomic control variable in the proposed model. It extends the net national savings measure by adding public expenditures on education as a proxy for investment in human capital whilst deducting depreciation of the environment (e.g. damages from local pollutants) and depletion of natural resources like energy, minerals or forests, and, thus, standing as the leading economic indicator of (weak) sustainability for an economy (Heal, 2012).
Lastly, to account for the emancipation of the population, the democracy index (Democ), developed by the Economist Intelligence Unit, is used. This indicator incorporates, among others, political participation, democratic political culture and civil liberties (EIU, 2017). As the responses from the latest CDP survey are based on information from 2016, all other data refer to this fiscal year as well. Only RegPress and SocPress rely on measurements from 2011 and 2009 respectively. Therefore, we assume stability on those indicators for the period under analysis.
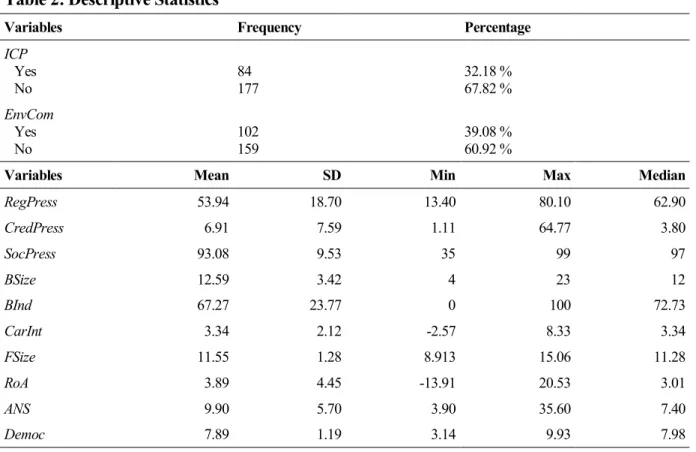
4.3 Descriptive statistics
Nearly a third of the 261 reported companies have already adopted some kind of ICP mechanisms. Although this tool is a rather innovative technique, it already enjoys widespread recognition. Additionally,
102 firms (39 percent) employ an environmental committee to manage environmental and climate-related issues. The CLIM-Index (RegPress) shows a mean of 53.9 on a scale from 0 to 100. While Russia indicates the lowest value (13.4), the CLIM-score is also very low for the USA (34.0). Information on the remaining variables can be found in Table 2.
5. Empirical Methodology
As ICP adoption is a dichotomous variable, a binary logistic regression is employed which shows statistically a higher fit than the probit model.1
The proposed model to be estimated can be stated as follows:
(1) 𝐼𝐶𝑃 = 𝛽0 + 𝛽1RegPress + 𝛽2CredPress + 𝛽3SocPress + 𝛽4EnvCom + 𝛽5BSize + 𝛽6BInd + 𝛽7CarInt + 𝛽8FSize + 𝛽9RoA + 𝛽10ANS + 𝛽11Democ + 𝜀,
1Both models are applicable when attempting to model a binary dependent variable and usually lead to very similar
results. The major difference lies in the assumption on the distribution of error terms in the model.
Table 2: Descriptive Statistics
Variables Frequency Percentage
ICP Yes No 84 177 32.18 % 67.82 % EnvCom Yes No 102 159 39.08 % 60.92 %
Variables Mean SD Min Max Median
RegPress 53.94 18.70 13.40 80.10 62.90 CredPress 6.91 7.59 1.11 64.77 3.80 SocPress 93.08 9.53 35 99 97 BSize 12.59 3.42 4 23 12 BInd 67.27 23.77 0 100 72.73 CarInt 3.34 2.12 -2.57 8.33 3.34 FSize 11.55 1.28 8.913 15.06 11.28 RoA 3.89 4.45 -13.91 20.53 3.01 ANS 9.90 5.70 3.90 35.60 7.40 Democ 7.89 1.19 3.14 9.93 7.98
where 𝛽0 represents the intercept and 𝛽1 to 𝛽7 the coefficients of the independent variables while 𝛽8 to 𝛽11 represent the coefficients of the control variables. We expect positive signs for the estimates of 𝛽1 to 𝛽7.
6. Empirical Results
In this section, the empirical results from (1) are presented and discussed. Thereafter, we acknowledge some limitations of this study and provide recommendations for future research.
6.1 Main findings and discussion
Table 1 summarizes the results of the binary logistic regression model1 and reports the average marginal effects for each variable.2 Whilst Model 1 only includes control variables, Model 2 further adds the three external pressure variables. Model 3 contains all aforementioned variables and adds another four internal factors. The likelihood ratio chi-square value of 12.84 in Model 1 is significant at the 5 percent level, indicating that only the control variables can already make a significant distinction between companies that adopt internal carbon pricing schemes and those which do not. When adding additional variables, the Pseudo-R2 increases continuously. The largest Pseudo-R2 is obtained in Model 3 with a value 0.25 which means that 25 percent of the variations in adopting ICP schemes or not can be explained by this model. Especially, introducing carbon intensity (CarInt) into the model adds value. Overall, the binary logistic regression model classifies 75.9 percent of the firms correctly.
1 We tested for multicollinearity and could not find indication for severe problems. Additionally, the Spearman correlation
matrix does not show unusual high coefficients among the explanatory variables. The respective tables can be found in the Annex.
From Model 3 we observe that regulatory pressure (RegPress) is statistically significant, providing evidence that supports H1, according to which firms located in countries with severe climate regulations and legislation are more likely to adopt ICP schemes. This is in line with prior research in this field (e.g. Jeswani et al., 2008), and supports the claims of institutional theory. Corporate action is shaped by its legal and institutional framework. The coefficients of CredPress and SocPress are both not significant. Thus, H2 and H3 are not supported. The positive sign of EnvCom supports H4 at the 95 percent level, indicating that the presence of a corporate environmental committee might encourage the implementation of ICP within a company. The expertise within such a committee, combined with the responsibility to
Model 1 ** Model 2 ** Model 3 **
Control V. FSize ROA ANS Democ 0.069*** (0.561) * -0.052*** (0.151)* * -0.053*** (0.072)* * 0.219*** (0.179)* * 0.055*** (0.049)* * -0.007*** (0.335)* * -0.010*** (0.096)* * -0.011*** (0.813)* * 0.099*** (0.000)* * 0.001*** (0.910)* * -0.006*** (0.274)* * 0.009*** (0.819)* * Explanatory V. RegPress CredPress SocPress EnvCom BSize BInd 0.006*** (0.000)* * -0.010*** (0.035)* * 0.008*** (0.240)* * 0.009*** (0.001)* * -0.001*** (0.942)* * 0.006*** (0.263)* * 0.131*** (0.011)* * -0.001*** (0.245)* * -0.001*** (0.402)* * CarInt 0.091*** (0.000)* * LR (p) 12.84*** (0.012)* * 30.54*** (0.000)* * 80.91*** (0.000)* * Pseudo R2 0.0391* * 0.0931* * 0.2467* * Correctly classified 68.58 %. 68.58 %. 75.86 %.
Notes: Average Marginal Effects reported
N = 261 all models
ensure sustainable development, effectively provides support to proactively initiating environmental activities, following the claims of the resource based view.
The organizational factors Board Size (BSize) and the share of independent directors on the board (BInd) are not significant, suggesting that corporate governance does not play a decisive role in determining the adoption of ICP. Additionally, the positive and highly significant coefficient of CarInt indicates that firms operating very carbon intensively tend to adopt ICP schemes. Finally, the positive and significant sign for firm size (FSize) confirms the findings of prior studies that larger firms are more likely to introduce actions to reduce greenhouse gas emissions and disclose more accurate information on their environmental exposure to maintain corporate legitimacy (e.g. Weinhofer and Hoffmann, 2010; Damert and Baumgartner, 2017). The remaining control variables RoA, ANS and Democ are not significant. 6.2 Robustness Checks
To check the robustness of the results alternative proxies were used to measure carbon intensity (CarInt), firm size (FSize) and the macroeconomic conditions in the headquarters´ home country in Model 4. As climate regulation and legislation target rather industries rather than individual highly-polluting companies, a categorization of carbon intensity across different sectors has been carried out. Reverte (2009) classifies the Energy, Utilities and Materials sectors as environmentally sensitive due to their carbon-intensive business model. Thus, we introduce a dummy variable (EnvSens) that equals 1 if a firm operates in one of these three industries and 0 otherwise. Additionally, as in prior studies, firm size (FSizeRev) can also be measured as the natural logarithm of total revenue (e.g. Yunus et al., 2015; Luo & Tang, 2016, Giannarakis et al., 2017). As proposed by Luo & Tang (2016), the natural logarithm of GDP per capita (GDP) will be used as a proxy for the current economic conditions within the corporate home countries. Finally, Luo and Tang (2016) argue that financial institutions should be excluded in cross-sectoral environmental management studies due to their unique regulatory environment and their widely
emission-free operations. As financial firms and institutions play a significant role within the sample, they have been removed in model 5.
Generally, the results (reported in the Annex) are qualitatively consistent and therefore similar conclusions can be drawn from all models. Only in Model 4, when applying alternative proxies in the binary logistic regression model, SocPress becomes significant with a positive sign. This highlights the relevance of societal pressure in this study and further supports stakeholder theory. Additionally, the empirical findings are consistent with the claim of legitimacy theory. Awareness about climate change within society, promoted by intensive media coverage, environmental activism and education sets boundaries and expectations towards corporate social and environmental behavior. Firms may respond to these public norms by implementing voluntary ICP schemes to comply with new societal expectations and to remain legitimate to this large and important stakeholder group (Dowling & Pfeffer, 1975). We also found that companies from environmentally sensitive sectors are more likely to adopt internal carbon pricing. As the specific characteristics of stakeholders´ pressure vary highly among countries, industries and firms, the large divergences of corporate environmental management can be explained by variations in national factors like regulation or legislation (Kassinis & Vafeas, 2006). As both regulatory environment and societal pressure are measured at a home-country specific level the headquarters´ geographical locations are relevant in this context as well, consistent with previous studies (e.g. Gonzalez-Benito and Gonzalez-Gonzalez-Benito, 2006).
In contrast, CredPress shows a negative and significant marginal effect in Model 5 whilst being not significant in the original model. This suggests that highly leveraged companies from non-financial industries are less likely to adopt ICP schemes. In general, creditors aim to ensure liquidity of the borrowing firm to preserve their rights and interests. Although ICP schemes primarily aim at mitigating financial risks caused by anticipation of tightening of future climate regulations and, therefore contributing to decrease operating costs in the long term, the introduction of such a mechanism involves
considerable implementation and ongoing costs associated with research and development, monitoring and additional labor force (Luo and Tang, 2016). In the short run, such an investment might negatively affect the firm´s payment risk. However, highly leveraged companies might not have the financial leeway to bear these costs. Moreover, ICP is a very recent carbon management tool and, hence, little evidence exists about how effective it is in achieving emission reduction targets. Eventually, its benefits might not be enough to offset the high implementation and operating costs even in the long run. Therefore, creditors might require the borrowing companies to rather adopt more acknowledged and renowned environmental management actions. Overall, the Pseudo-R2 increases significantly to 0.31 in Model 5, supporting Luo and Tang´s (2016) claim that excluding the financial sector might lead to more meaningful empirical results.
This study further provides guidelines both to corporations that are intending to implement ICP as a risk management tool and policy makers that pursue the goal to move towards a low-carbon economy. In particular, the main sources of corporate environmental pollution, i.e. large and carbon-intense companies, are already introducing ICP schemes in anticipation of a tighter carbon constrained future. On the other hand, firms that are willing to implement ICP within their environmental business strategy might investigate the importance of a sustainability committee and utilize its experience and expertise in this field to design a guide on how to develop these corporate capabilities. Additionally, governments should incentivize the presence of a corporate sustainability committee. While more and more authorities, including the European Union, are requiring certain large companies to disclose information on their environmental impact (CDSB, 2016), they should also eventually consider mandatory presence of sustainability committees for firms that are highly harmful to the environment.
Lastly, ICP emerged as a climate risk management tool only over the last few years. As soon as its benefits and drawbacks are more intensively explored and estimated, managers of highly leveraged companies should assess the effectiveness and usefulness of ICP systems together with their creditors,
with a special focus on their utilization to hedge financial risks in the long-term.
6.3 Limitations and future research
Although this paper provides first insights into the novel research field of ICP, its results should be viewed within the context of its limitations Firstly, this research is based on data extracted from the CDP surveys. As its answers are voluntary and self-reported by participating firms, the quality and consistency of the data provided need to be verified. Therefore, a counter-check with corporate reports and Bloomberg data has been undertaken. However, non-responding firms have been excluded from the sample which might lead to a self-selection bias, as explained by Luo and Tang (2016). Second, the results of the study clearly focus on companies with very large revenues and are therefore hard to generalize. Lastly, we could not sufficiently test for endogeneity due to the characteristics of our sample. One might assume that independent specialists are hired when company executives plan to adopt ICP or other climate change adaptation strategies. However, company executives reveal that environmental committees are the initiators of such practices most of the time (Bartlett et al., 2017).
Currently, only data on whether a company implements ICP or not is considered as reliable and comparable. However, there exist large differences in the values firms assign to their emissions and, additionally, its coverage may vary highly among companies and sectors. Whilst some might apply their ICP system on all current operations and future investments, others might only target particular projects (Bartlett, 2017). As ICP is steadily growing as a corporate business practice, we also expect more sophisticated and differentiated disclosures in this field. Therefore, future studies should incorporate more detailed data, investigate which factors determine the value and evaluate the quality of each system. The use of panel data could investigate the effect of ICP adoption on environmental and financial performance. Finally, our empirical findings are based on completely quantitative data. We suggest that this study should be complemented by qualitative research that analyzes managerial drivers and
motivations of introducing such a carbon management tool.
7. Conclusion
Given the recent reversals of climate change policy, large and carbon-intense corporations, the main source of human-caused greenhouse gas emissions, are already preparing for a carbon-constrained future whilst ensuring long-term profitability by internalizing the costs of produced carbon emissions. The results provide statistical evidence of a positive effect of regulatory and to some extent societal pressure on ICP adoption. In contrast to the hypothesis set, however, highly leveraged firms from non-financial sectors are less likely to adopt such a scheme. Whilst corporate governance factors showed to be not statistically significant, the presence of an environmental committee proved to be a crucial factor as well. Additionally, the analysis revealed that large and carbon-intense companies are more likely to implement ICP mechanisms within their operations. Eventually, the importance of an environmental committee needs to be emphasized by both regulators and business experts. It could even be considered to make its presence mandatory for corporations operating in environmentally sensitive industries.
List of References
Adams, R. B. & Ferreira, D. 2007. “A Theory of Friendly Boards.” The Journal of Finance, 62(1): 217-250.
Adams, R. B. & Mehran, H. 2008. “Corporate Performance, Board Structure, and Their Determinants in the Banking Industry.” FRB
of New York Staff Report, 330.
Alciatore, M. L. & Dee, C. C. 2006. “Environmental disclosures in the oil and gas industry, environmental accounting: commitment or propaganda.” Advances in Environmental Accounting and Management, 3: 49-75.
Anton, W. R. Q., Deltas, G. & Khanna, M. 2004. “Incentives for Environmental Self-regulation and Implications for Environmental Performance.” Journal of Environmental Economics and Management, 48 (1): 632–54.
Artiach, T., Lee, D., Nelson, D. & Walker, J., 2009. “The determinants of corporate sustainability performance.” Accounting and
Finance, 50(1): 31-51.
Ashforth, B. & Gibbs, B. 1990. “The Double Edge of Legitimation.” Organization Science, 1: 177-194.
Bansal, P. 2005. “Evolving sustainably: a longitudinal study of corporate sustainable development.” Strategic Management Journal, 26(3): 197-218.
Barney, J. B. 1986. “Organizational culture: Can it be a source of sustained competitive advantage.” Academy of Management Review, 11: 656-665.
Bartlett, N. 2017. “Internal Carbon Pricing: Trends and Benefits.” Carbon Disclosure Project (CDP).
Bartlett, N., Cushing, H., & Law, S. 2017. “Putting a price on carbon - Integrating climate risk into business planning.” Carbon
Disclosure Project (CDP).
Böttcher, C. F. & Müller, M. 2015. „Drivers, Practices and Outcomes of Low-carbon Operations: Approaches of German Automotive Suppliers to Cutting Carbon Emissions.” Business Strategy and the Environment, 24(6): 477–498.
Brammer, S. & Pavelin, S. 2006. “Voluntary environmental disclosures by large UK companies.” Journal of Business Finance &
Accounting, 33(7-8): 1168–1188.
Climate Disclosure Standards Boards (CDSB). 2016. EU environmental reporting handbook.
Cormier, D., Magnan, M. & Velthoven, B. V. 2005. “Environmental disclosure quality in large German companies: economic incentives, public pressures or institutional conditions.” European Accounting Review, 14,:3-39.
Dalton, D. R., Daily C. M., Johnson J. L. & Ellstrand A. E. 1999. “Number of Directors and Financial Performance: A Meta-Analysis.”
Academy of Management Journal, 42: 674-686.
Damert, M. & Baumgartner, R. J. 2017. “Intra-Sectoral Differences in Climate Change Strategies: Evidence from the Global Automotive Industry.” Business Strategy and the Environment, 27(3): 265-281.
Damert, M., Paul. A. & Baumgartner, R. J. 2017.“ Exploring the determinants and long-term performance outcomes of corporate carbon strategies.” Journal of Cleaner Production, 160(1): 123-138.
DiMaggio P. J. & Powell, W. W. 1983. “The iron cage revisited: institutional isomorphism and collective rationality in organizational fields.” American Sociological Review, 48(2): 147–160.
Dowling, J. & Pfeffer, J. 1975. “Organizational legitimacy: Social values and organizational behavior.” Pacific Sociological Review, 18(1): 122-136.
Eccles, R. G., Ioannou, I., Shelley X. L., & Serafeim, G. 2012. “Pay for Environmental Performance: The Effect of Incentive Provision on Carbon Emissions.” Harvard Business School Working Paper, 13-43.
Economist Intelligence Unit (EIU). 2017. The Economist Intelligence Unit´s Democracy Index 2016 – Revenge of the deploreables.. London: The Economist.
Eleftheriadis, I. M. & Anagnostopoulou, E. G. 2015. “Relationship between corporate climate change disclosures and firm factors.”
Business Strategy and the Environment, 24(8): 780–789.
European Bank for Reconstruction and Development (EBRD). 2011. Special Report on Climate Change. The Low Carbon Transition, London, UK.
Freeman, R. E. 1984. Strategic Management: A Stakeholder Approach. Boston, MA: Pitman.
Galbreath, J. 2010. “Corporate governance practices that address climate change: an exploratory study.” Business Strategy and the
Environment, 19(5): 335-350.
Gamerschlag, R., Möller, K., & Verbeeten, F. 2011. „Determinants of voluntary CSR disclosure: empirical evidence from Germany.”
Review of Managerial Science, 5(2-3): 233-262.
Giannarakis, G., Zafeiriou, E. & Sariannidis, N. 2017. “The Impact of Carbon Performance on Climate Change Disclosure.” Business
Strategy and the Environment, 26(8): 1078-1094.
Gonzalez-Benito, J, Gonzalez-Benito, O. 2006. “A review of determinant factors of environmental proactivity.” Business Strategy and
the Environment, 15(2): 87–102.
Griffin, P. A., Lont, D. H., & Sun, E. Y. (2017). “The Relevance to Investors of Greenhouse Gas Emission Disclosures.” Contemporary
Accounting Research, 34(2): 1265-1297.
Heal, G. 2012. “Defining and Measuring Sustainability.” Review of Environmental Economics and Policy, 6(1): 147–163.
Hermalin, B. & Weisbach, M. 2003. “Boards of Directors as an Endogenously Determined Institution: A Survey of the Economic Literature.” Federal Reserve Bank of New York Economic Policy Review, 9: 7-26.
Jensen, S., K. Molin, K. Pittel, and T. Sterner. 2015. “An Introduction to the Green Paradox: The Unintended Consequences of Climate Policies.” Review of Environmental Economics and Policy 9(2): 246-265.
Jeswani, H. K., Wehrmeyer, W. & Mulugetta, Y. 2008. „How warm is the corporate response to climate change? Evidence from Pakistan and the UK.” Business Strategy and the Environment, 17(1): 46-60.
Kassinis, G. & Vafeas, N. 2006. “Stakeholder Pressures and Environmental Performance.” The Academy of Management Journal 49(1): 145-159.
Kiel, G. C. & Nicholson, G. J. 2005. “Evaluating boards and directors.” Corporate Governance: An International Review, 13(5): 613-631.
Kolk, A. & Pinkse, J., 2007. “Multinationals' Political Activities on Climate Change.” Business & Society, 46: 201-228. Lash, J. & Wellington, F. 2007. “Competitive advantage on a warming planet.” Harvard Business Review, 85(3): 94–106.
Lee, S. Y. 2012. “Corporate Carbon Strategies in Responding to Climate Change.” Business Strategy and the Environment, 21(1): 33-48.
Levy, D.L, & Kolk A. 2002. “Strategic responses to global climate change: conflicting pressures on multinationals in the oil industry.”
Business and Politics, 4(3): 275–300.
Line, M., Hawley, H. & Krut, R. 2002. “The development of global environmental and social reporting.” Corporate Environmental
Strategy, 9(1): 69-78.
Linnenluecke, M. K., Griffiths, A. & Winn, M.I. 2013. „Firm and industry adaptation to climate change: a review of climate adaptation studies in the business and management field.” WIREs Climate Change, 4(5): 397-416.
Lorenzoni, I. & Pidgeon, N. F. 2006. “Public views on climate change: European and USA perspectives.” Climatic Change, 77(1-2): 73-95.
Luo, L., & Tang, Q. 2014. “Does voluntary carbon disclosure reflect underlying carbon performance?” Journal of Contemporary
Accounting and Economics, 10(3): 191–205.
Luo, L. & Tang, Q. 2016. “Determinants of the Quality of Corporate Carbon Management Systems: An International Study”. The
International Journal of Accounting, 51(2): 275-305.
Mitchell, R. K., Agle, B. R. & Wood, D. J. 1997. “Toward a theory of stakeholder identification and salience: Defining the principle of who and what really counts.” Academy of Management Review, 22(4): 853–886.
Morck, R. 2008. “Behavioral finance in corporate governance: Economics and ethics of the devil´s advocate.” Journal of Management
and Governance, 12(2): 179-200.
Patten, D. M. 2002. “Media exposure, public policy pressure, and environmental disclosure: An examination of the impact of tri data availability.” Accounting Forum, 26(2): 152–171.
Peasnell, K. V., Pope, P. F. & Young, S. 2005. “Board monitoring and earnings management: Do outside directors influence abnormal accruals?” Journal of Business Finance and Accounting, 32(7-8): 1311-1346.
Pinkse, J. 2007. “Corporate intentions to participate in emission trading.” Business Strategy and the Environment, 16(1): 12-25. Pulver, S. 2007. “Making Sense of Corporate Environmentalism: An Environmental Contestation Approach to Analyzing the Causes
and Consequences of the Climate Change Policy Split in the Oil Industry.” Organization & Environment 20(1): 44-48. Pugliese, A. & Ray, J. 2009. Top-Emitting Countries Differ on Climate Change Threat. Gallup Inc.
Rankin, M., Windsor, C. & Wahyuni, D. 2011. “An investigation of voluntary corporate greenhouse gas emissions reporting in a market governance system: Australian evidence.” Accounting, auditing & accountability journal, 24(8): 1037-1070.
Reverte, C., 2009. “Determinants of Corporate Social Responsibility Disclosure Ratings by Spanish Listed Firms.” Journal of Business
Ethics, 88: 351-366.
Sangle, S. 2011. “Adoption of cleaner technology for climate proactivity a technology-firm- stakeholder framework.” Business Strategy
and the Environment, 20(6): 365–378.
Schneider, T. E. 2011. “Is environmental performance a determinant of bond pricing? Evidence from the U.S. pulp and paper and chemical industries.” Contemporary Accounting Research, 28(5): 1537–1561.
Stanny, E. 2013. “Voluntary disclosures of emissions by US firms.” Business Strategy and the Environment, 22(3): 145–158. United Nations (UN). 2015. Paris Agreement. Paris.
Stern, N. H. 2007. The Economics of Climate Change: The Stern Review. Cambridge: Cambridge University Press.
Weinhofer, G. & Hoffmann, V. H. 2010. „Mitigating climate change - how do corporate strategies differ?” Business Strategy and the
Environment, 19(2): 77-89.
Weinhofer, G. & Busch, T., 2013. “Corporate strategies for managing climate risks.” Business Strategy and the Environment, 22(2): 121-144.
Winn, M. I., Kirchgeorg, M., Griffiths, A., Linnenluecke M. K. & Günther, E. 2011. „Impacts from climate change on organizations: a conceptual foundation.” Business Strategy and the Environment, 20(3): 157–173.
Yunus, S., Elijido-Ten, E. & Abhayawansa, S. 2015. „Determinants of carbon management strategy adoption: evidence from Australia's top 200 publicly listed firms.” Managerial Auditing Journal, 31(2): 156-179.
ANNEX
Sample Composition
Country Frequency GICS-Sector Frequency
USA 87 Financials 60
Japan 30 Consumer Discretionary 41
Britain 23 Industrials 29
France 21 Consumer Staples 26
Germany 16 Technology 25
China 11 Health Care 22
South Korea 10 Energy 18
Spain 9 Utilities 16 Netherlands 8 Communication 12 Australia 7 Materials 12 Italy 6 261 Brazil 5 Taiwan 4 Canada 4 Ireland 4 Sweden 3 India 2 Russia 2 Mexico 1 Belgium 1 Luxembourg 1 Denmark 1 Finland 1 Israel 1 Thailand 1 Norway 1 Singapore 1 261
Conceptual Framework
Multicollinearity Testing
Variance Inflation Factor (VIF) Testing
Variable VIF 1/VIF
SocPress 2.37 0.42 Democ 2.23 0.45 FSize 1.85 0.54 BInd 1.58 0.63 CredPress 1.57 0.64 RegPress 1.54 0.65 ANS 1.49 0.67 CarInt 1.38 0.72 ROA 1.35 0.74 EnvCom 1.13 0.88 BSize 1.12 0.89 Mean VIF 1.60
Summarized Results of the Robustness Checks Model 4 ** Model 5 ** Control V. FSize FSizeRev ROA ANS GDP Democ 0.070*** (0.099) ** -0.002*** (0.689) ** -0.216*** (0.104) ** -0.037*** (0.429) ** 0.095*** (0.009) ** -0.001*** (0.935) ** -0.007*** (0.266) ** 0.002*** (0.964) ** Explanatory V. RegPress CredPress SocPress EnvCom BSize BInd 0.004*** (0.026) ** 0.001*** (0.884) ** 0.018*** (0.014) ** 0.123*** (0.019) ** 0.001*** (0.956) ** 0.001*** (0.742) ** 0.005*** (0.003) ** -0.025*** (0.026) ** 0.007*** (0.312) ** 0.148*** (0.011) ** 0.000*** (0.994) ** 0.000*** (0.834) ** CarInt EnvInd 0.350*** (0.000) ** 0.099*** (0.000) ** LR (p) 68.83*** (0.000) ** 70.65*** (0.000) ** Pseudo R2 0.2093 ** 0.3008 ** Correctly classified 78.54 %. 76.62 %.
Notes: Average Marginal Effects reported
N = 261 for Model 4; N = 201 for Model 5
Model 4 employs alternative proxies for FSize, ANS and CarInt Model 5 excludes firms from the financial sector
Univariate Analysis Spearman Correlations Variables 1 2 3 4 5 6 7 8 9 10 11 12 1. ICP 1.00*** 2. RegPress .214*** 1.00*** 3. CredPress -.102*** .047*** 1.00*** 4. SocPress .024*** -.228*** -.043*** 1.00*** 5. EnvCom .188*** -.075*** -.005*** .030*** 1.00*** 6. BSize .045*** .233*** .259*** -.135*** .016*** 1.00*** 7. BInd -.068*** -.433*** .034*** .238*** .234*** -.053*** 1.00*** 8. CarInt .325*** .078*** -.391*** .060*** .123*** -.001*** .013*** 1.00*** 9. FSize .105*** -.051*** .422*** -.067*** .063*** .185*** .053*** -.359*** 1.00*** 10. RoA -.100*** -.186*** -.404*** .170*** .064*** -.092*** .123*** .159*** -.524*** 1.00*** 11. ANS -.135*** -.214*** -.156*** -.536*** -.076*** -.031*** .004*** -.034*** -.075*** .145*** 1.00*** 12. Democ .091*** .275*** .029*** .392*** -.154*** .051*** .182*** .123*** -.039*** -.081*** -.278*** 1.00***
Note: N = 261 for all variables