i
Universidade de Trás-os-Montes e Alto Douro
Increasing strawberry (Fragaria x ananassa) polyphenol content:
Development and selection of new markers for Marker Assisted Selection based onco-localization of QTLs and e-QTLs
Dissertação de mestrado em Genética Molecular Comparativa
e Tecnológica
Octávio Manuel Ribeiro Serra
Orientador: Doutora Amparo Monfort Vives
Co-orientador: Professor Doutor Valdemar Pedrosa Carnide
ii
Universidade de Trás-os-Montes e Alto Douro
Increasing strawberry (Fragaria x ananassa) polyphenol content:
Development and selection of new markers for Marker Assisted Selection based onco-localization of QTLs and e-QTLs
Dissertação de mestrado em Genética Molecular Comparativa
e Tecnológica
Octávio Manuel Ribeiro Serra
Orientador: Doutora Amparo Monfort Vives
Co-orientador: Professor Doutor Valdemar Pedrosa Carnide
iii
Universidade de Trás-os-Montes e Alto Douro
Increasing strawberry (Fragaria x ananassa) polyphenol content:
Development and selection of new markers for Marker Assisted Selection based onco-localization of QTLs and e-QTLs
Dissertação de mestrado em Genética Molecular Comparativa
e Tecnológica
Octávio Manuel Ribeiro Serra
Orientador: Doutora Amparo Monfort Vives
Co-orientador: Professor Doutor Valdemar Pedrosa Carnide
Composição do Júri:
_____________________________________
_____________________________________
_____________________________________
_____________________________________
_____________________________________
Vila Real, 2013
iv
Agradecimentos
Este trabalho não teria sido possível sem o apoio e a colaboração de muitas pessoas, e como tal, cabe-me agradecer-lhes devidamente:
- ao Centre de Recerca en Agrigenòmica (CRAG) enquanto entidade acolhedora, que me deu condições para desenvolver a minha dissertação;
- à Amparo Monfort por me ter aceite como seu orientando e me ter proporcionado esta experiência magnifica. Pela excelente orientação que me deu e, sobretudo, pela amizade que ficou. Estou-lhe muito agradecido;
- a todo o pessoal do laboratório 3.03, principalmente à Joana pela grande ajuda que me deu no início do meu trabalho prático;
- ao Pablo Madriz e Jose Manuel, meus colegas de secretária, pelo acolhimento e por todo o intercâmbio de experiências;
- à Universidade de Trás-os-Montes e Alto Douro, na pessoa do magnífico Reitor, pelas condições oferecidas para a frequentação deste ciclo de estudos;
- ao Professor Valdemar Carnide pelo apoio e disponibilidade demonstrados, mesmo antes do início do trabalho prático;
- ao gabinete de relações internacionais e mobilidade (GRIM) e ao programa de mobilidade Erasmus pela ajuda no processo de mobilidade;
- à minha família por todo o apoio e preocupação e por me terem permitido realizar este desejo, que sem eles nunca teria sido possível;
- à Nídia, pela pessoa que tem sido nos últimos anos, mas sobretudo pela pessoa que foi nestes últimos meses. Certamente esta dissertação, tal como está, não teria sido possível sem ela, sem a sua companhia, a sua ajuda, e sem o seu afecto.
A todas estas pessoas e muitas outras que de certa forma me ajudaram neste percurso, um grande Obrigado.
v
Resumo
O morango (Fragaria L.) pertence à família Rosaceae, juntamente com outros frutos de elevada importância económica, como a maçã, o pêssego ou a cereja. Fragaria vesca (2n=2x=14) é uma espécie diploide cujo genoma já foi sequenciado (240Mb), sendo considerado um organismo modelo para o morango cultivado (Fragaria x ananassa), espécie octoploide (2n=8x=56). Os frutos silvestres em geral, e os morangos em particular, é conhecido pelo se perfil nutricional muito rico, especialmente em polifenois, o que lhes confere uma elevada capacidade antioxidante. Perceber as bases genéticas que controlam a produção destes compostos fenólicos é extremamente importante para a selecção de novas variedades com uma composição nutricional ainda mais rica.
Neste trabalho, através da técnica LC-MS, foi possível analisar os metabolitos fenólicos de frutos maduros de uma população F2 de morango resultante do cruzamento das variedades Camarosa x Dover, o que permitiu quantificar 22 metabolitos diferentes e mapear posteriormente 146 QTLs ao longo do mapa genético desta população. O mapa genético de ligamento CxD foi melhorado e possui actualmente 192 loci distribuídos ao longo dos 28 grupos de ligamento esperados, representando cada grupo homeólogo uma elevada cobertura (> 70%) quando comparado com a espécie F. vesca. Os níveis de expressão dos frutos maduros foram também avaliados com recurso a microarrays contendo os 35000 genes descritos para o genoma de F. vesca, hibridando-os com RNA de indivíduos da população F2. Os genes cujos níveis de expressão variaram significativamente foram seleccionados para uma análise de QTLs de expressão (e-QTLs) que permitiu detectar e mapear 333 e-QTLs.
A co-localização entre QTL metabólicos e QTLs de expressão indica uma possível implicação directa do gene candidato na produção do metabolito acumulado. Todas as co-localizações foram detectadas e os melhores resultados foram depois seleccionados para um estudo mais aprofundado, principalmente para tentar perceber o contexto biológico dessas co-localizações. Os marcadores que se encontravam perto da (ou até mesmo coincidindo com a) posição onde QTLs e e-QTLs se co-localizavam foram considerados como bons candidatos para a selecção assistida por marcadores (MAS)
Palavras-chave: Morangos, Fragaria x ananassa, Polifenóis, Loci de caracteres
vi
Abstract
Strawberries (Fragaria L.) belong to the Rosaceae family together with other economically important fruits like apple, peach or cherry. Fragaria vesca (2n=2x=14) is a diploid specie which genome has already been sequenced (240Mb) and is considered a model organism for cultivated strawberry (Fragaria x ananassa), an octoploid specie (2n=8x=56). In general all berries, including strawberries, are known for their rich nutritional profile, mainly for the high content in polyphenols which confers a greater antioxidant capacity. Understanding the genetic bases controlling the production of these phenolic compounds is extremely important for the selection of new varieties with a greater nutritional profile.
In this work, the LC-MS analysis for polyphenol metabolites in full ripen fruits from an F2 population of cultivated strawberry (Camarosa x Dover) allowed the quantification of 22 different metabolites and a further mapping of 146 QTLs in the genetic linkage map of this F2 population. CxD genetic linkage map has been improved, possessing now 192 loci distributed along the 28 expected linkage groups, representing each homeologous group a high coverage (>70%) when compared with the genome of Fragaria vesca. Similarly, the expression levels in the full ripen fruit were also analyzed with a microarray containing the 35000 genes described for the genome F. vesca hybridizing with RNA of the individuals of the population. Those genes which expression levels vary significantly have been selected for an analysis of expression QTLs (e-QTLs), which allowed the detection of 333 e-QTLs.
The co-localization between metabolomic QTLs and expression QTLs indicate a possible direct implication of the candidate gene and the accumulated metabolite. All co-localization were detected and the best results were then selected for a deeper analysis for trying to understand the biological context of those co-localizations. Target markers close to (or coinciding with) the position of QTLs and e-QTLs co-localization were considered as great candidates for marker assisted selection (MAS).
Keywords: Strawberry; Fragaria x ananassa, Polyphenols, Quatitative trait loci
vii
Index
Agradecimentos ... iv Resumo ... v Abstract ... vi Index ... vii Figure índex ... ix Table index ... xList of abbreviations ... xii
Introduction ... 1
Phylogenetic studies in Rosaceae and Fragaria ... 2
Fragaria x ananassa origin of breeding process ... 4
Molecular markers ... 5
The use of markers for linkage maps construction ... 6
Quantitative trait loci ... 7
Expression Quantitative Trait Loci ... 9
Marker assisted selection ... 9
Nutritional Quality of strawberry ... 10
Strawberries and health ... 11
Objectives ... 13
Material and methods ... 14
Plant population ... 15
Sample extraction and metabolomic analysis ... 15
Transcriptomic analysis and candidate gene selection ... 16
Primer design ... 17
DNA extraction and molecular marker genotyping ... 17
Map construction ... 17
viii
Results ... 19
Development of new SSR markers for Fragaria x ananassa ... 20
Improvement of F2 CxD genetic linkage map ... 22
Evidence of Fragaria vesca genome coverage ... 26
Metabolomic data and QTL mapping ... 28
Transcriptomic data and e-QTLs mapping ... 29
Co-localization of QTLs and e-QTLs ... 31
Validating the ultimate QTLs: Crossing the selected results from 2010 with 2012 data ... 35
Other QTLs ... 36
Discussion ... 38
Genetic linkage map improvement and evidence of F. vesca genome coverage ... 39
Selection of new markers for MAS based on co-localization of QTLs and e-QTLs ... 40
Down-regulated Anthocyanin locus in linkage groups 6 ... 40
Up-regulated Anthocyanins locus in homeologous LG3 ... 43
Down- regulated Phenylpropanoid locus in linkage groups 2... 46
A locus in linkage groups 7 regulate Pelargonidin-rutinoside production ... 48
Final topic ... 49
Conclusion and future work ... 51
Bibliography ... xiv
ix
Figure índex
Figure 1 - Scheme of the putative evolution of genomes and the origin of octoploid genome in Fragaria (Rousseau-Gueutin et al., 2009). ... 4 Figure 2 - Scheme representing the methodology employed for markers development. Green arrows represent the ideal path; grey arrows represent an alternative path through F. vesca genome (when no good results were obtained in F. x ananassa draft genome) and red arrows represent the exclusion of markers. ... 21 Figure 3 – Genetic linkage map of F2 CxD population. The new markers developed in this work are highlighted in green. ... 24 Figure 4 – Graphical representation of the coverage between F. vesca chromosomes (left) and F. x ananassa homeologous “A” (right) ... 27 Figure 5 – Distribution of transcriptomic data before and after transformation for the 15 expression patterns not following a normal distribution ... 32 Figure 6 - An example of a co-localization obtained with the first criterion. ... 33 Figure 7 - Example of QTL co-localization. a) An example of co-localization between Ellagic acid and gene05591, which is not considered a candidate gene for this metabolite. b) An example of co-localization of polyphenol data with organoleptic data. Full black bars are metabolomic data; Bars with diagonal lines represent transcriptomic data; Bars with crossed bars represent organoleptic data. ... 35 Figure 8 - Other QTLs obtained for a LOD threshold of 3.1 and co-localizing with already mapped markers. ... 37 Figure 9 - Gene ontology mapping and functional annotation of strawberry genes. The image shows the overrepresented gene ontology categories in strawberry fruit (Shulaev et al., 2011) ... xxi
x
Table index
Table 1 - New markers developed for F. x ananassa CxD F2 population ... 23
Table 2 - Percentage of F. vesca genome coverage (%) ... 27
Table 3 - Number of QTLs found in 2010 and 2012 and co-localization of QTLs in the two years, normal distribution of data for both years and the transformation applied. * QTL considered with IM method; ** co-localization in the same LG but in different positions. ... 30
Table 4 - Distribution of QTLs and e-QTLs obtained by homeologous and linkage groups (QTLs/e-QTLs) ... 31
Table 5 - Molecular markers candidates for Marker Assisted Selection for polyphenols increase in strawberry ... 50
Table 6 - Origin of the markers used in CxD F2 mapping population ... xxii
Table 7 - Characteristics of the improved CxD genetic linkage map. ... xxiii
Table 8 - Description of average size and number of markers for each LG... xxiii
Table 9 - The complete CxD genetic linkage map. The genotype of markers mean: “a” green for maternal genotype (Camarosa), “b” pink for paternal genotype (Dover), "d" for heterozygous or Camarosa, "c" for heterozygous or Dover and "h" for heterozygous. "-" means data not available. ... xxiv
Table 10 - Description of all QTLs obtained for 2010: linkage group and homeologous group, closest marker, position of QTL, LOD score, explanation of the variation (R2), effect on variation of the trait and information about its presence in any of the criterion used. ... xxviii
Table 11 - Description of all QTLs obtained for 2012: linkage group and homeologous group, closest marker, position of QTL, LOD score, explanation of the variation (R2), and the effect on the variation of the trait. ... xxxiii Table 12 - e-QTLs obtained for 2010 transcriptomic data analysis. Information about Linkage group, homeologous group, closest marker, position of e-QTL, LOD value, explanation of the variation (R2), effect on the variation of the trait and information
xi about its presence in any of the criterion used. The letter after the five digit number of a gene indicates an exon of that gene and not the entire gene since 2010 microarray was developed using ESTs and not complete sequence of genes. ... xxxv Table 13- e-QTLs obtained for 2012 transcriptomic data analysis. Information about Linkage group, homeologous group, closest marker, position of e-QTL, LOD value, explanation of the variation (R2) and effect on the variation of the trait. ... xlii Table 14 - Description of results obtained with the criteria employed in 2010 transcriptomic and metabolomic data ... xlvi Table 15 - Characteristics of CxD genetic linkage map before and after improvement ... lii Table 16 - List of the most significant genes for total polyphenols (p<0.01) and its function. All of these genes were also considered for 2010 e-QTL analysis ... liii Table 17 - List of genes selected for 2010 e-QTL analysis, the number of exons considered for each one and their function. ... lxiii Table 18 - List of genes selected for 2012 e-QTL analysis and their function. ... lxiv
xii
List of abbreviations
µM – micromolarAFLP – Amplified fragment length polymorphism ANOVA – Analysis of variance
ARF – Auxin response factor bHLH – Basic helix-loop-helix bp – Base pair
CIM – Composite interval mapping cM – Centimorgan
CRAG – Centre de Recerca en Agrigenòmica CTAB – Cetyltrimethylammonium bromide CVD – Cardiovascular diseases
DHAP – Dihydroxyacetone phosphate DNA – Deoxyribonucleic acid dNTP – Deoxynucleotide CxD – Camarosa x Dover
e-QTL – Expression quantitative trait loci GAP – Glyceraldehyde-3-phosphate Gb – Giga bases
GDR – Genome database for Rosaceae HG – Homeologous group
ITS – Internal transcribed spacer JA – Jasmonic acid
KW – Kruskal-Wallis
LC-MS – Liquid Chromatography - Mass Spectrometry LDL – Low-density lipoprotein
LG – Linkage group LOD – Logarithm of odds MAS – Marker assisted selection Mb – Mega bases
mM – millimolar
MQM – Multiple QTL mapping
NCBI – National Center for Biotechnology Information ng – nanogram
Ɵ – Maximum recombination rate PCR – Polymerase chain reaction PEP – Phospho-enol-pyruvate PPO – Polyphenol oxidase PVP – Polyvinylpyrrolidone QTL – Quantitative trait loci
RFPL – Restriction fragment length polymorphism RNA – Ribonucleic acid
rRNA – Ribosomal Ribonucleic acid
SIM/IM – Simple interval mapping or interval mapping SNP – Single nucleotide polymorphism
SSCP – Single-strand conformation polymorphism SSR – Simple sequence repeats or microsatellites STS – Sequence-tagged site
Ta – Annealing temperature TAC – Total antioxidant capacity Tm – Melting temperature
1
Introduction
2 Strawberries (genus Fragaria L.) are members of Rosaceae family together with other economically important genus like Prunus and Malus. Strawberries are perennial plants with capacity of regenerative propagation via production of runners. The fleshy fruit of strawberry is actually the expanded receptacle of the strawberry flower and the true fruit is the seed-like achenes in the surface of the receptacle.
Fragaria genus (basic chromosome number x = 7) comprise 20 wild species, 3 natural occurring hybrid species and 2 cultivated hybrid species (reviewed by Hummer et al., 2011). The woodland strawberry, Fragaria vesca (2n = 2x = 14) is considered a model organism for Rosaceae family due to its small genome (240 Mb), short generation time, ease vegetative propagation and small herbaceous stature. The genome of F. vesca has recently become available (Shulaev et al., 2011) and represents a huge tool for research in genetics and genomics of Rosaceae species.
The cultivated strawberry, Fragaria x ananassa (2n = 8x = 56) is a octoploid specie that was originated ~250 years ago, meaning that is one of the youngest crop species (Shulaev et al., 2011) and also one of the most complicated to study. Thus researchers have focused their efforts studying the diploid systems, mainly F. vesca (Cipriani et al., 2006).
Phylogenetic studies in Rosaceae and Fragaria
The Rosaceae family was previously divided into four subfamilies. That division was based in morphological characters, basically fruit morphology: Maloideae (fleshy fruit), Spiraoideae (dry dehinscent fruit), Amygdaloideae (fleshy one seed fruit) and Rosideae (indehiscent one seeded fruit) (Morgan et al., 1994; Potter et al., 2002). However some phylogenetic studies based on chloroplast and nuclear DNA sequences (Morgan et al., 1994; Evans et al., 2000; Potter et al., 2002) obtained discordant results and suggested that the existent classification for Rosaceae family did not reflect the true evolutionary relationships between its members.
Potter and colleagues (2007) proposed a new classification for Rosaceae family resultant of a deep phylogenetic analysis based on several combined sequence data. They
Introduction
3 recognized 3 subfamilies: Rosideae, Dryadoidera and Spiraeoideae, being themselves sub-divided into super-tribes, tribes and sub-tribes.
Phylogenetic studies within Fragaria genus also have an important role in understanding all Fragaria species origin and evolution. Until 1997 the strawberry taxa classification were based in isoenzyme variation, photosynthetic patterns, rooting systems and ecological and morphological variation, with few studies including Eurasian taxa (Harrison et al., 1997). The first approach to establish phylogenetic analysis in Fragaria was the use of restriction fragment length polymorphisms (RFLPs) in chloroplastidial DNA from 9 species done by Harrison and colleagues (1997). Later, Potter et al. (2000) tried to improve the phylogenetic resolution within Fragaria using noncoding regions from both chloroplastidial and nuclear DNA. They used the nuclear region of internal transcribed spacers (ITS) from rRNA genes and TrnL intron and TrnF spacer from chloroplastidial DNA. However, in the end none of these studies resulted in a high resolution phylogenetic tree, probably because of the little divergence of the genome regions investigated (Rousseau-Gueutin et al., 2009). Besides the improvement of the knowledge on Fragaria species evolution, the phylogenetic studies also had a particular target to aim for: try to understand the origin of the Fragaria octoploid genome.
The first proposed genome model for octoploid Fragaria species was in 1967 in a work developed by Sennanayake & Bringhurst. Based on cytological comparisons of penta-, hexa- and octoploid hybrids they concluded that the most probable genome model for octoploid species should be AAA‟A‟ BBBB. Their proposal was, at that time, generally accepted. However, further work in cytological and genetics of Fragaria led to the abandonment of 1967 genome model thesis. These studies suggested that the genomic structure of octoploid Fragaria species were highly diploidized, and Bringhurst (1990) proposed a reformulated model: AAA‟A‟ BBB‟B‟.
In a deep study on Fragaria phylogeny, Rousseau-Gueutin et al. (2009) were able to finally track some of the evolutionary pattern of octoploid species. They included for the first time almost all Fragaria species in their analysis and confirmed the distribution of diploid Fragaria species into 3 main clades (X, Y and Z), with clade Z representing only the specie F. iinumae (Figure 1). Also for the first time they used SSCP approach on cloned
Introduction
4 polyploid DNA fragments in order to discriminate the different copies of polyploid species. The data from this study, combined with the results of previous studies supported the theory that vesca-mandshurica genomic pool (Y1) was very likely the maternal genome donor in the allopolyploidization process of octoploid strawberry and F. iinumae (Z) was involved as paternal parent (Rousseau-Gueutin et al., 2009).
Fragaria x ananassa origin of breeding process
Until the 1600‟s the cultivation of strawberry in Europe was dominated by F. vesca. Later some clones of F. virginiana were brought from Canada and the European gardeners started to cultivate it. About 100 years later, French captain Amédée Frézier discovered the domesticated chilean clones of F. chiloensis in its passage by Chile and secretly brought some plants to Europe. After this period, in Brittany and along European gardens, unusual seedlings started to appear as a result of natural cross between F. virginiana and F. chiloensis. Finally in 1766, french botanist Antoine Nicholas Duchesne determined that
Figure 1 - Scheme of the putative evolution of genomes and the origin of octoploid genome in Fragaria (Rousseau-Gueutin et al., 2009).
Introduction
5 these plants were hybrids resultant from the 2 foreign species and named them Fragaria x ananassa because of its fruit flavor that resembled to pineapple (Hancock et al., 2008).
Molecular markers
Genetic markers represent the genetic differences between individuals or species. Normally these markers are located close to genes and act as signs or flags for those specific genes. There are three types of genetic markers (Collard et al., 2005): (1) morphological markers, which themselves are phenotypes or characters; (2) biochemical markers, like isoenzymes and storage proteins and (3) molecular markers which reveal variations in DNA sequence (i.e.SSRs, SNPs, or even cytogenetic markers). Molecular markers uncover neutral sites of variation in the DNA sequence, meaning that unlike morphological markers, these variations do not show themselves in the phenotype (Jones et al., 1997). During decades, the shift from phenotype-based towards genetic-based selection, highlighting the potential benefits of molecular markers linked to genes of interest, has been obvious. The advent of DNA-based genetic markers in late 1970‟s allowed researchers to identify a large number of markers across the genetic material of any specie and to detect associations between markers and traits for the first time (reviewed by Ruane & Sonnino, 2007).
Molecular markers are the most widely used markers mainly due to their abundance on the genome. Unlike morphological or biochemical markers, molecular markers are practically unlimited and are not affected by environment factors or development stage of the organism. Despite being used for linkage maps construction, they can be applied in plant breeding for cultivar identity or genetic diversity test (Winter & Kahl, 1995). Molecular markers can be particularly useful if they uncover differences between individuals of the same specie or from different species. These markers are known as polymorphic markers and can either be considered codominant or dominant, depending if they can discriminate between homozygous and heterozygous or not, respectively (Collard et al., 2005).
Single sequence repeats (SSRs) or microsatellites are tandemly repeated nucleotide motifs and are a common feature of eukaryotic genomes. The number of repeats is highly
Introduction
6 variable and their great level of allelic diversity make SSRs suitable for studies of closely related individuals (Ruane & Sonnino, 2007). At the chromosome level, SSRs provide excellent sequence tagged sites (STS) (Chambers & MacAvoy, 2000). Microsatellites are codominant markers and are technically simple to use, are robust and reliable and can be transferred between populations (Collard et al., 2005). However microsatellites require previous information on genetic sequence and sometimes fragment amplification is not easy by the presence of null aleles. In Fragaria, the first report of SSRs was by James et al. (2003) and since then many Fragaria-derived SSRs have been developed (Ashley et al., 2003; Sargent et al., 2003; Cipriani & Testolin, 2004; Hadonou et al., 2004; Lewers et al., 2005; Cipriani et al., 2006; Monfort et al., 2006).
The use of markers for linkage maps construction
Linkage maps represent the position and the relative genetic distances between markers, along the chromosome. Linkage maps construction is based on the analysis of many segregating markers and follows three main steps: (1) production of a mapping population; (2) identification of polymorphisms and (3) linkage analysis of markers. The parents selected for the mapping population should differ for one or more traits of interest. The population size in the preliminary genetic mapping studies normally range from 50 to 250 individuals. F2 populations and backcross populations are the simplest types of populations developed for self-pollinating species (Collard et al., 2005).
After identifying polymorphic markers, they must be screened across the entire population in a process known as “marker genotyping” of the population. In some polyploid species, identifying polymorphic markers is more complicated and requires the help of maps from diploid relatives (Ripol et al., 1999). The polymorphic markers detected in a mapping population normally are not distributed along the chromosomes; instead they cluster in some regions. The accuracy of measuring the genetic distance between markers, as well as determining marker order, is directly related with the number of individuals of the mapping population (Young et al., 2000). The linkage between markers is normally calculated using odds ratio; this ratio is often expressed as the logarithm of the ratio and is
Introduction
7 called logarithm of odds (LOD) value or LOD score. LOD values higher than 3 are normally used for linkage map construction (Collard et al., 2005).
The reference genetic linkage map for F. vesca was first developed in 2004 by Sargent and co-workers using a F2 population of 94 individuals, resultant from a cross of F.vesca x F. nubicola and consisted in 76 markers spawning a total genome length of 448 cM. Later, this map was improved for a total of 182 markers (175 SSRs, 6 gene specific markers and 1 sequence-characterized amplified region) and spawned a total of 424 cM (Sargent et al., 2006). Also, some linkage maps for octoploid Fragaria species started to be constructed, the first one based on AFLP markers (Lerceteau-Köhler et al., 2003). Later, Rousseau-Gueutin et al. (2009a) reported the development of a genetic linkage map, using AFLPs and SSRs, and they were able to define almost all the expected 28 linkage groups. Recently, a saturated linkage map for F. x ananassa has been developed, containing 549 loci distributed for the 28 linkage groups. This study also showed extensive regions of homozygosity along the linkage groups which can be explained by breeding and selection processes since specie origin (Sargent et al., 2012).
Quantitative trait loci
Several traits with importance for agriculture are controlled by many genes and are known as quantitative traits (or even polygenic, multifactorial and complex traits). The specific regions within genomes where genes related with a particular quantitative trait are located is called quantitative trait loci (QTL). QTL analysis is based on the association between phenotype and genotype of markers (Collard et al., 2005). There are three main methods for detecting QTLs: (1) single-marker analysis; (2) simple interval mapping analysis and (3) composite interval mapping analysis. In single marker analysis, statistical tests like t-test, analysis of variance (ANOVA) and linear regression are normally used. This method does not require a linkage map once it correlates each marker individually with the phenotypic variation (Tanksley, 1993). The simple interval mapping (SIM) method uses linkage maps to analyze the interval between adjacent pairs of linked markers along chromosomes and it is considered stronger than single-point analysis (Lander & Botstein, 1989). Composite interval mapping (CIM) is a method that combines interval mapping
Introduction
8 analysis with linear regression and includes additional genetic markers (cofactors) in the statistical model in addition to an adjacent pair of linked markers for interval mapping. CIM approach is more precise and effective than the previous ones, especially when linked QTLs are involved (Jansen & Stam, 1994).
In general terms, a QTL can be classified as “major” or “minor” as it explains more than 10% or less than 10% of phenotypic variation, respectively (Collard et al., 2005). In formal terms, and to avoid the flux of false positive QTLs, a QTL may be classified as (1) suggestive; (2) significant and (3) highly-significant, a classification proposed by Lander & Kruglyak (1995). Thus, significant and highly significant QTLs are those with a significance level of 95 and 99 % respectively, whereas a suggestive QTL is expected to occur once at random in a QTL study. Despite the initial skepticism about the accuracy of QTLs determining the position of genes controlling traits, there are already several studies confirming the accuracy of QTLs within 2 cM or less, enhancing the importance of past and future mapping experiments (Price, 2006). The success of using QTLs to increase genetic gain depends mainly on the magnitude of QTL effects, precise estimation of QTL positions, the stability of QTLs effect across several environments and whether QTLs are robust across relevant breeding germplasm. QTL studies, when performed with appropriate scale and precision, represent a powerful functional genomics approach (Moose & Mumm, 2008).
In the cultivated strawberry, the first wide QTL study for fruit quality parameters, like vitamin C, was reported by Moing et al. (2004). Furthermore this work was also the first to resort a large scale analysis tool for strawberry fruit metabolites, incorporating the metabolomics approach in QTL mapping. Other QTLs started to emerge for octoploid strawberry despite its genome complexity, mainly for fruit quality traits as texture related traits, fruit acidity and sugars (Lecerteau-Köhler et al., 2005). Other results were also reported in a recent study characterising QTL associated with fruit quality traits where about 36.0% of the QTL were stable over the years (Zorrilla-Fontanesi et al., 2011).
On the other hand, some QTLs for pathogen resistance in strawberry have also emerged, with putative QTLs for resistance to Colletotrichum acutatum and Phytophthora cactorum (Denoyes-Rothan et al., 2004).
Introduction
9 Expression Quantitative Trait Loci
Jansen and Nap (2001) were the first researchers to suggest the use of gene expression data in QTL analysis. Using the expression levels genes within a segregating population make it possible to map the inheritance of that expression patterns. Expression QTLs (e-QTLs) can be classified as cis or trans acting, depending on the location of the transcript compared with the location of the e-QTL influencing the expression of that transcript (Varshney et al., 2005). The e-QTL analysis of each gene considered in the segregating population allows the identification of regions in the genome influencing its expression (Varshney et al., 2005). In plants, e-QTL mapping studies were first reported in Arabidopsis (DeCook et al., 2006; Kliebenstein et al., 2006) and since then this approach have been applied to many important crop species as wheat (Jordan et al., 2007), barley (Potokina et al., 2008), rice (Wang et al., 2010) and maize (Holloway et al., 2011)
Marker assisted selection
Marker assisted selection (MAS) is a method of selection whereby a phenotype is chosen based on a genotype of a marker. The use of molecular markers is thought to increase breeding efficiency in approximately 2 fold when compared to phenotypic selection (Moose & Mumm, 2008). Generally, markers used for MAS are developed based on 3 main steps: high-resolution mapping, validation of markers and possibly marker conversion (Collard et al., 2005). The success of implementation MAS depends on the relationship between markers and genes: molecular markers can be within gene (the most favorable situation for MAS), marker can be in linkage disequilibrium (meaning that marker and gene are physically very close) and marker can be not in linkage disequilibrium (the worst situation for MAS) (Dekkers, 2004).
Mapping approaches use statistical methods and software developed for diploid species. Thus implementing MAS in polyploid species represents a big challenge, mainly because many important traits are explained by several QTLs, each one of them with a small effect on the phenotypic variation (Dal-bianco et al., 2012). There are several studies showing the successful implementation of MAS in important crop species, mainly in wheat and barley as reviewed by Miedaner and Korzun (2012), in maize (Hoisington &
Introduction
10 Melchinger, 2004), in tomato (Foolad & Panthee, 2012) and in potato (Ortega & Lopez-vizcon, 2012) and many others. In Rosaceae species, the implementation of MAS in breeding programs has been. However, efforts have been made in order to accelerate this process and there are already several projects aiming for application of MAS in Rosaceae species breeding (Iezzoni et al., 2010) as Prunus and Malus species.
Nutritional Quality of strawberry
Cultivated strawberry is an important source of bioactive compounds because of its high levels of folate, vitamin C and phenolic constituents. From a nutrient profile point of view, strawberry represents a very healthy food choice, with several studies relating strawberry consumption and lower incidence of chronic pathologies, obesity, infections, cardiovascular and neurological diseases and cancer (Giampieri et al., 2012 and references therein).
The micronutrient composition of strawberry makes this fruit one of the richest natural sources of essential micronutrients. The consumption of 250 g of strawberry represents the intake of 30% of the daily recommended allowances of folate and 144 g of this fruit equals to 20% of daily allowance of manganese. Besides these nutrients, strawberries are also considered a good source of iodine, magnesium, copper, iron, phosphorus and potassium (Giampieri et al., 2012).
Strawberries are not only rich in nutrients, they also represent a huge source of phytochemicals, mainly a large number of polymeric compounds (ellagitanins and gallotanins), and monomeric molecules (ellagic acid and its glycosides, anthocyanins, flavonols, catechins and phenylpropenoyl glycosides), which have a great biological potential in humans (Häkkinen & Törrönen, 2000; Kähkönen et al., 2001).
The antioxidant capacity of fruits is measured based on its composition of vitamin C and phenolic compounds. In what concerns to total phenolics and total antioxidant capacity (TAC), berries are 4 times greater than other fruits, 10 times greater than vegetables and 40 times greater than cereals (Halvorsen et al., 2002). Within its fruit group, strawberries have a greater antioxidant capacity (2 to 11 fold) than apples, peaches, grapes, oranges or
Introduction
11 kiwifruits (Wang et al., 1996). This high antioxidant capacity of strawberries was evaluated individually for each phytochemical compound and it was found that vitamin C is one of the most important components being responsible for 30% of TAC in strawberries, followed by anthocyanins, which represent 25% to 40% (Tulipani et al., 2008).
Strawberries and health
Studies of the impact of strawberry intake on health are few. However there is some evidence that strawberry-rich diet can positively affect risk factors of cardiovascular diseases (CVD). It was shown that ingestion of strawberries inhibits inflammation, improves endothelial function, inhibits platelet aggregation, improves plasma lipid profile, modulates the eicosanoid metabolism and free radical scavenging and increases low-density lipoprotein (LDL) resistance to oxidation (Youdim et al., 2000; Mazza, 2007; Basu et al., 2010). The high content of the antioxidant vitamin C that is present in strawberry fruits are commonly recognized as a major naturally occurring antioxidant in the diet with protective effects against various oxidative stress related diseases (Omaye & Zhang, 1998). Furthermore, there are also studies demonstrating the potential chemoprotective activities of berries. It was shown that strawberries and black raspberries can inhibit different types of cancer cell transformation and proliferation in vitro (Xue et al., 2001; Han et al., 2005). In addition, studies with animal models also showed a decrease in early and late progression of experimentally induced tumors related with extracts of strawberry, blackberry and black raspberry (Carlton et al., 2001; Kresty et al., 2001; Duncan et al., 2009). Thus, a great understanding of the mechanisms underlying the role of strawberries in health is needed in order to develop new functional food products to enable consumers to take advantage of the consumption of strawberries (Giampieri et al., 2012).
Introduction
12 FraGenomics, “Genetical Genomics for strawberry fruit quality and health” is an international European project from Plant KBBE call, where the interest is to obtain genetics, metabolomic and transcriptomic data of two diferent strawberry populations (Spanish and French) and a cultivar collection, in order to detect new markers for apply in MAS after QTL and e-QTL colocalization. At the moment of start of this thesis work, genetic, metabolomic and transcriptomic data were obtained and the global analysis of all data was the interest of this work.
13
Objectives
The main goal of this thesis work was to develop new markers for increase polyphenol content in octoploid strawberry (F. x ananassa) through marker assisted selection. To achieve it, the following objectives were proposed:
1. Development of new microsatellites for strawberry (F. x ananassa) close to candidate genes for polyphenol production;
2. Improvement of the already existent genetic linkage map of strawberry (F. x ananassa);
3. The study of metabolomic quantitative trait loci for 2 different years; 4. The study of expression quantitative trait loci for 2 different years;
5. Search of co-localizations and maintenance of QTLs in both years and selection of markers for Marker Assisted Selection.
Materials and methods
15
Plant population
This work was performed with 93 individuals from a F2 segregating population. This population was generated from the self-pollination of a hybrid line (F1) resultant from the cross of maternal parent “Camarosa” (a commercial cultivar) and paternal parent “Dover” varieties. Parents were selected based on its genetic distance (the more distant) and also based on the fruit quality differences. “Camarosa” is a very productive strawberry line and it is known for its high acidity and firmness. “Dover” is a rustic line highly resistant to fungi attack. The mapping population was grown in the strawberry producing area of Huelva (Spain) under commercial conditions during two years, in 2010 and 2012. All the traits were evaluated from five randomly harvested mature fruit per genotype. The ripe fruit were harvested at maturity, i.e. when they have attained a homogenous red coloration.
Sample extraction and metabolomic analysis
Ripe fruits were harvested from 50 individuals in 2010 and 28 individuals in 2012 belonging to the F2 segregating population cultivated in south of Spain. Fruits were frozen,
lyophilized and then homogenized. Metabolite analysis was performed by Wilfried Schwab group from Technische Universität München. Samples were analyzed by Liquid chromatography-Electrospray ionization-Mass spectrometry technique (LC-MS) for quantification of strawberry fruit phenolics. A more detailed description of the methodology employed in the extraction of strawberry fruit phenolics can be found in Ring et al. (2013) For each individual and for each compound, metabolomic analysis was done with 2 replicas. A total of 22 metabolic traits were quantified, namely Pelargonidin glucoside, Pelargonidin rutinoside, Pelargonidin malonyl glucoside, Cyanidin gludocise, Epiafzelechin-Pelargonidin-glucoside, p-cumaroyl glucose / -glucoside, caffeoyl glucose, feruloyl glucose, Cinnamoyl glucose, Kaempferol-glucoside, Kaempferol-glucuronide, Quercetin glucuronide, Kaempferol-cumaryl-glucoside, 4-hydroxy-2,5-dimethyl-3(2H)-furanone gucoside (Furaneol), Ascorbic Acid, Citric Acid, Ellagic Acid, p-OH-benzoyl glucose, Catechin, (Epi)Catechin -> (epi)catechin (Isomer 1and2), (Epi)Afzelechin -> (epi)catechin (Isomer1and2), Epiafzelechin glucoside.
Materials and methods
16
Transcriptomic analysis and candidate gene selection
The analysis of transcriptomic data was performed by UCO-UMA group, coordinated by Juan Muñoz-Blanco. For 2010 data, a custom-made oligo-based (60 mer length) platform representing a total of 18.162 unigenes of Fragaria x ananassa was designed (NimbleGen Systems Inc, Basel, Switzerland) from the non-redundant sequences. For each of the sequences 4 oligos were printed per block and four blocks were printed for each data set. Total RNA samples were treated with DNAse I and purified by QIAGEN columns (Qiagen, Hilden, Germany) according to the manufacturer‟s instructions. Labeling (Cy3) of samples, hybridization and data normalization were performed according to the procedures described in the expression analysis section published by NimbleGen Systems Inc (http://www.nimblegen.com/). Detailed information on microarray procedures can be seen in Ring et al. (2013). For 2012 data analysis, a new array was developed representing all 35234 genes of F. vesca genome. Each oligo-sequence as 62 bp in length and each spot was built with 4 oligos. This array also had 262 specific genes of F. x ananassa (genes not present in F. vesca genome) and 50 genes used as control genes. For both arrays the results were confirmed performing the hybridization of 2 biological replicas for all samples. The candidate gene selection was based on the comparison of each metabolite profile with transcriptomic (expression) data for all the samples analyzed. Two different statistical methods (t-test and Pearson) were performed for both arrays considering significance levels of 0.05 and 0.01. In 2010, genes that showed significance in both replicas were selected as candidate genes for total polyphenols. However, in 2012 were only selected those genes that demonstrated to be significant for both years and in both replicas. Furthermore, in 2012 were selected the most likely candidate genes for specific traits (like ellagic acid, furaneol, pelargonidin-rutinoside, total anthocyanins, phenylpropanoids and total polyphenols) and not only for total polyphenol as in 2010.
Materials and methods
17
Primer design
Primers were designed with Primer3plus (Untergasser et al., 2007) (www.bioinformatics.nl/primer3plus/), under the following settings (1) size: 19-22 pb (2) Tm: 550C-650C (3) %GC: 50%-60%. The product size range was initial selected for 120-300bp. When no results were obtained, it was considered amplification products until 400bp in length. The targeted region for amplification always included the entire microsatellite repetition. The quality of the primers was analyzed using the Primer Check tool, from Primer3Plus. A M13 labeled primer with 17 bp (5´ GTAAAACGACGGCCAGT 3´) was added to all forward primers to allow further hybridization with a unique fluorescent labeled primer on PCR reactions.
DNA extraction and molecular marker genotyping
The DNA was extracted from strawberry leaves using the CTAB method (Doyle & Doyle 1990) modified to strawberry adding 2% of polyvinylpyrrolidone (PVP). The PCR M13-tail primer reactions were performed with a 10 µl final volume, containing: 10 ng of genomic DNA, 1X PCR buffer, 1.5 mM MgCl2, 0.2 mM each dNTP, 0.5 U Taq polymerase
(Invitrogen®) and 0.15 μM primer forward, 0.2 μM primer reverse, 0.2 μM M13 labeled primer. The PCR conditions were: an initial denaturation step of 95oC (2 min), then 10 cycles of 95oC (30s), primer annealing temperature (30s) and 72oC (45s) to extension step, followed by M13 labeled primer annealing step, 25 cycles of 95oC (30s), 50oC (30s) and 72oC (45s), and then a final elongation step of 72oC for 12 minutes.
The PCR products were analyzed on an ABI Prism 3130xl semi-automated sequencer and the generated data was then collected and analyzed using Genemapper 4.0 (Applied Biosystems) software.
Map construction
The genetic linkage map CxD was constructed with MapMaker/EXP 3.0 (Lander et al., 1987) with a minimum LOD score of 3.0 and a maximum recombination rate (θ) of 0.30 using the Kosambi mapping function. Markers with „suspect linkage‟ were inspected
Materials and methods
18 again for accuracy in scoring and removed from the map calculation if still problematic. Markers with “errors” were checked again in order to correct those errors. The seven homeologous groups (HG) were named 1 to 7 as diploid reference map, followed by an A, B, C or D for each of the four homeology linkage groups. These homeology linkage groups were scored by F. vesca genome coverage, being “A” those who cover the most and “D” those who cover the less.
QTL analysis
Metabolic and transcriptomic data were statistically analyzed with different modules of JMP 8.0 software package (SAS Institute, Cary, NC, U.S.A.). Skewness and Kurtosis were calculated and the Shapiro-Wilk test (Shapiro & Wilk, 1965) was applied to check for normality. Data that do not fit normality were tested with several different transformations, namely Log10 and square root, and the one that gave the least skewed result was used for further QTL analysis, as described in Zorrilla-Fontanesi et al. (2012). QTLs and expression-QTLs detection was performed using MapQTL 4.0® software (Van Ooijen et al., 2000). For 2010 metabolomic data, a genome-wide LOD significance was obtained for each parameter through permutation test based in 1000 replications. Three different QTL detection methods were employed, the non-parametric Kruskal-Wallis (KW) test, the Interval Mapping (IM) and the Multiple QTL Mapping (MQM) tools. A first look for QTLs was performed with KW and IM, being the most significant markers selected as co-factors for MQM analysis. For 2010 transcriptomic data as well as for 2012 metabolomic and transcriptomic data, it was employed Kruskal-Wallis and Interval Mapping analysis.
Results
20
Development of new SSR markers for Fragaria x ananassa
The selection of the most likely candidate genes from 2010 array for total polyphenols resulted in a list of 254 genes (table 16, annex). These genes were selected because of its highly significant fold change (p<0.01) with respect to the content of polyphenols found. A selection of 15 genes involved in polyphenol metabolism was made from the 254 candidate genes for total polyphenols. This selection was based on the function of each gene individually. Initially, all genes were categorized following the gene ontology mapping and functional annotation of strawberry genes (Figure 9, annex). Then only genes related with metabolic processes were considered and the 15 which function was, theoretically, most likely involved in polyphenol production were selected.
After the hybridization of the second array, in 2012, the statistically more significant genes for furaneol and ellagic acid were analyzed by the UCO-UMA group, through a Pearson and t-test analysis for each year and each array. Based on the number of times that a gene appears significant – the sum of times that a gene is significant in the different individual analysis –a list of genes was created by level of significance for both furaneol and ellagic acid. Once these lists contained hundreds of genes, it was necessary to reduce the target genes for marker development. Thus, the function of the top significant genes was checked and those which function was, theoretically, associated with the trait (furaneol or ellagic acid) were selected. Since all statistical analysis made by UCO-UMA group were performed also for the French breeding population, the significance level of the top significant genes for the Spanish population was also checked in the French population lists. At the end 6 genes (significant in both Spanish and French population lists and which function was associated with the trait) were selected, 4 for ellagic acid and 2 for furaneol. In total, 21 genes with high probability of being involved in polyphenol metabolism were used to design new primers, 15 from 2010 statistical analysis and 6 from 2012 statistical analysis. A scheme of the strategy used for marker development is showed in figure 2.
Results
21
Figure 2 - Scheme representing the methodology employed for markers development. Green arrows represent the ideal path; grey arrows represent an alternative path through F. vesca genome (when no good results were obtained in F. x ananassa draft genome) and red arrows represent the exclusion of markers.
The sequence of the 21 selected genes was then blasted against the draft genome of F. x ananassa available in CRAG database. This draft of Next Generation Sequence was built with 1 run of Illumina, with an output of 100 Gb, using the genome of individual 34 from F2 population in study (the most homozygous individual). The genome is assembled but not annotated and has a genome coverage of 150x. For those genes with good match in this blast, the correspondent(s) contig(s) were selected for microsatellite search. Gene with bad matches –or no matches- were blasted against the version 1.1 of F. vesca genome, publically available at Genome Database for Rosacea1. The region around blast match was considered (up to 50 kb upstream and downstream) for microsatellite search. At this point, 3 from the 21 genes considered had to be excluded because gene sequences were widespread in the genome, not being chromosome-specific. Together, the resulting contigs of F. x ananassa and genomic regions of F. vesca were submitted to a tandem repeat search
1http://www.rosaceae.org/bio/content?title=&url=%2Fcgi-bin%2Fgdr%2Fgdr_blast
Blast against octoploid draft
Good match?
SSR search close to the gene through TRF Select the good contigs
Marker genotyping Design primers flanking
SSR with primer3plus MAP Search for polymorphism s Good match? Blast in F. vesca genome
Results
22 using tandem repeat finder2. After the search, the region with the best microsatellite was picked for primer design with primer3plus3 web tool. A total of 18 primer pairs were tested in the 93 individuals of CxD F2 population and polymorphic markers were selected for mapping. Table 1 shows the general information of the new markers developed. From the 18 markers 2 were indels (which showed no polymorphism) and 16 were SSRs, with 12 being polymorphic meaning a 67% polymorphism rate. These polymorphic markers were then tested for mapping in the already existent CxD F2 genetic linkage map. At the end 8 of the 12 polymorphic markers were mapped. The nomenclature of the markers is explained as “C” for “CRAG”, “Fa” for “F. x ananassa”, “Fv” for “F. vesca”, “g” for “gene” and “Ctg, CL or C” for “Contig”.
Improvement of F2 CxD genetic linkage map
The already existent genetic linkage map comprised a total of 95 SSR markers and 149 loci distributed along the expected 28 linkage groups, spawning a cumulative genome length of 1774 cM. A description of the origin, position and distances of markers as well as general information of the map are available in tables 6, 7 and 8, in annex. In the mapping process, as new markers were being mapped, some of the already existent unmapped markers were also taken into account for another mapping attempt. The mapping strategy was based on the use of “TRY” command for introducing new markers, followed by “RIPPLE” command to ensure the new marker added was in correct position. Furthermore, marker position was also checked based on its position on F. vesca physical map. In the end, CxD map had a total of 131 markers (SSRs and genes), 192 loci distributed along the expected 28 linkage groups, with a cumulative genome length of 2323 cM (figure 3). The genotype of all markers present in CxD genetic linkage map can be seen in table 9, in annex. The improvement of the map represents 27% more markers and 22% more loci.
2http://tandem.bu.edu/trf/trf.html
Results
23
Table 1 - New markers developed for F. x ananassa CxD F2 population
Marker Specie Primer F Primer R Ta (Co) Motif Fragment
expected
Marker
polymorphic Mapped LG
CFaC32A3R F. x ananassa AGGTTCTTGCTTCTGCAACC CTCTGGGGCAGAGAATGCTT 55 (C)29 183 bp yes yes 5
CFaCL15769 F. x ananassa TGTGGTCCACGTATGGTGGT TCACAAAAGGCTGCAGAGGA 57 (TAG)11 259 bp yes no -
CFaCL17052 F. x ananassa GTGCGAACCAATGAGAAGCA CTGCACAGGCAACCGAGAT 57 (AG)18 164 bp yes yes 2
CFaCtg01960 F. x ananassa TGGACTGGAGACTCGCACAT TTGGCCACTCAGTTTTACGC 56 (AG)16 300 bp yes yes 6
CFaCtg02329 F. x ananassa ATGGTCTGCACTGCCAAGAA CAATCCCCACCATCCACTTT 57 (GTGAGGA)4 298 bp yes no -
CFaCtg101 F. x ananassa TTCCTTAGGGGAGCCTTTCT GGAAGACGGAGCCCTTCTAGT 54 (C)36 419 bp yes yes 7
CFaCtg11602 F. x ananassa GCTGGGCCTGAGAAAACAAG CAGGAGAAGAAGGCGAGGAA 57 (CT)16 281 bp yes yes 3
CFactg12006 F. x ananassa TGGTCACACGTGGGAATGAC TGGTCTGCATGCCTAGCTTC 57 (GA)12 179 bp yes yes 7
CFaCtg1900 F. x ananassa GCAAGAGAAGCCACCCAATC ATGGCTGCTGAGGCTTTAGG 57 (AG)24 282 bp no - -
CFaCtg19934 F. x ananassa GGCAGCACATGTTTGGAGAA TGCCAAGGCTTGTCTTCATC 56 (GAGAAT)4 144 bp no - -
CFaCtg5196 F. x ananassa TCGTAGCCATGGTGAGACTG TGTCGCTAGACCAAACGGTA 54 (AT)15 296 bp no - -
CFaCtg5386 F. x ananassa ACCGACTCTTGTCTCTCTTCTC CGGATCCATTTATCCCTGCT 52 indel 191 bp no - -
CFaCtg5772 F. x ananassa TCCGTTTGTAGGACTTGTGG CCAGGTACAAAAAGCCTTCG 54 indel 287 bp no - -
CFag13877 F. x ananassa CTGGAAAGCCGGAAATCATC GTGGGAACAACCGAACATCA 57 (ATTT)7 175 bp no - -
CFag18539 F. x ananassa GTGTCACCCATCCCACTTCA CGGGGATTTGGGAAAGAGAT 57 (TC)15 188 bp yes yes 3
CFag26550 F. x ananassa TCTCAACAGCTCCCACCTTTC CGATATGGGCAAGATACAGTCC 56 (C)38 317 bp yes no -
CFvg26673 F. vesca GAATGGTAGCCCCGATTGAA CCGAGTGACCACAAGATCCA 59 (AT)26 317 bp yes no -
Results
24
DxC genetic linkage map
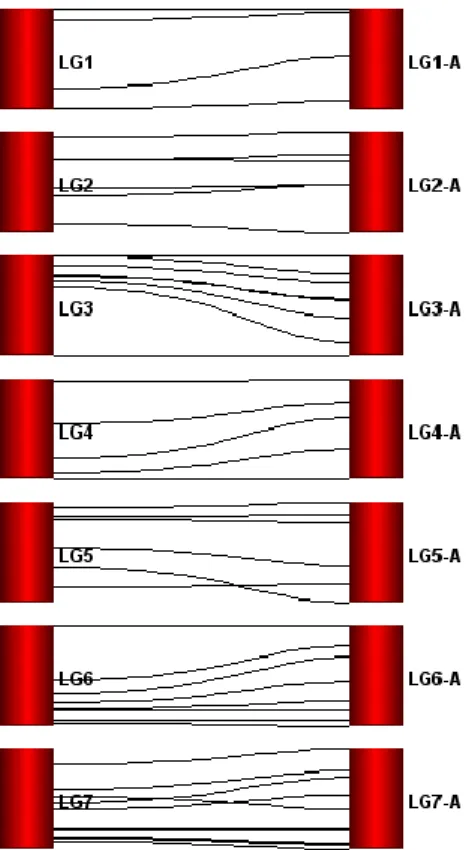
EMFvi72A 0,0 EMFn49Fc CFaRGLABc 1,6 CFACT26A1 37,3 CFACT59B 55,3 CFACT31A1 71,8 CFACT89A1 80,3 LG1-A EMFvi72C 0,0 EMFn49C2 26,6 UDF18 26,8 CFV164ABc 50,3 LG1-B EMFvi72D1 0,0 EMFn49ABc 5,5 CFACT21A 38,1 EMFn136ABc UDF02 38,6 CFVCT5B 52,9 LG1-C EMFvi72B2 0,0 EMFn49E 18,9 CFVCT5CD3c 46,1 LG1-D CFVCT20 0,0 CFACT84B 22,2 EMFn148ABc 29,1 BFACT2D2 CFVCT15B 54,5 CFaCL17052B 72,5 ARSFL17B2 103,7 LG2-A CFACT16c 0,0 CFACT84A2 25,7 CFVCT15C 34,0 BFACT2B 40,3 Fvi11B2 71,6 EMFv22Ac 72,3 LG2-B ARSFL15A3c 0,0 BFACT2C2 10,7 CFACT36A2c 18,3 Fvi11Ac 29,0 CFV183 50,1 BFACT39B2 67,2 CFACT111B2 70,0 EMFxa379Ac 71,4 LG2-C UFFxa03ABc 0,0 EMFv183ABc 35,6 CFACT111A2 46,6 BFACT39A2 ARSFL17A1 57,6 EMFxa379BC3c 70,5 LG2-D CFvg676CGdD1 0,0 CFvCL317CGfB2 13,8 CFvg30431f2 22,1 CFvg235eD 34,5 CFACT74B2 35,6 BFACT43A3c 50,1 CFACT42B 71,1 CFACT37CD3c 81,6 LG3-A CFACT20C2 0,0 CFACT87A1 0,2 CFACT37ABc UDF04 19,5 CFag18539d2 25,9 CFvg235eJ 32,9 EMFv20A2 CFACT99A2 67,1 LG3-B CFvg676CGdA 0,0 CFACT87B1 20,7 CFACT74A 55,8 BFACT36Bc 68,0 CFACT99C1 77,2 CFVCT11AB4c 103,8 LG3-C CFvg317CGdF2 0,0 CFvg676CGdFGc 8,0 CFACT20B2 28,9 CFvc71653A2 57,1 CFaCtg11602c1 66,9 CFACT99B2c 102,3 CFvg235eG2 110,5 CFACT42A2c CFVCT22A3c 119,0 CFVCT35A2 138,0 LG3-D
Figure 3 – Genetic linkage map of F2 CxD population. The new markers developed in this work are highlighted in green.
Results 25 CFACT103B 0,0 CFV3135CDc 24,8 CFACT102B1 41,0 EMFvi136A1 71,9 UDF08A2 105,3 LG4-A CFvc12750ABc 0,0 EMFv07A2 8,1 CFVCT14c 9,0 CFvCL4463A1 34,2 BFACT8ABc 47,1 LG4-B CFACT22A2 0,0 UDF08C1 39,8 CFV3135ABc 52,1 CFRA1441A2 88,6 LG4-C CFACT103A 0,0 EMFv07Bc 2,8 CFACT18A2 14,9 CFVCT5A2 21,3 CFV3135E2 EMFv08AB4c 25,2 LG4-D CFV3132A2c 0,0 CFACT104C2 10,1 CFACT106A1 15,9 EMFn110A1 16,2 CFa318C1b2 49,5 CFvCL2450bA2 64,8 CFACT88ACc 79,0 LG5-A CFV3821A2 0,0 CFACT64B2 32,2 EMFvi18A2 CFaC32A3RB 34,3 CFVCT3AB3c 49,6 CFACT17A2c 59,7 CFACT19B 73,5 CFACT96C1 125,2 UDF03C 129,3 LG5-B CFACT88B 0,0 CFRA2456A2c 9,5 CFACT95C3c 46,4 EMFv24A1 64,6 CFACT104B4c 84,7 CFVCT3CD4c 110,9 UDF03B2 123,3 LG5-C UDF09Bc 0,0 CFVCT24B1 19,9 UDF06c 23,5 CFV3821Cc 37,2 UDF03A1 47,7 CFACT82B1 74,0 CFvg676CGdC1 87,4 LG5-D F ig u re 3 – (c o n ti n u ed ) ARSFL7A2 0,0 Fvi20A1 22,1 CFACT19C1 33,3 CMYBRE2 33,5 CFVCT17 60,2 EMFv10A3c 82,3 FAC12aB 91,7 UFFxa01A1 100,5 CFACT65A1 107,5 LG6-A CFvCL645A1 0,0 ARSFL7C2c 19,6 CFaCtg01960A1 45,9 CFa318C2cA2 72,2 CFACT41A2 75,4 CMYBRF1 77,8 BFACT47A2 93,1 CMYBA1 93,2 FAC12aA1 102,9 EMFn117Ac 119,1 LG6-B CFaCtg01960C1 0,0 EMFn117B1 15,8 CFACT41C1 30,5 EMFn17ABc 63,9 EMFv160bcA1 88,5 CMYBB 88,6 CFACT75B1 116,9 LG6-C CFACT64A2 0,0 CFACT76A3c 22,9 ARSFL7B2 35,9 EMFn117C2 67,4 CFACT41D2 85,5 CFACT29A1 90,2 CFvc18629A1 109,7 CFvCL11167bA1 110,9 LG6-D
Results
26
Evidence of Fragaria vesca genome coverage
After mapping 36 new markers – 8 developed in this work and 28 already existent that were unmapped – the genome coverage of this map, when compared with F. vesca genome, was questioned. In order to verify that coverage, primer sequences of all mapped markers were blasted against F. vesca genome in both NCBI blast and GDR batch blast. The physical position of each marker was annotated and confronted with existent genetic linkage map. A high coverage was found between this map and the physical map, in some cases with linkage groups covering 99% of F. vesca chromosomes. The homeologous groups belonging to CxD map were then ordered based on the percentage of coverage (table 2). Thus, homeologous “A” have a greater coverage than homeologous “B” and so on (A>B>C>D). Figure 4 reveals, graphically, the overall coverage between homeologous “A” and F. vesca chromosomes. The average of genome coverage for the entire map is 72,4%, with linkage group 3-A being the most representative – 99% comparing with F. vesca chromosome 3 – and linkage group 7-D
Figure 3 – (continued) EMFn201A2 0,0 CFACT85B 24,5 BFACT4ABc 32,8 CFvCL1103CDc 53,2 CFV3117Ac 70,2 CFRA2385C 92,2 CFaCtg12006b 109,2 EMFv23A 109,5 CFVCT23B 116,0 LG7-A CFACT78A 0,0 CFvg61085c 3,4 CFV3117B2 13,8 BFACT29A2 CFvCL1103A1 20,5 CFAEXPA3c 38,1 CFRA2385G 40,5 CFaCtg101C 48,4 ARSFL99ABc 50,7 CFvCL19157A 84,8 LG7-B CFV3117E1 0,0 CFV3087A2 0,1 CFRA2385E1 14,9 BFACT44B2 17,9 CFAEXPBCc 20,0 CFVCT23A1 30,0 LG7-C CFACT85A2 CFV3117C1 0,0 CFACT30A2 7,4 CFV3096A3c 14,7 LG7-D
Results
27 the less representative – 17%. Another important point is that only 4 of the 28 linkage groups represent less than 50% of its equivalent in F. vesca.
Table 2 - Percentage of F. vesca genome coverage (%)
Markers CFACT59B, CFaCL17052B and CFaCtg11602c1 showed no match in both blasts, indicating that they are not present in F. vesca genome. Some markers also showed different positions on the linkage groups, which may indicate some kind of rearrangements during octoploid genome evolution.
LG A B C D 1 98 97 73 73 2 86 83 30 24 3 99 86 85 79 4 98 79 69 62 5 80 72 65 54 6 96 85 71 69 7 77 74 46 17
Figure 4 – Graphical representation of the coverage between F. vesca chromosomes (left) and F. x ananassa homeologous “A” (right)
Results
28
Metabolomic data and QTL mapping
The 22 compounds studied were used individually and 5 general parameters (organic acids, flavonols, anthocyanins, phenylpropanoids and total polyphenols) were also considered for QTL analysis for both years. Metabolomic data of 2010 and 2012 were obtained by Liquid chromatography-Electrospray ionization-Mass spectrometry technique (LC-MS) for quantification of strawberry fruit phenolics. In the first year were used 50 individuals for LC-MS analysis and in the second year were used 28. All 27 parameters were checked for normal distribution in both years (table 3). For 2010, 3 parameters (epiafzelechin glucoside, flavonols and kaempferol cumaryl glucoside) did not follow a normal distribution and for 2012 data, 9 parameters (caffeoyl glucose, cyanidin gludocise, epiafzelechin glucoside, flavonols, kaempferol cumaryl glucoside, kaempferol glucoside, kaempferol glucuronide, pelargonidin malonyl glucoside and pelargonidin Rutinoside) also had an abnormal distribution. All data not following a normal distribution – values of Skewness and Kurtosis out of the range -1 to 1 and a P-value lower than 0.05 in Shapiro-Wilk test – were transformed (table 3). For 2010, 116 QTLs were found across 27 linkage groups for 25 of the 27 parameters considered. In what concerns 2012 data, 30 QTLs were detected along 12 linkage groups for 15 of the 27 parameters. Is also important to note that linkage groups 1 and 4 accumulate less QTLs and linkage groups 3 5 and 6 are those that accumulate most QTLs. A complete description of all QTLs obtained can be found in tables 10 and 11, in annex. An overview of the QTLs detected in each linkage group for the two years can be seen in table 4. It is important to note that some QTLs were found in the same position for both analyses, reinforcing the role of specific loci for some parameters. The difference on the number of QTLs detected between the two years can be explained by the fact that QTL analysis method for 2012 was Interval Mapping (IM), which detects only major QTLs. For 2010 a Multiple QTL Mapping (MQM) approach was performed which detects also the effect of “secondary” markers that may contribute for the parameters in study (equivalent method of composite interval mapping – CIM). The option of using different methods for QTL detection is directly related with the fact that, in 2010, metabolic data available covered more than half of the population in study (50 individuals in 93) and in 2012 only 28 individuals were considered for metabolic analysis. Thus, the most complex and picky method (MQM) was performed in the more reliable data and IM in the less reliable (because it‟s a simpler method).
Results
29 A permutation test, for 2010 data only, was performed in order to establish the LOD threshold (the LOD value above which a QTL can be considered). The permutation test consisted in 1000 permutations and a LOD threshold of 3.1 was obtained for a genome-wide significance of 95%. For a lower significance (90%) the LOD threshold obtained was 2.7. Despite these values, a QTL was considered whenever the LOD value was higher than 2 in order to do not discard any further co-localization between QTLs of both years.
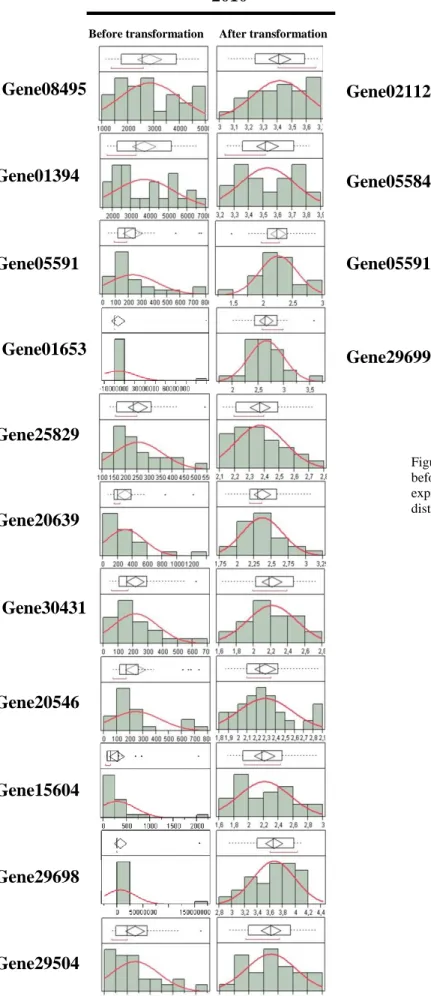
Transcriptomic data and e-QTLs mapping
Transcriptomic data obtained by microarray analysis in 2010 and 2012 was used for e-QTL detection. In the first year, 27 individuals were used for microarray hybridization and in 2012, 20 individuals. As described previously in Materials and Methods, the expression pattern of all genes in the array was correlated with metabolites variation by UCO-UMA group. Two statistical approaches (Pearson and t-test) were employed for both years and arrays in order to find candidate genes for the metabolites in study. Prior to that analysis, and taking in account the gene function and the gene significance also in french population, a final list of the most likely candidate genes for the target traits explored here was created for each year. For 2010 a total of 272 candidate genes for polyphenol related metabolites were considered and for 2012, 95 were used. The normal distribution of the data was checked for all candidate genes in both years, with the same procedure as used for metabolomic data. From the total 367 candidate genes considered for both years, 15 did not follow a normal distribution, 11 genes for 2010 data and 4 for 2012 (Figure 5). Data not following a normal distribution was transformed based on the values of Skewness and Kurtosis, as described before for metabolomic data transformation. After transformation, all data was subjected to e-QTL search; Table 4 synthetizes the distribution of all e-e-QTLs obtained for the two years along the homeologous and linkage groups. A complete and exhaustive description of all e-QTLs found for both years can be found in tables 12 and 13, in annex. The method employed for e-QTL analysis was interval mapping due to the low number of individuals that were used for array hybridization. Again, as metabolomic data, a LOD values above 2 was considered as a QTL in order to considered all possible further co-localizations in analysis and discussion of the results. It was obtained 221 e-QTLs out of 272 candidate genes for 2010, distributed along 25 linkage groups.