Aerosol and Air Quality Research, 13: 1521–1535, 2013 Copyright © Taiwan Association for Aerosol Research ISSN: 1680-8584 print / 2071-1409 online
doi: 10.4209/aaqr.2012.11.0321
Comfort Parameters and Particulate Matter (PM
10and PM
2.5) in School
Classrooms and Outdoor Air
Célia Alves
*, Teresa Nunes, Joana Silva, Márcio Duarte
Centre for Environmental and Marine Studies (CESAM), Department of Environment, University of Aveiro, 3810-193 Aveiro, Portugal
ABSTRACT
In January 2012, one kindergarten and eight elementary school classrooms were monitored. The campaign included
simultaneous measurements, indoors and outdoors, of comfort parameters, CO, CO2 and particles. Automatic monitors
using a light scattering technique were employed to measure PM10 continuously. During occupied periods, low volume
samplers were used to daily collect PM2.5 samples, which were subsequently analysed for carbonates, organic carbon
(OC), elemental carbon (EC) and water soluble inorganic ions. With regard to comfort, the schools did not meet the
recommended levels in many rooms. Indoor-outdoor CO2 ratios between 3 and 12, and indoor levels much higher than
1000 ppm during the occupied periods, indicate the highly inadequate ventilation in these locations. The results clearly demonstrate that there is a high level of exposure to particulate matter in these schools. The continuous measurements of
PM10 suggest that the physical activity of pupils, which is assumed to be more marked in younger children, contributes to a
constant process of resuspension of sedimented particles. In addition, peak PM10 concentrations coincident with cleaning
activities suggest the need to change certain practices to improve cleanliness. Around 40% of the PM2.5 mass is composed
of carbonaceous matter, with 4–5 times higher OC mass fractions than EC. It was observed that both OC and EC were
significantly influenced by indoor sources. Water-soluble inorganic ions represented around 10–20% of the PM2.5 mass
measured in classrooms. Excluding calcium, in general the ionic species were present at indoor-outdoor ratios of less than 1, suggesting the major origin in the outdoor air.
Keywords: Indoor air quality; Air exchange rates; PM10; PM2.5; OC/EC; Water soluble ions.
INTRODUCTION
Studies carried out by the USA Environmental Protection Agency (EPA) of human exposure to air pollutants indicate that indoor air levels of many pollutants may be 2–5 times, and occasionally more than 100 times, higher than outdoor levels. These levels of indoor air pollutants are of particular concern because it is estimated that most people, including children, spend as much as 90% of their time indoors (Bronsema et al., 2004). Over the past several decades, the exposure to indoor air pollutants is believed to have increased due to a variety of factors, including the construction of more tightly sealed buildings, reduced ventilation rates to save energy, the use of synthetic building materials and furnishings, and the use of chemically formulated personal care products, household cleaners, etc.
Unlike other buildings, managing schools involves not only maintenance related concerns, but also child safety
* Corresponding author.
E-mail address: [email protected]
issues. Many aspects are unique to schools (EPA, 2005): (i) classrooms have about four times as many occupants as office buildings for the same floor area; (ii) in general, maintenance suffers from financial cuts; (iii) the presence of a wide variety of emission sources, including art and science supplies, and gyms; (iv) highly variable heating and ventilation systems; (v) sometimes portable classrooms or buildings that were not originally designed to meet the educational requirements are used.
Failure to prevent or respond promptly to indoor air quality (IAQ) problems can increase short- and long-term health outcomes (Norbäck et al., 2000; Simoni et al., 2006; Tillet, 2010; Simoni et al., 2010), impact both teacher and student’s attendance, comfort and performance (Gilliland et al., 2001; Shaughnessy et al., 2006; Mohai et al., 2011), and accelerate the deterioration of school buildings and equipments (Lohbeck, 2008). Among the indoor air pollutants, there is an increasing interest in the measurement of particulate matter concentrations. Aerosol exposure via the inhalation route is of prime importance, representing a major potential source of hazard for human health of a greater or lesser severity, depending on the airborne concentrations, duration of exposure and chemical composition. Therefore, it is of
Alves et al., Aerosol and Air Quality Research, 13: 1521–1535, 2013 1522
utmost significance to measure particle concentrations in the size fractions known to affect the human health (Abdel-Salam, 2006). There are some recent studies reporting indoor and outdoor aerosol behaviour and its chemical composition (e.g., Chao and Wong, 2002; Na et al., 2004; Gemenetzis
et al., 2006; Martuzevicius et al., 2008; Olson et al., 2008;
Smolík et al., 2008 Lai et al., 2010; Saraga et al., 2010; Zhu et al., 2010; Huang et al., 2012), but only a few refer to elementary schools (Fromme et al., 2008; Almeida et al., 2012; Oeder et al., 2012; Pegas et al., 2012; Smolík et al., 2012). In the present study, the simultaneous characterisation
of inhalable (< 10 µm, PM10) and thoracic (< 2.5 µm, PM2.5)
suspended particles, along with measurements of comfort parameters, were carried out. This aims to deepen the knowledge of indoor air quality in schools and childcare settings and, thus, to contribute to the elaboration of a prolific set of proposals leading to new policies, guidelines and practices.
METHODOLOGY Selected Schools
The selected schools are located in the municipality of Aveiro, central Portugal. This coastal municipality has a population of about 78,500 inhabitants within its administrative limits and a total area of 200 km². A total of nine classrooms were monitored, eight integrated in elementary schools and one in a kindergarten (Table 1). All the educational settings started their activities in the sixties or seventies, although, in the meantime, were somewhat refurbished and routine maintenance works were carried out. All the school buildings are naturally ventilated through openable windows and doors, and have white painted concrete walls, wooden window frames, wood or cork flooring and portable electric heaters. The number of pupils per class ranged from 20 to 25, either for kindergarten or primary levels.
Sampling Campaign
The sampling campaign took place between 9 and 29 January, 2012. Continuous measurements of temperature,
relative humidity (RH), CO2, CO and total volatile organic
compounds (TVOCs) were performed with an Indoor Air IQ-610 Quality Probe (Gray Wolf® monitor) in the classrooms of every school. The same measurements, excepting TVOCs, were continuously carried out outside on the playgrounds using an IAQ-CALC monitor (model 7545) from TSI. These equipments were supplied with a factory calibration certificate, but were further checked prior to their use with appropriate calibration kits.
Three automatic monitors using a light scattering
technique were employed to measure PM10 continuously in
the three classrooms of each school: (i) a TSI Model 8533 DustTrak DRX, (ii) an AIR-AIDE model AA-3500, and (iii) a Topas monitor from Turnkey Instruments. This latter monitor is designed to continuously record environmental
total suspended particles (TSP), PM10, PM2.5 and PM1. A
“demonstration of equivalence” exercise was carried out before the monitoring campaign. These three instruments
were intercompared with gravimetric PM10 measurements,
following the EN 12341 (the reference procedure). The automatic monitors were initially calibrated in the factory using a “standard” test dust. The side-by-side intercomparison allowed the verification or correction of the calibration factors, which were then used to scale the readings of each monitor to give “true” results.
From Monday to Friday, during the occupancy periods,
simultaneous sampling of PM2.5 was performed in 3
classrooms and one outdoor site per school. The daily PM2.5
samples were collected onto pre-baked (6 h at 500°C) 47 mm diameter quartz filters using Echo TCR Tecora samplers, following the EN 14907 norm. The four low-volume samplers were intercompared before the IAQ evaluation programme. The regression slopes for the results obtained from parallel measurements over one week differed by less than 5%. All the correlation coefficients were higher than 0.95.
Following the teachers’ request in order to allow the free movement within the classrooms, the sampling equipments were installed in a central location at the bottom of the rooms. This location avoids direct contamination of the filters with chalk dust, principally when blackboards on the front wall are being used. The sampling heads or inlets were positioned at a height of about 1.2 m above floor and at a distance of around 1 m from the bottom wall.
Analytical Methodologies
Before weighing, the filters were conditioned in a desiccator at least for 24 h in a temperature- and humidity-controlled room. Before and after sampling, gravimetric determination was performed with a microbalance Mettler Toledo AG245 (readability 0.1 mg/0.01 mg). Filter weights were obtained from the average of 10 measurements, with weight variations less than 5%. After gravimetric determination of
the PM2.5 mass, filter punches were analysed by a
home-made thermo-optical transmission system in order to obtain the carbonaceous content. After exposure of filter punches to HCl vapours to remove carbonate carbon, controlled heating in anoxic and oxic conditions was performed to separate, respectively, OC into two fractions of increasing volatility and EC. The first fraction corresponds to the volatilisation at
T < 200°C of lower molecular weight organics (OC1). The
second fraction is related to the decomposition and oxidation of higher molecular weight species at temperatures ranging
from 150 to 600°C (OC2). The last fraction of OC is
identified by transmittance and corresponds to pyrolysed organic carbon (PC) produced in the previous heating steps. Separation between OC and EC was achieved by initially heating the filter punches under an inert atmosphere to evaporate first the OC fraction. The remaining fraction is sequentially evaporated/burnt under a gas flow containing
O2. This last carbon fraction contains initial EC plus OC that
has pyrolysed during heating under an inert atmosphere. The interference between PC and EC can be controlled by continuous evaluation of the blackening of filter using a laser beam and a photodetector measuring the filter light
transmittance. Carbonates present in PM2.5 samples were
analysed through the release of CO2, and measurement by the
thermo-Alves et al., Aerosol and Air Quality Research, 13: 1521–1535, 2013 1523 Ta ble 1 . S ch oo l c lassroom s select ed for the i ndoor ai r qual ity m on ito ring cam pa ig n in Av ei ro, Portugal. Scho ol C oord in ates Y ear of co ns tru cti on Sc ho ol char ac te ri stics Co de (S choo l.R oo m ) Classroom ch aracterist ics Gló ria Elem entary N 40 °3 8' 16 '' W 08°39' 10 '' 19 66 T raf fi c Cit y cen tr e 1. 1 4 th gr ad e; 1 st fl oo r; fl oo r a re a 44 .3 m 2 ; ce il in g he ight 3.5 m ; blackb oar d w ith ch al k a nd elect ro ni c in ter active bo ar d; o ccu pie d 7 .5 h per d ay 1. 2 4 th gr ad e; 2 nd fl oo r; floor are a 5 2. 2 m 2 ; c eilin g height 3 .23–4 .9 m ; b lackbo ar d w ith c hal k an d el ectronic in te ract iv e b oa rd ; o cc up ie d 7.5 h p er da y 1. 3 3 rd gr ad e; 1 st f loor; f loor area 54 .5 m 2 ; ceiling h ei gh t 3 .0 m ; b lackboar d w ith ch al k; occu pi ed 7.5 h pe r da y Es gu ei ra Ki nd er ga rt en N 40 º3 8' 47 '' W 08º37' 52 '' 19 74 Ur ba n Residen tial 2. 1 Ch ild re n 3–6 y ears old; 1 st fl oor ; flo or a rea 50 .8 m 2 ; c ei li ng he ig ht 2. 7 m ; o cc upi ed 6 .5 h per d ay Es gu ei ra Elem entary N 40 º3 8' 47 '' W 08º37' 52 '' 19 74 Ur ba n Residen tial 2. 2 Two 3 rd g rad e cla ss es (o ne in th e m or ning ; a no th er in th e af te rn oo n) ; 2 nd fl oo r; flo or a rea 49 .5 m 3 ; ceiling h ei gh t 2 .7 –6. 7 m ; wh it eb oa rd wi th m ar ke rs ; oc cu pi ed 1 0. 5 h pe r da y 2. 3 3 rd gr ad e; 2 nd fl oor; f loor ar ea 49 .5 m 3 ; ceiling h eig ht 3 .5 m ; whitebo ar d w ith m ark er s an d el ectronic in te ract iv e b oa rd ; o cc up ie d 5– 10 h pe r d ay , d epe nd in g on th e a ct iv it ie s Eixo Elem entary N 40 º3 7' 39 '' W 08º34' 07 '' 19 79 R ura l 3. 1 2 nd and 3 rd grades s im ultaneous ly ; 1 st fl oo r; floor a rea 5 0. 7 m 3 ; c ei li ng h ei gh t 4. 9 m ; bl ackb oa rd with c halk an d w hitebo ar d w ith marker s; oc cupie d 7.25 h pe r da y 3. 2 4 th gr ad e; 1 st fl oo r; fl oo r a rea 51.5 m 3 ; c ei lin g he ight 2.8 m ; b la
ckboard with chalk,
w hiteb oa rd w ith m ark er s and elec tr on ic in ter acti ve board; o ccu pie d 7. 25 h per da y 3. 3 3 rd gr ad e; 2 nd fl oor; flo or area 5 1.5 m 3 ; ceiling h eig ht 2 .8 m ; b la ckboard wi th ch alk an d w hiteb oa rd w ith m ark er s; oc cu pi ed 7. 25 h per da y
Alves et al., Aerosol and Air Quality Research, 13: 1521–1535, 2013 1524
optical system, when a punch of each filter was acidified
with orthophosphoric acid (20%) in a free CO2 gas stream.
It should be mentioned that results of an international round robin test on the analysis of carbonaceous particles positioned the University of Aveiro within the group with “best estimates”. In addition, the comparison between the methodology of the University of Aveiro and the “European Supersites for Atmospheric Aerosol Research” (EUSAAR-2) protocol (Cavalli et al., 2009) for the quantification of the different carbon fractions in atmospheric particulate matter samples gave similar results for OC and EC, without significant differences at a 95% confidence level (Nunes et
al., 2010). In the present study, two replicate carbon
analyses were carried out. The analyses were repeated when the coefficient of variation was higher than 5%.
For the determination of water soluble inorganic ions, small parts of the filters were extracted by sonication during 15 min with 5 mL of ultra pure Milli-Q water. The liquid extracts were filtered through a 13 mm PVDF syringe filter (pore size 0.2 μm) and analysed by ion chromatography. An AS4 (4 mm) column with an AG4 guard column were used
coupled to a Dionex AMMS II suppressor for Cl–, NO
3–
and SO42– determination. Cations (Na+, NH4+, K+, Mg2+
and Ca2+) were analysed using a CS12 (4 mm) column with
a CG12 guard column. A Dionex CMMS III suppressor was used in these analyses. The anionic system comprised a Model 401 Dilutor (injector pump), a Gilson sampling injector Model 231, a Shimadzu oven CTO-6A, a Shimadzu conductivity detector CDD-6A, a Dionex interface UCI-100 and a Jasco pump PU-980. The cationic system integrates a Gilson injector 234 and a Dionex DX-100 chromatograph. Sets of multi-cation and anion standards were prepared from a stock solution with 1000 mg/L for each ion. The ion concentrations in the samples were obtained through
individual calibration curves (r2 ≥ 0.99). For the final results,
blank values were taken into account. Samples were analysed by two different analysts on two different days. The inter-day precision, expressed as coefficient of variation, was ≤ 3%. Ventilation Rates
The ventilation Eq. (1) has been used to calculate the fresh air ventilation rate (Griffiths and Eftekhari, 2008).
For a well-mixed space the change in CO2 concentration
with time is given by:
2 2 6 6 0 10 10 Qt CO CO v ext ext q q C C C C e Q Q (1)
where Ct is the indoor concentration of CO2 at time t
(ppm), Cext is the outdoor concentration of CO2 (ppm), C0
is the concentration of CO2 in the indoor air at time 0
(ppm), Q is the volume flow rate of air entering the space
(m3/s), q
CO2 is the volumetric indoor emission rate of CO2
(m3/s), V is the volume of the classroom (m3) and t is the
interval since t = 0 (s). When the classroom is unoccupied
there is no CO2 emission from the occupants, and qCO2 = 0.
Thus, Eq. (1) can be rearranged to give the following expression, which allows the ventilation rate (Q) to be
calculated from measured concentration values time t apart: 0 ln t ext ext C C V Q t C C (2)
RESULTS AND DISCUSSION
Comfort Parameters and Ventilation Rates
The human sensation of warmth depends on the thermal balance of the body as a whole. Thermal comfort occurs when body temperatures are held within narrow ranges, and the physiological effort of regulation is minimised. A number of variables interact to determine whether people are comfortable with the temperature and relative humidity of the indoor air. Factors such as clothing, activity level, age, and physiology of people in schools vary widely, so the thermal comfort requirements differ for each individual. The American Society of Heating, Refrigerating, and Air-Conditioning Engineers (ASHRAE) Standard 55–1992 describes the temperature and humidity ranges that are comfortable for 80% of people engaged in largely sedentary activities, assuming “normal indoor clothing”. At winter conditions, the recommended temperature values for a relative humidity of 30% range from 20.3 to 24.2°C. An interval between 19.7 and 23.3°C is suggested when the relative humidity value is 60%. For many rooms, the schools did not meet ASHRAE recommended levels for winter conditions (Table 2). The average relative humidity values varied depending on the school and room, some of them exceeding the recommended upper limit of 60%. Previous studies suggest that thermal abnormal conditions can cause discomfort or distraction among students, and have consequent effects on performance (Mendell and Heath, 2005). Elevated relative humidity can be responsible for IAQ problems resulting from mould and other microbiological amplification, and subsequent allergic incidents.
At concentrations occurring in most indoor environments,
CO2 build-up can be considered as a surrogate for other
occupant-generated pollutants, particularly bioeffluents, and for ventilation rate per occupant, but not as a direct causal factor in human health responses (Apte and Erdmann, 2002). The outdoor air in most locations contains down to about 380 parts per million carbon dioxide. While levels below 5,000 ppm are considered to pose no serious health threat, experience indicates that individuals in schools with elevated
CO2 concentrations tend to report drowsiness, lethargy and
a general sense that the air is stale (Mahyuddin and Awbi, 2012). Researchers have been looking for links between
elevated CO2 concentrations and reduced attendance,
productivity or achievement (Shendell et al., 2004; Wargocki and Wyon, 2006).
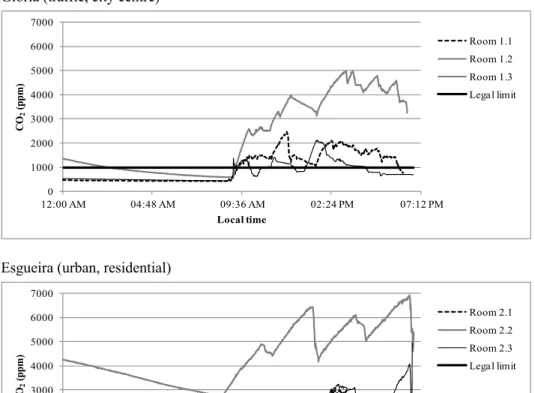
CO2 concentrations during school hours at a given day
and classroom varied from 1300 ppm up to 7000 ppm (Fig. 1), largely exceeding the limit of 1000 ppm stipulated by the Portuguese legislation (RCESE, 2006). Regardless of classroom, the air exchange rates were not higher than
Alves et al., Aerosol and Air Quality Research, 13: 1521–1535, 2013 1525
Table 2. Comfort parameters, total volatile organic compounds and carbon oxides measured in indoor and outdoor environments.
School Measurementsite Temperature (°C) Relative Humidity(%) (μg/mTVOC 3) (μg/mCO 3) (ppm) CO2
Glória (traffic, city centre) Classroom 1.1 19.9 ± 1.9 47.8 ± 3.2 167 ± 41 391 ± 211 1556 ± 360 Classroom 1.2 16.9 ± 0.9 65.7 ± 3.3 866 ± 472 714 ± 214 3574 ± 1026 Classroom 1.3 17.0 ± 1.5 50.9 ± 2.5 338 ± 127 514 ± 224 1123 ± 345 Outdoor 10.6 ± 4.5 65.0 ± 14.4 - 320 ± 505 448 ± 22 Esgueira (urban, residential) kindergarten 18.8 ± 4.3 61.9 ± 8.1 723 ± 189 524 ± 170 2144 ± 525 Classroom 2.2 17.6 ± 1.4 71.6 ± 2.0 1543 ± 399 905 ± 283 4957 ± 890 Classroom 2.3 17.7 ± 1.5 57.8 ± 4.6 483 ± 198 479 ± 164 2032 ± 780 Outdoor 8.5 ± 2.9 86.0 ± 10.2 - 405 ± 437 415 ± 17 Eixo (rural) Classroom 3.1 17.1 ± 1.1 51.9 ± 5.8 163 ± 97 333 ± 135 1175 ± 363 Classroom 3.2 17.2 ± 0.7 65.8 ± 4.6 1002 ± 1402 519 ± 150 1792 ± 651 Classroom 3.3 20.5 ± 2.7 56.0 ± 6.1 624 ± 209 609 ± 122 2332 ± 494 Outdoor 11.1 ± 4.6 70.7 ± 17.0 - 192 ± 185 415 ± 17
windows that is responsible for the high levels of CO2 and
the extremely low outdoor air infiltration of not more than 38 L/min per person (Fig. 2). In Europe, depending on the country, the required outdoor airflow rates range from 300 to 500 L/min per person (Jones, 2011), while the recommended value in the US was set at 426 L/min per person (ASHRAE, 2004).
Particulate Matter Levels and Chemical Composition
The daily average PM2.5 concentrations obtained during
the occupancy periods ranged from 44 ± 3.2 μg/m3 to 117
± 16 μg/m3. The highest values were obtained in the school
with the highest occupancy rates. In addition, this school, located in a residential area, is the only one surrounded by an unpaved playground. Soil particles are tracked in on shoes or clothing from the outdoors, contributing to indoor-outdoor ratios (I/O) in the range 1.3–5 (average = 2.7). Lower average I/O ratios of 1.3 and 1.7 were, respectively, obtained in the city centre and rural schools, where comparable
PM2.5 concentrations have been measured, while an I/O
value of 2.3 was determined for the establishment located in the residential area. I/O ratios greater than one indicate the presence of indoor sources, activities/movements of the occupants and reduced ventilation rates as a result of closed doors and windows, so causing accumulation. No significant
differences were observed in outdoor PM2.5 concentrations
among schools with averages in the range 37–42 μg/m3.
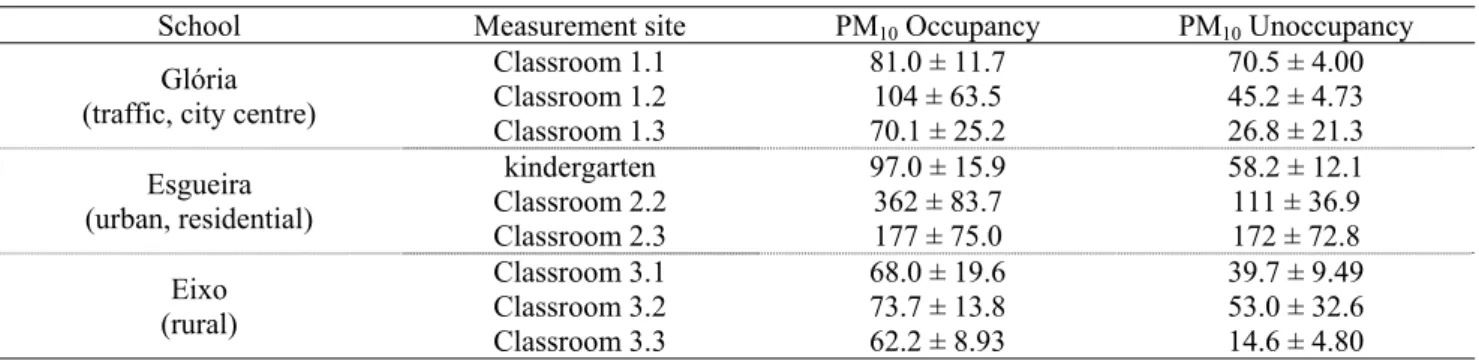
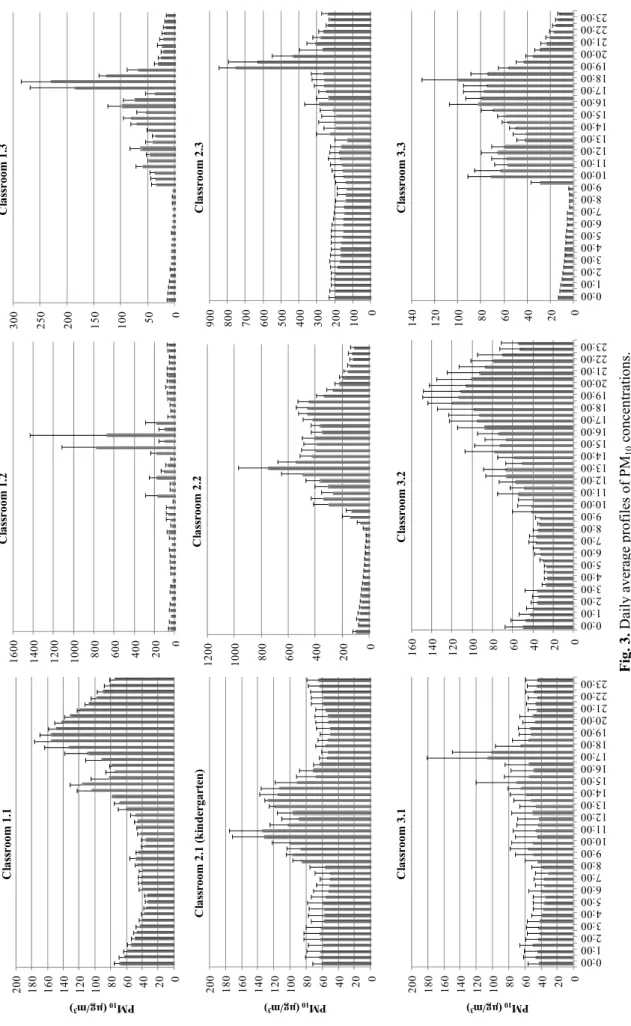
In classrooms (# 2.2 and 2.3) of the school in the
periphery of the city, the PM10 concentrations (Table 3 and
Fig. 3) frequently exceeded the limit value of 150 μg/m3
established by the Portuguese legislation for indoor air (RSECE, 2006). In the classroom with highest occupancy
rates (# 2.2), the average PM10 levels for daytime and
night-time periods were, respectively 362 ± 84 and 111 ±
37 μg/m3. PM
2.5 represented, on average, 12.7 and 28.0%
of the PM10 concentrations during the teaching hours and
vacant periods, respectively (Table 4). This suggests that
high PM10 levels found in classrooms are probably due to
resuspension of soil material or other coarse particles. The
very high TSP concentrations, up to 3227 μg/m3, registered
in classroom # 2.2, confirm the presence of resuspended
coarse particles. In this classroom, PM10 accounted for
12.7 ± 1.9% (period of school activities) and 28.0 ± 4.6% (night-time) of the TSP concentrations. Slightly higher averages for daytime and lower at night-time were obtained in the other classrooms, where a Topas monitor has been used. Human activity is seemingly the most important factor to account for the indoor levels of coarse particles. Without this source, at night the indoor particulate material
is composed predominantly of PM2.5. Significant differences
between night and day were also observed for the finest particle size fraction. The settling of coarser particles after school hours contributed to increased submicron particles
PM1-to-PM2.5 ratios during the night.
A wide range of PM2.5/PM10 and PM1/PM2.5 ratios has
been reported worldwide for different schools, depending on season, meteorology, occupancy rates, physical characteristics of buildings, activities inside the classrooms and ventilation. In all schools of the present study, the maximum
concentrations of PM10 during teaching hours were registered
when students were entering or leaving the classrooms, when the blackboard was being used or when craft activities involving paper or paperboard cutting were underway (Fig. 3). Intense physical activities of occupants in classrooms cause either resuspension of previously deposided particles or delayed deposition/settling of coarse particles indoors (hindered settling), enhancing the indoor concentrations
(Goyal and Khare, 2009). However, the highest PM10 levels
coincided with the cleaning activities at the end of the afternoon. In fact, the patterns of diurnal variation depend, in addition to other features, on the cleaning practices. Concentrations tend to be higher in rooms where sweeping is carried out than in those that are vacuumed. Mopping contributes to the lowest levels during the cleaning periods and favours steeper decays during nigh-time.
The particle concentrations observed in the Portuguese schools are consistent with results reported for other countries. It has been pointed out that the high levels are likely associated with the physical activities of pupils, which contribute to a constant process of resuspension of sedimented material from the daily tasks, from skin desquamation or clothing, and from outdoor sources (Brunekreef et al., 1997;
Alves et al., Aerosol and Air Quality Research, 13: 1521–1535, 2013 1526
Glória (traffic, city centre)
0 1000 2000 3000 4000 5000 6000 7000 12:00 AM 04:48 AM 09:36 AM 02:24 PM 07:12 PM CO 2 (ppm ) Local time Room 1.1 Room 1.2 Room 1.3 Legal limit
Esgueira (urban, residential)
0 1000 2000 3000 4000 5000 6000 7000 12:00 AM 04:48 AM 09:36 AM 02:24 PM 07:12 PM CO 2 (ppm ) Local time Room 2.1 Room 2.2 Room 2.3 Legal limit Eixo (rural) 0 1000 2000 3000 4000 5000 6000 7000 12:00 AM 04:48 AM 09:36 AM 02:24 PM 07:12 PM CO 2 (ppm ) Local time Room 3.1 Room 3.2 Room 3.3 Legal limit
Fig. 1. CO2 levels recorded during night-time and one typical working day in the 9 classrooms.
Lee and Chang, 2000; Janssen et al., 2003; Peacock et al., 2003; Pénard-Morand et al., 2005; Ekmekcioglu and Keskin, 2007; Fromme et al., 2007; Van Roosbroeck et al., 2007; Diapouli et al., 2008; Richmon-Bryant et al., 2009). Brunekreef et al. (1997) studied 13 schools located 35–645
m from a motorway. The PM10 levels ranged from 6.73 to
20.8 μg/m3 in schools farthest from the road, and from 9.20
to 32.8 μg/m3 in schools nearest from the road. Lee and
Chang (2000) found PM10 concentrations in 5 schools in
Hong Kong above the 24-h average value (180 μg/m3)
stipulated by the local legislation. Braniš et al. (2005) studied the effects of outdoor air and human activities on
PM10, PM2.5 and PM1 concentrations in schools in Prague.
The results confirmed that human activities are an important factor for high indoor particulate levels and that outdoor concentrations influence the indoor environment. Five
elementary schools in Istanbul, Turkey, showed PM10
levels varying from 27.9 to 289 μg/m3 according to the
traffic intensity (Ekmekcioglu and Keskin, 2007). In 64 schools in Munich, Fromme et al. (2007) observed indoor
Alves et al., Aerosol and Air Quality Research, 13: 1521–1535, 2013 1527 0 5 10 15 20 25 30 35 40 Classroom 1.1 Classroom 1.2 Classroom 1.3 Kindergarten Classroom 2.2 Classroom 2.3 Classroom 1.3 Classroom 2.2 Classroom 3.3 C it y C ent re R es ide nt ia l R ur al Recommend values: 300-500 L/min/occupant
Fig. 2. Ventilation rates (L/min per capita).
Table 3. PM10 concentrations (μg/m3) during occupied and vacant periods.
School Measurement site PM10 Occupancy PM10 Unoccupancy
Glória (traffic, city centre)
Classroom 1.1 81.0 ± 11.7 70.5 ± 4.00 Classroom 1.2 104 ± 63.5 45.2 ± 4.73 Classroom 1.3 70.1 ± 25.2 26.8 ± 21.3 Esgueira (urban, residential) kindergarten 97.0 ± 15.9 58.2 ± 12.1 Classroom 2.2 362 ± 83.7 111 ± 36.9 Classroom 2.3 177 ± 75.0 172 ± 72.8 Eixo (rural) Classroom 3.1 68.0 ± 19.6 39.7 ± 9.49 Classroom 3.2 73.7 ± 13.8 53.0 ± 32.6 Classroom 3.3 62.2 ± 8.93 14.6 ± 4.80
particle concentrations lower in the summer and twice higher during the winter. The high occupants’ number associated with the small size of classrooms and poor ventilation, were pointed out as contributors to increased concentrations of PM in the winter. Seven primary schools in Athens, Greece,
have been reported to present higher indoor PM10 (229 μg/m3)
than outdoor levels (166 μg/m3) (Diapouli et al., 2008). In
a study carried out in a school building near an urban traffic roadway in Delhi city, Goyal and Khare observed maximum
PM10 concentrations of 14,474 ± 637.5 μg/m3 at 11:00 to
11:30 a.m., in winter, when recess hour started and finished and children left and entered to the classrooms.
The carbonaceous fraction (TC = OC + EC) accounted
for 43 ± 10% of the PM2.5 mass indoors. Similar values (39
± 12%) were found outdoors (Fig. 4). Higher carbonaceous contents (52–80%, averaging 62%) have been reported for
PM2.5 sampled in an American elementary school in Montana
(Ward et al., 2007). Variable TC mass fractions, from about
23 to 60% of PM2.5, were observed in seven schoolrooms in
Riverside, California (Sawant et al., 2004). A wide interval
of values were obtained for the percent amount of TC in PM10
(median = 27%) in two schoolrooms in Munich (Fromme et
al., 2008). In the present study, while EC represented, on
average, 10% of the PM2.5 mass collected at the playground
of the city centre school, around half of this percentage
was obtained for the other two institutions. Lower OC/EC ratios (average = 3.31) for the outdoor air of the city centre school also denote a more pronounced influence of traffic emissions than those observed for the periphery (OC/EC = 4.18) and rural (OC/EC = 4.03) schools. Much higher OC/EC ratios (average values ranging from 4.2 to 9.7) were obtained in the classrooms of all schools (Fig. 5), suggesting that the organic carbonaceous fraction is produced more by indoor sources rather than outdoor pollutant penetration. These indoor OC/EC ratios are within the range (5.3–10.8) measured by Na and Cocker (2005) in four schoolrooms in Riverside, California. Crilley et al. (2012) reported OC/EC
ratios from 2.72 to 13.6 in PM2.5 sampled in 17 schools in
different suburbs in the city of Brisbane, Australia. Higher
ratios (OC/EC from 5.3 to 33.6) were observed in PM2.5
samples collected in elementary and middle schools in Libby, Montana (Ward et al., 2007). To justify the high OC/EC values found in an Australian school, Morawska et
al. (2009) suggested, in addition to the influence of primary
sources, the presence o secondary organic aerosols (SOA). Several research groups have conducted investigations into the formation of SOA in indoor environments through
reactions of O3 with VOCs (Morawska et al., 2009; Waring
et al., 2011; and references therein). It can be argued that,
Alves et al., Aerosol and Air Quality Research, 13: 1521–1535, 2013 1528 Fi g. 3. Dail y av er ag e prof iles of PM 10 conce ntra tio ns. 0 20 40 60 80 100 120 140 160 180 200 PM 10 (µg /m 3 ) C las sr oom 1.1 0 200 400 600 800 1000 1200 1400 1600 C las sr oom 1.2 0 50 100 150 200 250 300 C las sr oom 1.3 0 20 40 60 80 100 120 140 160 180 200 PM 10 (µg /m 3 ) C las sr oom 2.1 ( k in dergar te n ) 0 200 400 600 800 1000 1200 C las sr oom 2.2 0 100 200 300 400 500 600 700 800 900 C las sr oom 2. 3 0 20 40 60 80 100 120 140 160 180 200 0:00 1:00 2:00 3:00 4:00 5:00 6:00 7:00 8:00 9:00 10:00 11:00 12:00 13:00 14:00 15:00 16:00 17:00 18:00 19:00 20:00 21:00 22:00 23:00 PM 10 (µg /m 3 ) C las sr oom 3.1 0 20 40 60 80 10 0 12 0 14 0 16 0 0:00 1:00 2:00 3:00 4:00 5:00 6:00 7:00 8:00 9:00 10:00 11:00 12:00 13:00 14:00 15:00 16:00 17:00 18:00 19:00 20:00 21:00 22:00 23:00 C las sr oom 3.2 0 20 40 60 80 100 120 140 0:00 1:00 2:00 3:00 4:00 5:00 6:00 7:00 8:00 9:00 10:00 11:00 12:00 13:00 14:00 15:00 16:00 17:00 18:00 19:00 20:00 21:00 22:00 23:00 C las sr oom 3.3
Alves et al., Aerosol and Air Quality Research, 13: 1521–1535, 2013 1529 Ta b le 4 . M ass co nc en tra tio n ra tio s (% ) b etwe en d iffe re nt p arti cl e siz e fra ct io ns in th is stu dy (c la ss ro om s w he re a T op as m on ito r wa s u sed) and mean val ue s r epo rt ed i n t he lite ra tu re fo r te ac hi ng h ou rs. T hi s s tud y O ther s tudi es C ity cen tr e (R oo m 1. 3) R es id en tia l (R oo m 2 .2) Ru ra l (R oo m 3. 3) G oya l and K ha re (200 9) ( a) F ro mme et a l. (2 00 7) (b ) Ha le k et a l. (200 9) ( c) Bra niš et a l. (2 00 5) (d ) PM 10 /T S P 45. 6 ± 3. 6 ( day) 80. 9 ± 1. 3 ( ni gh t) 55. 4 ± 2. 4 ( day ) 72 .3 ± 0. 95 ( ni gh t) 50 .3 ± 1. 7 ( day ) 75 .2 ± 1. 5 (n ig ht ) -PM 2. 5 /P M10 18. 2 ± 3. 6 ( day) 54. 8 ± 9. 9 ( ni gh t) 12. 7 ± 1. 9 ( day ) 28 .0 ± 4. 6 ( ni gh t) 23 .57 ± 3. 1 ( day) 51 .5 ± 3. 7 (n ig ht ) 17 .3 ( non-w int er ) 30. 5 ( w in te r) 21 .6 ( w in te r) 19 .6 (su m m er) 15. 3 ( w in te r) 51. 8 ( day ) 91 .4 ( nig ht ) PM 1 /P M2. 5 25. 8 ± 3. 3 ( day) 41. 2 ± 7. 2 ( ni gh t) 16. 3 ± 2. 4 ( day ) 20 .5 ± 3. 4 ( ni gh t) 24 .3 ± 3. 5 ( day ) 39 .2 ± 2. 3 (n ig ht ) 64 .5 ( non-w int er ) 81. 5 ( w in te r) - 45. 2 (w in te r) 62. 6 ( day ) 79. 6 (n ig ht ) (a ) C las sr oo m o f a s ch ool near an ur ba n ro adw ay i n D el hi C ity ; ( b) 64 s ch ool s ( pr im ar y an d s econ dar y) in Mun ich; ( c) Fi ve e lem ent ar y s ch oo ls in T ehr an ; ( d) U ni ve rs ity lect ur ing r oo m ( O ct .– N ov. )
classrooms are very low and, thus, the SOA formation potential is also very low. However, Waring (2009) and Langer et al. (2008) showed that d-limonene, used in air fresheners, detergents and other consumer products, even at ozone-very limited conditions, yields large SOA formation events. It is also known that ozone reacts with indoor-emitted terpenoids to form SOA, process that contributes to the rapid decay of this oxidant inside buildings and to the detection of I/O ratios substantially lower than 1 (Waring
et al., 2011). On the other hand, taking into account that
one of the main primary contributors to indoor particles is probably resuspended dust, some of which associated with soil, high OC/EC ratios are not surprising. In fact, it has been reported that particles from dust resuspension present high OC/EC ratios (e.g., Amato et al., 2009; Chen et al., 2012).
The poor indoor-outdoor correlations of OC (r2 between
0.22 and 0.30) indicate the presence of multiple carbon sources, and different contributions to indoor and outdoor carbonaceous particles. For the school located in the
residential area, a modest correlation (r2 = 0.30) between the
EC concentrations measured inside and outside was obtained, whereas lower correlations were found for the other educational settings. This indicates that, probably, the use of graphite pencils and their sharpening may represent a much more important indoor source of EC than that associated with penetration of outdoor traffic emissions. Concerning the relationships between indoor and outdoor measurements, each intercept roughly reflects EC concentrations that originate exclusively from indoor emission sources because intercepts are the concentration values when outdoor EC contributions are zero (Cao et al., 2012). The percentage of the EC intercept in the average EC concentration indicates the contribution of indoor sources to measured indoor EC levels. For the school located in the residential area, where a better indoor-outdoor relationship was obtained, the intercept/average value was 0.25, indicating that about 25% of indoor EC results from the input of indoor sources. The same procedure applied to OC led to similar results across schools. This crude assessment pointed out that around 15% of the indoor OC has an origin in indoor sources, which we believe to be an underestimation, taking into account the very high I/O ratios.
The slopes of the relationships between anions (Cl–, NO
3–
and SO42–) and cations (Na+, NH4+, K+, Mg2+ and Ca2+)
expressed by the sum of the equivalent concentration are lower than 1 (average = 0.8). In addition to the contribution of carbonates in some samples, the anion deficits are thought
to have been affected by the absence of data on F−, PO
43−,
NO2−, and organic acid salts (Huang et al., 2012). The water
soluble inorganic ions represented, as a sum, 16.5 ± 1.5%,
11.0 ± 4.8% and 19.2 ± 5.0% of the PM2.5 mass measured
in classrooms of the city centre, residential and rural schools, respectively. Sulphate and nitrate were always the dominant ionic species (Fig. 6). These two secondary ions
were highly correlated (r2 = 0.82), suggesting that their
precursors were released from similar emission sources.
Furthermore, there was no correlation between Ca2+ and
SO42− and between Ca2+ and NO3−, suggesting there was
Alves et al., Aerosol and Air Quality Research, 13: 1521–1535, 2013 1530 C las sroom 1. 1 C las sroom 1. 2 C las sroom 1. 3 ki nderg art en C las sroom 2. 2 C las sroom 2. 3 C las sroom 3. 1 C las sroom 3. 2 C las sroom 3. 3 Concen trati on ( g/ m 3 ) 0 20 40 60 80 100 120 140 EC OC PM2.5
Fig. 4. Average levels of PM2.5, OC and EC during occupancy periods.
0 1 2 3 4 5 6 Classroom 1.1 Classroom 1.2 Classroom 1.3 Kindergarten Classroom 2.2 Classroom 2.3 Classroom 3.1 Classroom 3.2 Classroom 3.3 C ity c ent re R es ide nt ai l R ur al I/O ratios PM2.5 OC EC
Fig. 5. Indoor-outdoor ratios for PM2.5, OC and EC.
sulphuric acid formed from oxidation of SO2. The molar
ratios of outdoor NH4+ to SO42– (3.40 ± 1.47) indicate their
complete neutralisation to (NH4)2SO4. However, the NH4+
to SO42– molar ratios obtained for indoor particles (1.74 ±
0.69) point out that the neutralisation process produced a
mixture of (NH4)2SO4 and (NH4)3H(SO4)2 (Alves et al.,
2007). In addition, the global good correlation between NH4+
and NO3– (r2 = 0.79) also suggests aerosol in the form of
NH4NO3. It has been argued that ammonium nitrate
aerosol will partially vaporise as it enters a building, which contributes to I/O ratios lower than 1. The decay of concentrations inside buildings has been attributed to transformation of indoor ammonium nitrate to ammonia and nitric acid gases, which are further lost by sorption and deposition on indoor surfaces (Lunden et al., 2003).
The moderate global correlations between Mg2+ and
Ca2+ (r2 = 0.50), Mg2+ and Cl− (r2 = 0.53), and Na+ and Mg2+
(r2 = 0.45), indicate that these species may be associated
with crustal dust. Excepting calcium in all schools, the I/O ratios for the other ions were generally lower than 1, indicating that the sources of these species were mainly outdoor air penetration rather than indoor sources. The
very weak indoor-outdoor relationships (r2 < 0.20) indicated
that the indoor and outdoor water-soluble ion components had different sources. The outdoor calcium could be related to the resuspension of road dust caused by moving vehicles and exhaust gases. In addition to the calcium delivered by outdoor air penetration, the detection of this species in classrooms may be related to the use of chalk in blackboards. This indoor source could also be responsible for the detection of carbonate and potassium in classrooms. Possible outdoor sources for these two species are, respectively, soil dust and biomass burning. Carbonates were only detected in some samples, especially those obtained in classrooms with
Alves et al., Aerosol and Air Quality Research, 13: 1521–1535, 2013 1531 0.0 1.0 2.0 3.0 4.0 5.0 6.0 7.0 8.0 9.0 10.0 % P M2. 5 ma ss City centre 0.0 0.5 1.0 1.5 2.0 2.5 3.0 I/O City centre 0.0 1.0 2.0 3.0 4.0 5.0 6.0 % P M2. 5 ma ss Residential 0.0 0.2 0.4 0.6 0.8 1.0 1.2 1.4 1.6 1.8 I/ O Residential 0.0 1.0 2.0 3.0 4.0 5.0 6.0 7.0 8.0
Na+ NH4+ K+ Mg2+ Ca2+ Cl- NO3-
SO42-% PM 2. 5 ma ss Rural 0.0 0.5 1.0 1.5 2.0 2.5
Na+ NH4+ K+ Mg2+ Ca2+ Cl- NO3-
SO42-I/ O Rural Na+ SO 4 2-NH4+ K+ Mg2+ Ca2+ Cl- NO3- Na+ NH4+ K+ Mg2+ Ca2+ Cl- NO3- SO42-
Fig. 6. Mass fractions (percentage) of water soluble ions in indoor PM2.5 and indoor-outdoor ratios.
use of chalk or in outdoor samples from the school with unpaved playground. In these samples, carbonates represented
up to 9% of the PM2.5 mass.
Correlations between Indoor PM2.5 and Comfort or
Chemical Parameters
The PM2.5 concentrations were correlated either with
their chemical constituents or with comfort parameters (Table 5). No significant correlations between meteorological
parameters and PM2.5 levels were observed. Although not
statistically significant, the negative correlations between
PM2.5 and RH indicate that aerosol levels decrease with
increasing water vapour in the air. Inconsistent results have been reported for other schools. While Fromme et al. (2007) also observed negative correlations for schools in the city of Munich and a neighbouring district, Braniš et al. (2005) presented positive associations between the two parameters. It has been argued that RH promotes the formation of ammonium nitrate, but an increase in precipitation causes a
decrease in all PM2.5 components through scavenging (Tai
et al., 2010). Some days of rain throughout the sampling
campaign in the Aveiro region may have contributed to particle scavenging in the outdoor air and, consequently, to
the decrease of PM2.5 levels indoors.
Statistically significant positive correlations between CO2
and PM2.5 were found in all schools, confirming that the
human presence and related activities represent an important source of particles indoors. This also indicates, once again, that inadequate ventilation plays a major role in the establishment of poor IAQ.
The r-square of the correlations between PM2.5 and OC
indicates that this carbonaceous component can explain 44, 91 and 45% of the variation of the indoor particle concentrations in the city centre, residential and rural schools, respectively. The statistically significant positive correlations between these two variables highlight the relevance of organic matter sources or formation processes to the particulate matter in classrooms.
Significant positive associations were found between
PM2.5 and both K+ and Ca2+, which may be related to the
use of chalk. In addition, these two water soluble ions may be associated with crustal dust. Calcium may also derive from the gradual decay of construction materials in the interior of buildings. A very significant correlation between
PM2.5 and Mg2+ was observed in the rural school. Besides
Alves et al., Aerosol and Air Quality Research, 13: 1521–1535, 2013 1532
Table 5. Correlations (r) and p-values (in brackets) between PM2.5 concentrations and chemical constituents or comfort
parameters for the 3 schools.
City centre Residential Rural
T 0.052 (0.85) –0.154 (0.58) 0.028 (0.92) RH –0.221 (0.43) –0.264 (0.34) –0.320 (0.25) CO2 0.515 0.049)* 0.684 (0.0049)** 0.547 (0.035)* OC 0.667 (0.0066)** 0.955 (0.0001)*** 0.670 (0.0063)** EC –0.065 (0.81) 0.270 (0.33) 0.560 (0.030) Na+ 0.231 (0.41) –0.470 (0.077) 0.352 (0.20) NH4+ –0.362 (0.18) 0.085 (0.76) –0.010 (0.97) K+ 0.643 (0.0097)** 0.557 (0.031)* 0.360 (0.19) Mg2+ 0.526 (0.044) –0.359 (0.19) 0.817 (0.0002)*** Ca2+ 0.417 (0.12) 0.544 (0.036)* 0.736 (0.0018)** Cl– 0.441 (0.099) –0.172 (0.54) 0.179 (0.52) NO3– –0.255 (0.36) 0.425 (0.11) –0.229 (0.42) SO42– 0.125 (0.66) 0.073 (0.80) –0.044 (0.88) * p < 0.05; ** p < 0.01; *** p < 0.001
formulation of many consumer products and construction materials (e.g., inks, toners, sealants, alloys, some types of bricks, etc.). No significant correlations between other
chemical constituents and PM2.5 levels were obtained.
CONCLUSIONS
In most indoor spaces, the average temperatures and relative humidity values were outside the comfortable ranges
stipulated by international organisations. Very high CO2
levels and extremely low outdoor air infiltration indicate excessive building tightness, very deficient ventilations and excessive room occupancy. Exposure to particulate matter in schools is high. I/O ratios greater than one for particles indicate the presence of indoor sources other than the contribution from outdoor. Indoor concentrations are strongly influenced by activities and movement of occupants, which may allow resuspension of previously deposited particles or their delayed deposition or settling. Implementation of more breaks and recesses between classes, decreasing the occupancy per room, increasing the exchange of indoor air with the outdoor, reducing human activities and improving
cleanliness of facilities might alleviate the high CO2 and
particle levels. Despite there being a large literature on class-size effects on academic achievement, in times of austere budgets, legislative actions to increase the number of pupils per class have been undertaken. However, taking into account the IAQ problems observed in most schools, policymakers need to bear in mind the possible negative effects of any increase in class size. The need to judiciously weigh costs and benefits is imperative. To develop effective risk assessment and management strategies, toxicological evaluations of particles is highly recommended in future researches. Moreover, strategies to minimise the exposure must be implemented and assessed for effectiveness in intervention studies aiming at reducing health risks of children. It should be taken into account that the benefits resulting from the adoption of strategies to improve IAQ outweigh the investment. In fact, there is growing evidence that interventions induce significant health benefits, which
are largely greater than their costs. ACKNOWLEDGEMENTS
The authors would like to thank the support of principals, staff and students. The sampling programme of this research was undertaken in parallel with additional measurements carried out in the scope of the “SINPHONIE - Schools Indoor Pollution and Health: Observatory Network in Europe” project). Because we have benefited from some logistical aspects of this project, an acknowledgement is given to its funding entity (Directorate General for Health and Consumer Affairs - DG SANCO). The analytical work was supported by the Centre of Environmental and Marine Studies (University of Aveiro).
REFERENCES
Abdel-Salam, M. (2006). Aerosol Sampling Methods in Workplace and Ambient Environments. J. Aerosol Med. 19: 434–455.
Almeida, S.M., Canha, N., Silva, A., Freitas, M.C., Pegas, P., Alves, C., Evtyugina, M. and Pio, C.A. (2011). Children Exposure to Air Particulate Matter in Indoor of Lisbon Primary Schools. Atmos. Environ. 45: 7594–7599. Alves, C., Pio, C., Campos, E. and Barbedo, P. (2007).
Size Distribution of Atmospheric Ionic Species at a Coastal Site in Portugal. Quim. Nova 30: 1938–1944. Amato, F., Pandolfi, M., Viana, M., Querol, X., Alastuey,
A. and Moreno T. (2009). Spatial and Chemical Patterns
of PM10 in Road Dust Deposited in Urban Environment.
Atmos. Environ. 43: 1650–1659.
Apte, M.G. and Erdmann, C.A. (2002). Indoor Carbon Dioxide Concentrations, VOCs, Environmental Sensitivity Association with Mucous Membrane and Lower Respiratory Sick Building Syndrome Symptoms in the BASE Study: Analyses of the 100 Building Dataset, Indoor Environment Department, Lawrence Berkeley National Laboratory, Berkeley, CA, LBNL-51570. ASHRAE (2004). ANSI/ASHRAE Standard 62.1-2004,
Alves et al., Aerosol and Air Quality Research, 13: 1521–1535, 2013 1533
Ventilation for Acceptable Indoor Air. American Society of Heating, Refrigerating and Air-Conditioning Engineers, Atlanta.
Braniš, M., Rezácová, P. and Damasová, M. (2005). The Effect of Outdoor Air and Indoor Human Activity on
Mass Concentrations of PM10, PM2.5 and PM1 in a
Classroom. Environ. Res. 99: 143–149.
Bronsema, B., Björck, M., Carrer, P., Clausen, G., Fitzner, K., Flatheim, G., Follin, T., Haverinen, U., Jamriska, M., Kurnitski, J., Maroni, M., Mathisen, M.H., Morawska, L., Müller, B., Nathanson, T., Nevalainen, A., Olesen, B.W., Pasanen, P., Seppänen, O., Säteri, J. and Witterseh, T. (2004). Performance Criteria of Buildings for Health and Comfort, ISIAQ-CIB Task Group TG 42. CIB Number 292.
Brunekreef, B., Janssen, N.A.H., de Hartog, J., Harssema, H., Knape, M. and van Vliet, P. (1997). Air Pollution from Truck Traffic and Lung Function in Children Living near Motorways. Epidemiology 8: 298–303.
Cao, J.J., Huang, H., Lee, S.C., Chow, J.C., Zou, C.W., Ho, K.F. and Watson, J.G. (2012). Indoor/Outdoor
Relationships for Organic and Elemental Carbon in PM2.5
at Residential Homes in Guangzhou, China. Aerosol Air
Qual. Res. 12: 902–910.
Cavalli, F., Viana, M., Yttri, K.E., Genberg, J. and Putaud, J.P. (2009). Toward a Standardised Thermal-Optical Protocol for Measuring Atmospheric Organic and Elemental Carbon: the EUSAAR Protocol. Atmos. Meas.
Tech. 3: 79–89.
Chao, C.Y. and Wong, K.K. (2002). Residential Indoor
PM10 and PM2.5 in Hong Kong and their Elemental
Composition. Atmos. Environ. 36: 265–277.
Chen, J., Wang, W., Liu, H. and Ren, L. (2012). Determination of Road Dust Loadings and Chemical Characteristics Using Resuspension. Environ. Monit.
Assess. 184: 1693–709.
Crilley, L., Ayoko, G.A., Mazaheri, M. and Morawska, L. (2012). Preliminary Results on the Chemical Composition of Outdoor Airborne Particles at Urban Schools and Possible Implications for the Air Quality in Classrooms,
Healthy Buildings 2012, 10th International Conference,
Official Conference of the International Society of Indoor Air Quality and Climate, 8–12 July 2012, Brisbane, QLD. Diapouli, E., Chaloulakou, A. and Spyrellis, N. (2008).
Indoor and Outdoor PM Concentrations at a Residential Environment in the Athens Area. Global Nest J. 10: 201–208.
Ekmekcioglu D. and Keskin S.S. (2007). Characterization of Indoor Air Particulate Matter in Selected Elementary Schools in Istanbul, Turkey. Indoor Built Environ. 6: 169–176.
EPA-Environmental Protection Agency (2005). IAQ Reference Guide. Tools for Schools, EPA 402-K-95-001, Third Edition, Washington D.C.
Fromme, H., Twardella, D., Dietrich, S., Heitmann, D., Schierl, R., Liebl, B. and Ruden, H. (2007). Particulate Matter in the Indoor Air of Classrooms: Exploratory Results from Munich and Surrounding Area. Atmos.
Environ. 41: 854–866.
Fromme, H., Diemer, J., Dietrich, S, Cyrys, J., Heinrich, J., Lang, W., Kiranoglu, M. and Twardella, D. (2008). Chemical and Morphological Properties of Particulate
Matter (PM10, PM2.5) in School Classrooms and Outdoor
Air. Atmos. Environ. 42: 6597–6605.
Gemenetzis, P., Moussas, P., Arditsoglou, A. and Samara, C. (2006). Mass Concentration and Elemental Composition
of Indoor PM2.5 and PM10 in University Rooms in
Thessaloniki, Northern Greece. Atmos. Environ. 40: 3195– 3206.
Gilliland, F.D., Berhane, K., Rappaport, E.B., Thomas, D.C., Avol, E., Gauderman, W.J., London, S.J., Margolis, H.G., McConnell, R., Islam, K.T. and Peters, J.M. (2001). The Effects of Ambient Air Pollution on School Absenteeism Due to Respiratory Illnesses. Epidemiology 12: 43–54.
Goyal, R. and Khare, M. (2009). Indoor-Outdoor Concentrations of RSPM in Classroom of a Naturally Ventilated School Building near an Urban Traffic Roadway. Atmos. Environ. 43: 6026–6038.
Halek, F., Kavousi, A. and Hassani, F. (2009). Evaluation of Indoor-Outdoor Particle Size Distribution in Tehran’s Elementary Schools. WASET 33: 463–466.
Huang, H., Zou, C., Cao, J., Tsang, P., Zhu, F., Yu, C. and
Xue, S. (2012). Water-soluble Ions in PM2.5 on the
Qianhu Campus of Nanchang University, Nanchang City: Indoor-Outdoor Distribution and Source Implications.
Aerosol Air Qual. Res. 12: 435–443.
Janssen, N.A.H., Brunekreef, B., van Vliet, P., Aarts, F., Meliefste, K., Harssema, H. and Fischer, P. (2003). The Relationship between Air Pollution from Heavy Traffic and Allergic Sensitization: Bronchial Hyperresponsiveness, and Respiratory Symptoms in Dutch Schoolchildren. Environ.
Health Perspect. 111: 1512–1518.
Jones, B. (2011). The Ventilation of School Classrooms in
Practice and in Context, University College London,
London.
Lai, S.C., Ho, K.F., Zhang, Y.Y., Lee, S.C., Huang, Y. and Zou, S.C. (2010). Characteristics of Residential Indoor Carbonaceous Aerosols: A Case Study in Guangzhou, Pearl River Delta Region. Aerosol Air Qual. Res. 10: 472–478.
Langer, S., Moldanova, J., Arrhenius, K., Ljungström, E. and Ekberg, L. (2008). Ultrafine Particles Produced by Ozone/Limonene Reactions in Indoor Air under Low/ Closed Ventilation Conditions. Atmos. Environ. 42: 4149– 4159.
Lee, S.C. and Chang, M. (2000). Indoor and Outdoor Air Quality Investigation at Schools in Hong Kong.
Chemosphere 41: 109–113.
Lohbeck, D. (2008). Design for Dust. T&MW April: 47–52. Lunden, M.M., Revzan, K.L., Fischer, M.L., Thatcher,
T.L., Littlejohn, D., Hering, S.V. and Brown, N.J. (2003). The Transformation of Outdoor Ammonium Nitrate Aerosols in the Indoor Environment. Atmos. Environ. 37: 5633–5644.
Mahyuddin, N. and Awbi, H.B. (2012). A Review of CO2
Measurement Procedures in Ventilation Research. Int. J.
Alves et al., Aerosol and Air Quality Research, 13: 1521–1535, 2013 1534
Martuzevicius, D., Grinshpun, S.A., Lee, T., Hu, S., Biswas, P., Reponen, T. and LeMasters, G. (2008). Traffic-related
PM2.5 Aerosol in Residential Houses Located near Major
Highways: Indoor versus Outdoor Concentrations. Atmos.
Environ. 42: 6575–6585.
Mendell, M.J. and Heath G.A. (2005). Do Indoor Pollutants and Thermal Conditions in Schools Influence Student Performance? A Critical Review of the Literature. Indoor
Air 15: 27–32.
Mohai, P., Kweon, B.S., Lee, S. and Ard, K. (2011). Air Pollution Around Schools Is Linked To Poorer Student Health and Academic Performance. Health Aff. 30: 852– 862.
Morawska, L., He, C., Johnson, G., Guo, H., Uhde, E. and Ayoko, G. (2012). Ultrafine Particles in Indoor Air of a School: Possible Role of Secondary Organic Aerosols.
Environ. Sci. Technol. 43: 9103–9109.
Na, K., Sawant, A.A. and Cocker III, D.R. (2004). Trace Elements in Fine Particulate Matter within a Community in Western Riverside County, CA: Focus on Residential Sites and a Local High School. Atmos. Environ. 38: 2867–2877.
Na, K. and Cocker III, D.R. (2005). Organic and Elemental Carbon concentrations in Fine Particulate Matter in Residences, Schoolrooms, and Outdoor Air in Mira Loma, California. Atmos. Environ. 39: 3325–3333. Norbäck, D., Wålinder, R., Wieslander, G., Smedje, G.,
Erwall, C. and Venge, P. (2000). Indoor Air Pollutants in Schools: Nasal Patency and Biomarkers in Nasal Lavage. Allergy 55:163–170.
Nunes, T., Mirante, F., Almeida, E., Pio, C. (2010). Comparison of Methods for the Quantification of the Different Carbon Fractions in Atmospheric Aerosol Samples. Geophys. Res. Abstr. 12: EGU2010–11595. Oeder, S., Dietrich, S., Weichenmeier, I., Schober, W.,
Pusch, G., Jörres, R.A., Schierl, R., Nowak, D., Fromme, H., Behrendt, H. and Buters, J. (2012). Toxicity and Elemental Composition of Particulate Matter from Outdoor and Indoor Air of Elementary Schools in Munich, Germany. Indoor Air 22: 148–158.
Olson, D.A., Turlington, J., Duvall, R.M., McDow, S.R., Stevens, C.D. and Williams, R. (2008). Indoor and Outdoor Concentrations of Organic and Inorganic Molecular
Markers: Source Apportionment of PM2.5 Using
Low-volume Samples. Atmos. Environ. 42: 1742–1751. Peacock, J., Symonds, P., Jackson, P., Bremmer, S.A.,
Scarlett, J.F. and Strachan, D.P. (2003). Acute Effects of Winter Air Pollution on Respiratory Function in Schoolchildren in Southern England. Occup. Environ.
Med. 60: 82–89.
Pegas, P.N., Nunes, T., Alves, C.A., Silva, J.R., Vieira, S.L.A., Caseiro, A. and Pio, C. (2012). Indoor and Outdoor Characterisation of Organic and Inorganic Compounds in City Centre and Suburban Elementary Schools of Aveiro, Portugal. Atmos. Environ. 55: 80–89. Pénard-Morand, C., Charpin, D., Raherison, C.,
Kopferschmitt, C., Caillaud, D., Lavaud, F. and Annesi-Maesano, I. (2005). Long-term Exposure to Background Air Pollution Related to Respiratory and Allergic Health
in Schoolchildren. Clin. Exp. Allergy 35: 1279–1287. RCESE (2006). Regulamento dos Sistemas Energéticos de
Climatização de Edifícios (National System for Energy and Indoor Air Quality Certification of Buildings). Decreto-Lei nº 79/2006, Ministério das Obras Públicas; Transportes e Comunicações. Portugal.
Richmond-Bryant, J., Saganich, C., Bukeiwicz, L. and Kalin,
R. (2009). Associations of PM2.5 and Black Carbon
Concentrations with Traffic, Idling, Background Pollution, and Meteorology During School Dimissals. Sci. Total
Environ. 407: 3357–3364.
Saraga, D.E., Maggos, T., Helmis, C.G., Michopoulos, J.,
Bartzis, J.G. and Vasilakos, C. (2010). PM1 and PM2.5
Ionic Composition and VOCs Measurements in Two Typical Apartments in Athens, Greece: Investigation of Smoking Contribution to Indoor Air Concentrations.
Environ. Monit. Assess. 67: 321–331.
Shaughnessy, R.J., Haverinen-Shaughness, U., Nevalainen, A. and Moschandreas, D. (2006). A Preliminary Study of the Association between Ventilation Rates in Classrooms and Student Performance. Indoor Air 16: 465–468. Shendell, D.G., Prill, R., Fisk, W.J., Apte, M.G., Blake, D.,
and Faulkner, D. (2004). Associations between
Classroom CO2 Concentrations and Student Attendance
in Washington and Idaho. Indoor Air 14: 333–341. Simoni, M., Annesi-Maesano, I., Sigsgaard, T., Norback,
D., Wieslander, G., Lystad, W., Canciani, M., Viegi, G. and Sestini, P. (2006). Relationships between School Indoor Environment and Respiratory Health in Children of Five European Countries (HESE Study). Eur. Respir.
J. 28: 837s.
Simoni, M., Annesi-Maesano, I., Sigsgaard, T., Norback, D., Wieslander, G., Nystad, W., Canciani, M., Sestini, P. and Viegi, G. (2010). School Air Quality Related to Dry Cough, Rhinitis and Nasal Patency in Children. Eur.
Respir. J. 35: 742–749.
Smolík, J., Dohányosová, P., Schwarz, J., Ždímal, V. and Lazaridis, M. (2008). Characterization of Indoor and Outdoor Air in a Suburban Area of Prague. Water Air
Soil Pollut. Focus 8: 35–47.
Sawant, A.A., Na, K., Zhu, X., Cocker, K., Butt, S., Song, C. and Cocker III, D.R. (2004). Characterization of
PM2.5 and Selected Gas-Phase Compounds at Multiple
Indoor and Outdoor Sites in Mira Loma, California.
Atmos. Environ. 38: 6269–6278.
Tai, A.P.K., Mickley, L.J. and Jacob, D.J. (2010).
Correlations between Fine Particulate Matter (PM2.5)
and Meteorological Variables in the United States:
Implications for the Sensitivity of PM2.5 to Climate Change.
Atmos. Environ. 44: 3976–3984.
Tillet, T. (2010). Formaldehyde Exposure among Children: A Potential Building Block of Asthma. Environ. Health
Perspect. 118: a131–a131.
Van Roosbroeck, S., Jacobs, J., Janssen, N.A.H., Oldenwening, M., Hoek, G. and Brunekreef, B. (2007).
Long-Term Personal Exposure to PM2.5, Soot and NOx
in Children Attending Schools Located near Busy Roads, a Validation Study. Atmos. Environ. 41: 3381–3394. Ward, T.J., Noonan C.W. and Hooper, K. (2007). Results
Alves et al., Aerosol and Air Quality Research, 13: 1521–1535, 2013 1535
of an Indoor Size Fractionated PM School Sampling Program in Libby, Montana. Environ. Monit. Assess. 130: 163–171.
Wargocki, P., and Wyon, D.P. (2006). Research Report on Effects of HVAC on Student Performance. ASHRAE J. 48: 23–28.
Waring, M.S. (2009). Indoor Secondary Organic Aerosol Formation: Influence of Particle Controls, Mixtures, and Surfaces, PhD Thesis, The University of Texas at Austin, USA.
Waring, M.S., Wells, J.R. and Siegel, J.A. (2011). Secondary Organic Aerosol Formation from Ozone Reactions with Single Terpenoids and Terpenoid Mixtures. Atmos.
Environ. 45: 4235–4242.
Zhu, C.S., Cao, J.J., Tsai, C.J., Shen, Z.X., Ho, K.F. and Liu, S.X. (2010). The Indoor and Outdoor Carbonaceous Pollution during Winter and Summer in Rural Areas of Shaanxi, China. Aerosol Air Qual. Res. 10: 550–558. Zhu, C.S., Cao, J.J., Shen, Z.X., Liu, S.X., Zhang, T.,
Zhao, Z.Z., Xu, H.M. and Zhang, E.K. (2012). The
Indoor and Outdoor Chemical Components of PM2.5 in
Rural Area of Northwestern China-Case Study. Aerosol
Air Qual. Res. 12: 1157–1165.
Received for review, November 21, 2012 Accepted, April 15, 2013