UNIVERSIDADE DE LISBOA
FACULDADE DE CIÊNCIAS
DEPARTAMENTO DE BIOLOGIA ANIMAL
Parental care and adaptation to the laboratory
on the burying beetle Nicrophorus vespilloides
Mário Artur Santos Mira
Mestrado em Biologia Evolutiva e Desenvolvimento
Dissertação orientada por:
Dr.ª Rebecca Kilner
Dr.ª Sara Magalhães
Acknowledgments/Agradecimentos
Agradeço aos meus pais por toda a ajuda que me deram ao longo de todo o percurso académico e especialmente neste último passo.
Agradeço à Joana pelo apoio indispensável na completação desta dissertação. Agradeço à minha família e amigos por todo o apoio que me deram.
I want to thank both my supervisors for their willingness to help.
And I want to thank the Kilner group, especially Ana Duarte and Ornela de Gasperin Quintero for all the help when designing and performing the experiments found in this dissertation.
Abstract (English)
The evolution of behaviour and social immunity can be hard topics to study. Often, complex interactions between them can be hard to decipher. The burying beetle Nicrophorus vespilloides has some very useful characteristics which allow the study of how parental care and social immunity interact and evolve together. In this dissertation I performed two experiments aiming to test this. The first experiment (cross fostering) controls how much is invested in social immunity by the mothers and allows us to observe the effects it has on parental care on the following generation. In the second experiment (varying care) the amount of parental care given to larvae is controlled, which allows us to observe the effects on social immunity investment. Results from the first experiment show a positive effect of social immunity in the following generation’s social immunity investment and larval density. The second experiment shows that larval survival depends heavily if there is direct care and larvae that received less care tended to have a higher investment in social immunity. When pooling results from all the tested generations in this dissertation some interesting results were found: investment in social immunity tended to increase over time, with males approaching the female’s values; larval density tended to decrease over time; and average larval mass tended to increase over time. Overall these results point to the existence of a complicated network of interactions between parental care and social immunity that determine the survival and well-being of offspring, and therefore, fitness of an individual burying beetle. The adaptation results also suggest that experiments with populations which have been in the laboratory for some time might not be the best way to study specific biological characteristics but are still very useful for evolutionary and adaptive characteristics.
Key words
Abstract (Português)
A evolução do comportamento e da imunidade social podem ser tópicos difíceis de estudar. Muitas vezes existem interacções complexas entre eles que podem ser difíceis de decifrar. O burying beetle
Nicrophorus vespilloides tem algumas características bastante úteis que permitem estudar como os
cuidados parentais e a imunidade social interagem e evoluem em conjunto. Nesta dissertação eu efectuei duas experiências para observar como um afecta o outro, e vice versa. Na primeira experiência (adopção cruzada) é controlada a quantidade de investimento em imunidade social por parte das mães o que permite o seu efeito nos cuidados parentais na geração seguinte enquanto que na segunda experiência (variação de cuidados) é controlada a quantidade de cuidados parentais prestados às larvas o que permite observar os seus efeitos no investimento na imunidade social. Os resultados na primeira experiência mostram um efeito positivo do investimento na imunidade social no investimento na imunidade social e na densidade larval da geração seguinte. Os resultados da segunda experiência mostram que a sobrevivência das larvas depende bastante se estas recebem ou não cuidados parentais directos e que as larvas que receberam menos cuidados tendem a mostrar um maior investimento em imunidade social. Quando aglomerados os dados de todas as gerações utilizadas nesta dissertação alguns resultados interessantes foram encontrados: o investimento em imunidade social tendeu a aumentar com o tempo, com os valores dos machos a aproximarem-se dos valores das fêmeas; a densidade larval tendeu a diminuir com o tempo; e a média da massa larval tendeu a diminuir com o tempo. No geral estes resultados apontam para a existência de uma complicada rede de interacções entre cuidados parentais e imunidade social que determina a sobrevivência e bem estar da descendência, e como tal, o fitness de cada escaravelho individual. Os resultados ao longo do tempo sugerem que experiências em populações que estejam em condições de laboratório à algum tempo podem não ser a melhor forma de estudar características biológicas especificas mas são ainda bastante úteis para características evolutivas ou adaptativas.
Palavras chave
Actividade lítica, Cativeiro, Imunidade social, Selecção
Resumo
Com o titulo Cuidados parentais e adaptação ao laboratório no burying beetle Nicrophorus
vespilloides, esta dissertação tem como objectivo estudar como esta espécie de escaravelho cuida da
sua ninhada de larvas directa e indirectamente e como estas características mudam com a adaptação às condições de laboratório.
O N. vespilloides é um escaravelho com um comportamento parental peculiar. Os casais enterram carcaças de pequenos mamíferos e aves, espalham secreções anais sobre a carcaça e depositam os ovos à volta da carcaça. Quando eclodem, as larvas alimentam-se da carcaça e são alimentadas à boca pelos pais. Este comportamento de espalhar secreções anais na carcaça é considerado imunidade social. Este tipo de imunidade não é direccionado ao indivíduo que o produz, mas à saúde da comunidade. Imunidade social é uma característica de insectos sociais onde as grandes densidades os tornam mais susceptíveis à infecção e transmissão de parasitas.
Em cativeiro, os indivíduos estão expostos a condições muito mais estáveis e com menos ameaças. No caso de N. vespillioides estas ameaças incluem predadores e lutas pelo acesso às carcaças. É sabido que muitas características fisiológicas e comportamentais são afectadas com alterações no ambiente, ambas naturais e relacionadas com cativeiro. Tendo isto em consideração, é lógico pressupor que tais mudanças serão observadas no comportamento parental de N. vespilloides e em outras características relacionadas.
De modo a identificar se aspectos ambientais exercem alguma influência no comportamento parental, indivíduos adultos de N. vespilloides foram classificados em Investimento Alto ou Investimento Baixo tendo em conta a actividade lítica das secreções anais. Após emparelhamento de acordo com o tipo de investimento, a descendência foi posta ao cuidado de mães adoptivas com o mesmo tipo de investimento ou investimento contrário. Foi observado que fêmeas investem significativamente mais em imunidade social do que os machos, e que a actividade lítica das mães biológicas influencia positivamente a actividade lítica da descendência e o número de larvas, tendo em conta o tamanho da carcaça. Estas observações apontam para a ausência de um efeito do ambiente e para esta característica ser maioritariamente controlada por pelos factores genéticos, sendo que não existe uma influência óbvia das mães adoptivas. Ainda assim, o tamanho da descendência tendeu a variar adicionalmente com o tipo de investimento da mãe adoptiva, com indivíduos originados de mães biológicas de Alto Investimento e criados por mães adoptivas de Alto Investimento sendo maiores do que os criados por mães adoptivas de Baixo Investimento.
O aspecto genético foi adicionalmente explorado pela manipulação da extensão do comportamento parental providenciado. Indivíduos foram divididos em três grupos: Cuidado Total, onde nenhuma interferência foi aplicada para além da medição das secreções; Cuidado Parcial, onde os pais foram retirados após terem preparado a carcaça; e Ausência de Cuidado, onde os pais foram retirados e a carcaça substituída por outra não preparada. A sobrevivência das larvas dependeu do tipo de tratamento de que foram alvo, com indivíduos do grupo Cuidado Total a terem uma sobrevivência mais alta que os dos outros grupos. O valor da actividade lítica dos pais influenciou de forma negativa a sobrevivência da ninhada, enquanto que a das mães não. Embora contra intuitivo, este facto pode estar relacionado com a existência de um trade-off entre comportamentos parentais directos (alimentar à boca) e indirectos (secreções), que poderá levar a um aumento do canibalismo para controlo da densidade da ninhada. O tamanho da carcaça influenciou negativamente a densidade da ninhada, provavelmente devido ao limite dos recursos e canibalismo pelos pais. Uma tendência para que ninhadas de mães que produzam secreções mais activas tivessem ninhadas menos densas, fazendo assim com que indivíduos de ninhadas mais densas tivessem ninhadas menos densas. A actividade
lítica da primeira geração foi influenciada pelo tipo de cuidados parentais que receberam, com indivíduos do grupo com comportamento parental Cuidado Total a terem secreções menos activas que os outros. Isto está possivelmente relacionado com limites energéticos e trade-offs entre os comportamentos parentais directos e indirectos, uma vez que indivíduos que receberam menos cuidados parentais a investir mais nas secreções anais.
Por último, o efeito adaptativo das variações observadas foi analisado. A colónia foi seguida por cinco gerações e a evolução de vários factores foi seguida. A densidade das ninhadas diminuiu ao longo das gerações enquanto o tamanho dos indivíduos e o investimento em imunidade social aumentou. O aumento em imunidade social pode estar relacionado com maior disponibilidade de comida em cativeiro, assim como com uma maior exposição a patogéneos devido ao ambiente fechado. O investimento em imunidade social dos machos aumentou mais rapidamente que os das fêmeas. Esta disparidade é expectável uma vez que inicialmente fêmeas investiram mais que machos, e que machos nestas condições não têm a possibilidade de acasalar com várias fêmeas, e por isso investem mais na única ninhada que têm. Tendo em conta todas as observações, a colónia aparenta estar a sofrer uma alteração na estratégia reprodutiva, de r (quantidade) para K (qualidade). Estratégias reprodutivas r são frequentemente associadas com ambientes variáveis, com muitas ameaças e recursos; estratégias reproductivas K, pelo contrário, estão associadas com ambientes estáveis, com poucos recursos ou com menos espaço. Uma vez que o espaço em laboratório é limitado e estável, é expectável que a mudança observada aconteça.
Index
Acknowledgments/Agradecimentos...i
Abstract (English)...ii
Key words...ii
Abstract (Português)...iii
Palavras chave...iii
Resumo...iv
Index...vi
List of Figures...vii
List of Tables...ix
Abbreviations...x
1. INTRODUCTION...1
1.1. Social immunity...1
1.2. Natural selection...2
1.3. Burying beetle...3
1.4. Objectives...3
2. METHODOLOGY...5
2.1. Nicrophorus vespilloides colony...5
2.2. Collection of anal exudates...5
2.3. Lysozyme-like antibacterial activity...5
2.4. Cross-fostering...5
2.5. Influence of parental care...6
2.6. Pronotum width...6
2.7. Adaptation analysis...7
2.8. Data treatment...7
3. RESULTS...8
3.1. Cross-fostering...8
3.2. Influence of parental care...12
3.3. Adaptation...30
4. DISCUSSION...36
4.1. Cross-fostering...36
4.2. Influence of parental care...37
4.3. Adaptation...38
5. FINAL REMARKS...39
6. REFERENCES...40
List of Figures
Figure 3.1. Mean lytic activity of anal exudates in relation to gender. Error bars represent standard
deviation………...8
Figure 3.2. Lytic activity of anal exudates plotted against maternal lytic activity of anal exudates. ………..9
Figure 3.3. F2 Larval density plotted against F1 lytic activity of anal exudates……...………10
Figure 3.4. F1 pronotum width plotted against biological mother pronotum width………...11
Figure 3.5. F1 pronotum width plotted against both biological mother category and foster mother category………...……11
Figure 3.6. Block A brood survival plotted against treatment………...12
Figure 3.7. Block B brood survival plotted against treatment………...13
Figure 3.8. Block A brood survival plotted against paternal lytic activity of anal exudates……….…13
Figure 3.9. Block B brood survival plotted against paternal lytic activity of anal exudates………….14
Figure 3.10. Block A brood survival plotted against the number of transferred larvae……….14
Figure 3.11. Block B brood survival plotted against maternal lytic activity of anal exudates………..15
Figure 3.12. Block A larval density plotted against mouse carcass weight………...16
Figure 3.13. Block B larval density plotted against mouse carcass weight………...16
Figure 3.14. Block A larval density plotted against brood survival……….…..17
Figure 3.15. Block B larval density plotted against brood survival……….…..17
Figure 3.16. Block A larval density plotted against treatment……….…..18
Figure 3.17. Block B larval density plotted against treatment………...18
Figure 3.18. Block A larval density plotted against maternal lytic activity of anal exudates………....19
Figure 3.19. Block B larval density plotted against maternal lytic activity of anal exudates…………19
Figure 3.20. Block B larval density plotted against paternal lytic activity of anal exudates………….20
Figure 3.21. Block A larval density plotted against F1 lytic activity of anal exudates……….….20
Figure 3.22. Block A mean F1 lytic activity of anal exudates in relation to treatment………..21
Figure 3.23. Block B mean F1 lytic activity of anal exudates in relation to treatment……….22
Figure 3.24. Block A mean F1 lytic activity of anal exudates in relation to gender………..22
Figure 3.25. Block B mean F1 lytic activity of anal exudates in relation to gender……….….23
Figure 3.26. Block A F1 lytic activity of anal exudates plotted against brood survival………23
Figure 3.27. Block B F1 lytic activity of anal exudates plotted against paternal lytic activity of anal exudates………..24
Figure 3.28. Block A average larval mass in relation to larval density………..…25
Figure 3.29. Block B average larval mass in relation to larval density……….25
Figure 3.30. Block A average larval mass in relation to maternal lytic activity of anal exudates…….26
Figure 3.31. Block B average larval mass in relation to maternal lytic activity of anal exudates….…26 Figure 3.32. Block A average larval mass in relation to brood survival………....27
Figure 3.33. Block B average larval mass in relation to brood survival………27
Figure 3.34. Block A average larval mass in relation to mouse carcass weight………28
Figure 3.35. Pronotum width plotted against larval mass at dispersal……….……..29
Figure 3.36. Mean Pronotum width in relation to gender……….….29
Figure 3.37. Lytic activity of anal exudates in relation to generation in the laboratory………30
Figure 3.38. Lytic activity of anal exudates in relation to generation in the laboratory………31
Figure 3.39. Lytic activity of anal exudates in relation to mouse carcass weight……….….31
Figure 3.40. Larval density in relation to mouse carcass weight………...32
Figure 3.41. Larval density in relation to generation in the laboratory……….33
Figure 3.42. Average larval mass in relation to generation in the laboratory………34
Figure 3.43. Average larval mass in relation to larval density………...34
List of Tables
Supplementary table 6.1. Starting and final model as well as results for investment in social
immunity for the cross fostering experiment………..44
Supplementary table 6.2. Starting and final model as well as results for larval density for the cross
fostering experiment………...45
Supplementary table 6.3. Starting and final model as well as results for larval density for the cross
fostering experiment………...46
Supplementary table 6.4. Starting and final model as well as results for brood survival for the vertical
transmission experiment (Block A)………47
Supplementary table 6.5. Starting and final model as well as results for brood survival for the vertical
transmission experiment (Block B)………48
Supplementary table 6.6. Starting and final model as well as results for larval density (offspring) for
the vertical transmission experiment (Block A)……….49
Supplementary table 6.7. Starting and final model as well as results for larval density (offspring) for
the vertical transmission experiment (Block B)……….50
Supplementary table 6.8. Starting and final model as well as results for anal exudate’s lytic activity
for the vertical transmission experiment (Block A)………51
Supplementary table 6.9. Starting and final model as well as results for anal exudate’s lytic activity
for the vertical transmission experiment (Block B)………52
Supplementary table 6.10. Starting and final model as well as results for average larval mass
(offspring) for the vertical transmission experiment (Block A)………..53
Supplementary table 6.11. Starting and final model as well as results for average larval mass
(offspring) for the vertical transmission experiment (Block B)………..54
Supplementary table 6.12. Starting and final model as well as results for pronotum width for the
vertical transmission experiment (Block B)………...…55
Supplementary table 6.13. Starting and final model as well as results for anal exudate’s lytic activity
for the adaptation to the lab analysis………..56
Supplementary table 6.14. Starting and final model as well as results for larval density for the
adaptation to the lab analysis………..57
Supplementary table 6.15. Starting and final model as well as results for average larval mass for the
adaptation to the lab analysis………..58
Abbreviations
AIC Akaike Information Criterion
F F-value
F0 Parental generation
F1 First offspring generation
F2 Second offspring generation
FC Full Care
H High investment females
L Low investment females
NC No Care
p p-value
PBS Phosphate Buffered Saline
PC Pre hatching Care
sd Standard deviation
t t-value
1. INTRODUCTION
1.1. Social immunity
Throughout its life span, an individual has to deal with different threats to its development, survival and reproduction. In general, the better an individual is able to deal with these threats, the higher its fitness is (Piam, 1994). Immune responses are among the most important fitness traits of an individual. Elimination of parasitic micro-organisms not only increases personal survival, but also allows for longer and/or more successful breeding periods in highly parasitic environments, thus indirectly increasing fitness. However the effect of immunity on fitness can be more direct when social immunity is involved.
Social immunity was initially defined by Cremer et al. (2007) as the "collective action or altruistic behaviours of infected individuals that benefit the colony". This definition was later expanded by Cotter & Kilner (2010) which defined social immunity as “any type of immune response that has been selected to increase the fitness of the challenged individual and one or more recipients”, and the initial definition to be used for collective immunity. The expanded definition draws attention to the importance of the evolutionary origin of the behaviour rather than simply describing its effects. This type of immunity is commonly observed in social insects, whose high densities and low genetic diversity makes them more susceptible to parasites. Social immunity results from an altruistic action of an individual or the community to reduce the risk of disease transmission. These defences can be behavioural, physiological or organisational (Cremer et al. 2007).
1.1.1. Types of social immunity
Social immunity is generally divided in two groups: prophylactic, mechanisms that happen even when the pathogenic agent is not present; and active defences, mechanisms that are activated once the pathogenic agent in present (Cremer et al. 2007). Prophylactic social immunity is commonly observed in burying beetles and termites. Burying beetles smear carcases of small animals with antimicrobial compounds on which larvae will develop (see more below). Termites on the other hand fumigate the nest with naphthalene and antiseptic agents in order to prevent the establishment of parasites within (Chen et al. 1998).
In addition, social immunity can be divided according to the step of parasite invasion on which it acts; it can prevent the entrance of the parasite, its establishment or its spread (Cremer et al. 2007). A known example of a mechanism that prevents the entrance of the parasite is that of the honey bees, which are known to target conspecifics infected with hairless black syndrome and kill them before they can re-enter the nest (Waddington and Rothenbuhler, 1976). Once a parasite has entered a colony or nest, there are several mechanisms to prevent its establishment. Leaf cutter ants have a particular type of worker that concentrates on the removal of waste material, which could easily lead to the growth of pathogenic organisms (Bot et al. 2001) and burying beetles use anal secretions with lytic activity to inhibit the growth of soil micro-organisms in their nest (Arce et al., 2013). And finally, to prevent a pathogen to spread within a colony, insects have developed several ways to signal and isolate infected individuals. This is observed in dampwood termites on which individuals that have been in contact with fungal spores make a vibratory mote display in order to warn the others to avoid contact (Rosengaus et al., 1999).
1.1.2. Evolution of social immunity
One of the downsides of group living is increased exposure to pathogens (Meunier, 2015). Still, in some social insects, the intensified immunological effort expected from individuals when exposure to pathogens is increased is not observed due to a trade off with the social immunity system. In Chortoicetes terminifera a decrease of personal immunity is observed when individuals are isolated (Miller & Simpson, 2010). Still, social immunity is both energetically costly and time consuming (Pie et al. 2005). The value of mechanisms that nurture infected individuals can be easily determined, while the mechanisms that exclude or kill them raise more questions. The high genetic similarity between individuals in social groups may be a key factor to the type of responses involved, since the death of a particular individual would still allow the reproduction of closely related kin and so the spread of most of its genes (West & Griffin & Gardner, 2007).
The fundamental principle of whether social immunity is a by-product or a driver of group living is still debated, and the origin itself of these mechanisms is still not fully understood. The more popular hypotheses are: adaptation of previously evolved mechanisms of parasite defence, and mechanisms evolved for individual parasite defence and evolved into communication (Rosengaus et al. 2004). The first hypothesis must be approached carefully since social immunity is fundamentally different from individual defence mechanisms of solitary species when in social situations (Wilson et al. 2002).
It's generally accepted that for a trait to be selected for, it should be mainly dependent on genetic factors. Heritability of immune traits ranges from very high to very low within a single trait (Cotter & Wilson, 2002). Decanini et al. (2007) showed that these differences in immune responses’ heritability can be as extreme as between full sisters in bees, an eusocial environment. This suggests that these traits are influenced by environmental and possibly behavioural factors in addition to their genetic regulation.
1.2. Natural selection
Several theories were developed throughout history trying to explain the observed variation of living organisms, the most popular being Creationism and Lamarckism. In 1859 Charles Darwin introduced a new concept, natural selection, and defined it as the “principle by which each slight variation [of a trait], if useful, is preserved” (Darwin, 1859). This theory challenged all previous ones by merging the concepts of adaptation and heritability. Natural selection is the base of modern day evolutionary theory and is based on the principle that the individuals that are best adapted to their environment are more likely to survive and reproduce. Natural selection is only possible due to mutation and heritability. On one side mutation creates variation and on the other heritability passes the selected variation to the offspring, variation on which natural selection will act.
1.2.1. Natural selection in laboratory
When a population encounters a new environment, natural selection “moves the goalposts” to new values and adaptation begins. The scale at which evolution acts to most macro organisms is very long and it would be infeasible for a single researcher to study so it. Organisms that have a shorter life span present better study subjects and allow for the process of natural selection to be observed in real time. When carrying out these observations in a laboratory, the possibility to manipulate the environment is added and allows for the development of a wide range of scientific questions.
This adaptation when encountering a new environment does not require the direct manipulation of environmental parameters in the laboratory. This happens frequently when new populations are established in laboratory, even when conditions are as close as possible to their natural environment. Lack of biotic interactions and little variance in abiotic conditions might be some of the most important factors. As seen before with D. subobscura, evolution can happen relatively quickly in the laboratory (as an example the trait “early fecundity” in Matos, Avelar, & Roseà, (2002) and Santos et al., (2010)).
1.3. Burying beetle
The burying beetle (Nicrophorus vespilloides) is one of the few insect species with both bi-parental care and social immunity. Their breeding strategy relies on preparing small vertebrate carcases on which the larvae feed. There is competition for carcasses by the adults where most fights are resolved by body size, with bigger individuals winning almost every time (Bartlett & Ashworth, 1988). Once carcases are acquired, pairs of burying beetles prepare them by burying them, rolling them into a ball, and smearing anti-microbial oral and anal exudates on their surface (this preparation can be described as indirect parental care). After the carcass is prepared (approximately 48 hours after mating), the female lays her eggs in the soil around the carcass. Upon hatching, larvae move into an opening on the carcass where they feed by themselves and are fed by the parents (since there’s direct contact between parents and larvae, this can be described as direct parental care). During this first stage of larval development, parents can cull the clutch to their desired size (Bartlett & Ashworth, 1988). The larvae also produce and release these exudates (Arce et al., 2013). The presence of the parents during larvae development influences deeply their growth rate, taking 25% longer for larvae to develop without parents and 50% longer without parents or carcass (Anduaga & Huerta, 2001). Several factors are known to influence clutches, for instance: female size is strongly linked to mean clutch size (Steiget et al., 2007); and brood size has a negative relationship with larval mass with small carcasses having a smaller “leeway” (Nagano and Suzuki, 2007), and end up being smaller adults even after culling by the parents. Larvae sacrifice energy reserves (and therefore weight) at eclosion allowing them to have a larger body and the possibility to, posteriorly, gain weight as adults (Bartlett & Ashworth, 1988).
1.4. Objectives
In this dissertation I look into how direct and indirect parental care affect each other and search for evidence that short-term evolution might be happening with burying beetles in the laboratory. For the development of these experiments, N. vespilloides was selected due to being very easy to maintain and reproduce in laboratory conditions, thus making it a great model to study these topics. In addition their parental behaviour associated with social immunity fitted the research questions I explored. Burying beetles are used for many behavioural studies and so laboratory adaptation needs to be considered when developing such studies.
To achieve the (proposed) objective I investigate whether the investment in social immunity is affected by genetic effects, by early environmental effects, or both. Specifically, three aspects were explored: 1) The influence of genetic effects; 2) The influence of environmental effects; and 3) Heritability of adaptations.
1) Assuming there is a trade-off between the investment in social immunity and the investment in parental care, a cross-fostering experiment between high investment and low investment families was designed.
2) The environmental effects considered were associated with parental care. Larvae were reared with different levels of parental care and their development analysed.
3) Finally, to determine whether the adaptations observed were genetically inherited and whether the population was moving towards another state of stability in their environment, different traits were evaluated through time.
2. METHODOLOGY
2.1. Nicrophorus vespilloides colony
The N. vespilloides colony was established in May 2005 from wild-caught beetles which had been trapped in Madingley Woods, Cambridge, UK. Wild-caught beetles were added to the colony each subsequent year to maintain genetic diversity. Beetles were maintained in a temperature controlled room at 21ºC. Each female was paired with a non-sibling male and placed in a plastic container (17 * 12 * 6 cm), one-third filled with moist, non-sterile soil and provided with a newly defrosted mouse carcass. The aim was to simulate the microbial conditions the beetles might experience in nature when finding a recently dead carcass. The breeding box was kept in the dark to simulate underground conditions. Around 8–10 days after the parents were mated, their offspring dispersed from the carcass. At this point, larvae were removed from the soil and placed individually in a plastic box, which was filled with moist peat. Upon reaching adulthood, beetles were transferred to individual boxes (12 * 8 * 2 cm) and fed twice a week on small pieces of minced beef until required for experiments or breeding. Between 20 and 100 pairs successfully produced offspring in each generation. This population had been reared under standard laboratory conditions for 55 generations at the start of the experiment.
2.2. Collection of anal exudates
When handled, the majority of beetles release a brown secretion from their abdomen, which can be easily collected using a glass capillary tube and blown into an eppendorf tube for storage. These samples were stored at -20ºC if used within 7 days and at -80ºC if used later than 7 days in the lysozyme-like antibacterial activity assays.
2.3. Lysozyme-like antibacterial activity
Lytic activity against the bacterium Micrococcus lysodeikticus (gram-positive soil bacteria) was determined using a lytic zone assay. Agar plates containing 10 mL of 1% agar with 10 mg.mL-1
freeze-dried M. lysodeikticus were used. For each plate, 20 holes with a diameter of 2 mm were punched in the agar and 1 μL of diluted (1:5 in PBS) anal exudate was placed in each well, with two independent replicates per sample. The plates were then incubated at 33ºC for 24h and photographed using a digital camera. The diameter of the clear zones was calculated using Image J software (http://rsweb.nih.gov/ij/ - version 1.47v). Standard curves were obtained for each plate using a serial dilution of hen egg white lysozyme (0.05, 0.1, 0.5, 1 and 2 mg.mL-1). Concentration of
lysozyme-equivalents in mg were then calculated by averaging the two replicates.
2.4. Cross-fostering
Adult females were randomly paired with non-sibling males and set to breed alone with a small mouse carcass (10-15g) after 24 hours. On the second day after being set to breed, exudates were collected from all individuals and tested with the antibacterial activity assay. These females were then put on a new breeding box along with their respective prepared carcass and a small portion (~2g) of minced beef is left on the original box (to attract larvae). On the following morning 5 larvae were transferred to their respective mother's box and the breeding bout was allowed to continue normally.
From the results of the antibacterial assay these females were divided into two categories (separated by the population's median): high investment (H) and low investment (L) females. Two weeks after the first breeding bout, a similar breeding bout was prepared with the same group of females. Larvae were then cross-fostered between females of different categories (H to L and L to H, n = 7 and n = 6, respectively) and between females of the same category (H to H and L to L, n = 6 and n = 6, respectively). All broods in this experiment were composed of 5 larvae.
After reaching sexual maturity each individual of the second generation was paired with a non-sibling individual of the same treatment (HH, HL, LH, LL, with the respective samples sizes of 11, 12, 9, 8). Once again, exudates were collected on the second day of the breeding bout and tested with the antibacterial activity assay. Individual pronotum width, brood size and total brood mass of these pairs were also collected.
2.5. Influence of parental care
Two slightly different blocks of this experiment were performed: A and B. In block A adult N.
vespilloides females were collected, randomly paired with non-sibling males and divided evenly
across two treatments: full care (FC – Full Care) and no care with parent prepared carcass (PC – Pre-hatching Care). These treatments should show what happens with the contact between parent and offspring going from direct exposure (FC) to exposure only with parent exudate (PC). A total of 60 pairs were made with 30 pairs in each treatment. In block B the same procedure was followed with 3 treatments: FC and PC as the previous block and a treatment without any parental care and an unprepared mouse carcass (NC – No Care).
On the second day after pairing (~48h) exudates were collected from all adults according to the procedure described previously and used in a lysozyme-like antibacterial activity assay. At this time in a typical breeding event, mating, carcass preparation, and egg laying have occurred but larvae have yet to hatch. The adults were then discarded in the NC (block B) treatment, or put in a new breeding box along with their respective prepared carcass overnight in the F and PC treatments (both blocks). The carcass was then replaced by ~2g of minced beef in every breeding box where the eggs remained as a way to attract and congregate recently hatched larvae. On the following day (third day after pairing, ~72h) larvae are collected, counted and: 1) put directly on the carcass (in the new breeding box) with their respective parents in the FC treatment (both blocks); 2) put directly on the carcass (in the new breeding box) after removing the parents in the PC treatment (both blocks); 3) put directly on a slit made on the abdomen (below the ribs) of a new (unprepared) mouse carcass in the NC treatment (block B). 8 days after the breeding event began, the larvae start to disperse from the carcass and can be collected. In the act of collection they were counted, individually weighted and put in individual containers in plastic boxes (12 * 8 * 2 cm) to pupate for approximately 3 weeks.
Approximately 2 weeks after these larvae reach adulthood they were paired with a random non-sibling adult from their respective treatment and given a normal breeding box and carcass for breeding (no treatments were applied). Anal exudate's lytic activity, larval density and average larval mass were measured in the following generation in both blocks. Pronotum width was measured in the following generation in block B.
2.6. Pronotum width
Individual larval mass was measured (to the nearest 0.1 mg using a digital scale) in the broods of generations 60 and 61 as well as each respective adult pronotum width (using digital calipers to the
nearest 0.01 mm in adults of generations 61 and 62). The pronotum is the dorsal sclerite of the foremost segment of the thorax (the prothorax) in insects and is widely used in this genus as a surrogate for body size (Beeler et al., 1999). Only data from the FC larvae of generation 60 was used in the statistical analysis.
2.7. Adaptation analysis
To analyse if there was adaptation to the laboratory, data from generations 57, 58, 60 and 61 was used. I looked into how investment in social immunity, larval density and average larval mass reacted to time in the laboratory. Only the Full Care treatment from the “Influence of parental care” experiment was used due to its similarity to normal stock population conditions.
2.8. Data treatment
Only data points with no missing values were used in each analysis.
Cross-fostering experiment: Lysozyme-like antibacterial activity values were log-transformed
(both F0 and F1) to approach normality. Larval density (larva / gram of carcass) was used instead of brood size as a measure of efficiency in the use of available resources. Linear models were used for each observed variable and the final models were obtained by removing from the full model fixed factors which reduced the model's Akaike Information Criterion (AIC) when removed (Supplementary tables).
Influence of parental care experiment: Lysozyme-like antibacterial activity values were
log-transformed (in all data sets) to approach normality. Larval density (larva / gram of carcass) was used instead of brood size to have a measure of efficiency in the use of available resources. Final models were obtained by removing from the full model factors which reduced the model's AIC in a stepwise fashion.
Adaptation tests: Lysozyme-like antibacterial activity values were log-transformed (in all data
sets) to approach normality. Larval density (larva / gram of carcass) was used instead of brood size to have a measure of efficiency in the use of available resources. The final model for each tested variable was obtained by removing from the full model factors which reduced the model's AIC in a stepwise fashion.
3. RESULTS
3.1. Cross-fostering
3.1.1. Investment in social immunity
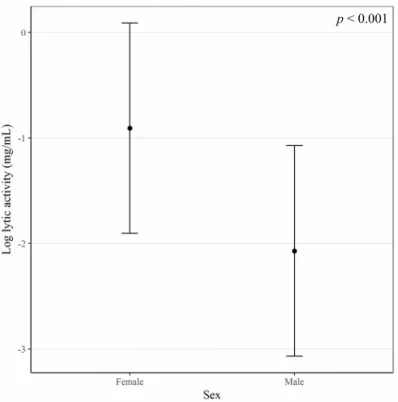
The used model showed an overall significant effect (F(2,47) = 15.06, p < 0.001) (Sup. table 6.1). Anal
exudate's lytic activity was significantly affected by the sex of each individual (female – male, t(50) = –
4.18, p < 0.001) (Fig. 3.1), with females having a higher value than males (Female = – 0.90 ± 1 log(mg.mL-1) and Male = – 2.07 ± 1 log(mg.mL-1)). In addition maternal anal exudate’s lytic activity
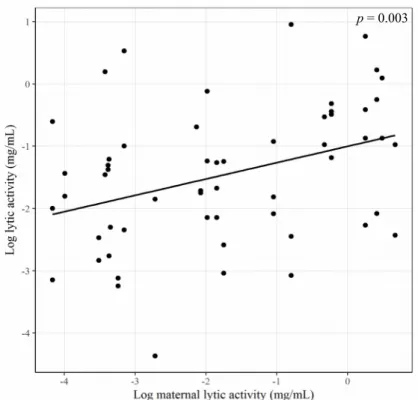
had a significantly positive effect on the F1 lytic activity (t(50) = 3.15, p < 0.01) (Fig. 3.2).
Figure 3.1: Mean lytic activity of anal exudates (logaritmic scale of mg/mL) in relation to gender. Error bars represent standard deviation.
3.1.2. Larval density
Larval density was not significantly correlated with the maternal anal exudate’s lytic activity. The used model accounted for only 6.1% of observed variance (R2 = 0.061 and adjusted R2 = 0.041) (Sup. table
6.2) and did not have a significant overall effect in larval density (F(1,48) = 3.10, p < 0.1). As the only
variable in the used model was F1 anal exudate’s lytic activity had only a marginally significant positive effect (t(50) = 1.76, p < 0.1) (Fig. 3.3).
9
Figure 3.2: Lytic activity of anal exudates (logarithmic scale of mg/mL) plotted against maternal lytic activity of anal exudates.
3.1.3. Pronotum width
The used model had a significant overall effect (F(6,43) = 4.02, p < 0.01) (Sup. table 6.3). Maternal
pronotum width had a significant negative effect on F1 pronotum width (t(50) = - 2.32, p < 0.05) (Fig
3.4) as did the interaction between maternal and foster anal exudate's lytic activity (t(50) = - 2.75, p <
0.01) (Fig 3.5).
Figure 3.3 F2 Larval density (larva/gram of mouse carcass) plotted against F1 lytic activity of anal exudates (logarithmic scale of mg/mL).
11
Figure 3.4: F1 pronotum width (in millimeters) plotted against biological mother pronotum width (mm).
Figure 3.5: F1 pronotum width (in millimeters) plotted against both biological mother category (High or Low) and foster mother category (High - H - circles or Low - L - triangles). Error bars represent standard
deviation. p = 0.025
3.2. Influence of parental care
3.2.1. Survival to treatment
The percentage of surviving larvae did not significantly differ between treatments in block A (Fig. 3.6) but did so in block B (Full care – Pre care: t(50) = -3.71, p < 0.001 and Full care – No care: t(50) = -2.19,
p < 0.05) with FC > PC > NC (mean ± sd: 69% ± 32, 45% ± 39 and 24% ± 29, respectively)(Fig. 3.7).
In block A there was a non-significant negative effect of paternal lytic activity on survival in the FC treatment (t(31) = -1.96, p < 0.10) and a significant difference from the PC treatment (Treatment[PC] *
Paternal lytic activity: t(31) = 2.88, p < 0.01) (Fig. 3.8) while in block B there was a non-significant
positive effect of paternal lytic activity (t(50) = 1.91, p < 0.10) and, in addition to the contradiction
relative to block A in paternal effects, the interaction between the PC Treatment and Paternal lytic activity also showed an opposite effect with a significant negative effect (Treatment[PC] * Paternal lytic activity: t(50) = -2.81, p < 0.01)(Fig. 3.9). The number of transferred larvae also had a positive
effect on survival in block A (t(31) = 2.90, p < 0.01)(Fig. 3.10). In block B only maternal lytic activity
had a significant effect (t(50) = 2.49, p < 0.05)(Fig. 3.11).
Figure 3.6: Block A brood survival (as a percentage of the total transferred larvae) plotted against treatment (FC - Full care and PC –
Pre-hatching care). Error bars represent standard deviation. p = 0.457
13
Figure 3.8: Block A brood survival (as a percentage of the total transferred larvae) plotted against paternal lytic activity of anal exudates
(logarithmic scale of mg/ml). Trend lines represent an approximation for each treatment (FC - Full care and PC – Pre-hatching care). Figure 3.7: Block B brood survival (as a percentage of the total transferred larvae) plotted against treatment (FC - Full care, PC –
Pre-hatching care and NC - No care). Error bars represent standard deviation.
FC-NC: p = 0.034 FC-PC: p = 0.001
p = 0.060
Figure 3.9: Block B brood survival (as a percentage of the total transferred larvae) plotted against paternal lytic activity of anal exudates
(logarithmic scale of mg/ml). Trend lines represent an approximation for each treatment (FC - Full care, PC – Pre-hatching care and NC - No
care).
Figure 3.10: Block A brood survival (as a percentage of the total transferred larvae) plotted against the number of transferred larvae.
p = 0.063
FC-NC: p = 0.540 FC-PC: p = 0.007
3.2.2. Larval density
Both blocks showed a significant negative effect of carcass mass with heavier carcasses leading to a lower value of larval density (t(217) = -6.04, p < 0.001 for block A and t(121) = -5.88, p < 0.001 for block
B) (Fig. 3.12 and Fig. 3.13). In block A a higher survival of the F1 larvae led to a lower larval density when these larvae reproduced as adults (t(217) = -2.30, p < 0.05) in the FC treatment with the PC
treatment having a significantly different effect (Treatment[PC] * Survival: t(217) = 2.80, p < 0.01) (Fig.
3.14). In block B the opposite was found for this relationship only without a significant effect (Fig. 3.15). A similar pattern was found with Treatment variable in which the PC treatment had a lower larval density than FC in block A (t(217) = -2.28, p < 0.05) (Fig. 3.16) but had a higher one in block B
(t(121) = 3.32, p < 0.01) (Fig. 3.17). NC also had a higher larval density than FC but in a non-significant
way (block B). Maternal lytic activity showed a significantly negative effect on larval density only in block A (t(217) = -2.43, p < 0.05)(Fig. 3.18) and a non-significant positive effect in block B (t(121) = 1.06,
p > 0.25) with a significant negative effect only in the NC treatment (Block B, Treatment[NC] *
Maternal lytic activity: t(121) = -3.45, p < 0.001) (Fig. 3.19).
Paternal lytic activity had a negative effect on larval density in block B (t(121) = -3.51, p <
0.001) (Fig. 3.20) with the PC and NC treatments significantly different from FC but with similar values (t(121) = 3.11, p < 0.01 and t(121) = 3.38, p < 0.01, respectively). Anal exudate's lytic activity had
a positive significant effect on larval density only in block A (t(217) = 3.73, p < 0.001) (Fig. 3.21).
15
Figure 3.11: Block B brood survival (as a percentage of the total transferred larvae) plotted against maternal lytic activity of anal exudates
(logarithmic scale of mg/ml). Trend lines represent an approximation for each treatment (FC - Full care, PC – Pre-hatching care and NC - No
care).
Figure 3.12: Block A larval density (larva/gram of mouse carcass) plotted against mouse carcass weight (in grams).
Figure 3.13: Block B larval density (larva/gram of mouse carcass) plotted against mouse carcass weight (in grams).
p < 0.001
17
Figure 3.14: Block A F2 larval density (larva/gram of mouse carcass) plotted against F1 brood survival (as a percentage of the total transferred
larvae). Trend lines represent an approximation for each treatment (FC -Full care and PC – Pre-hatching care).
Figure 3.15: Block B F2 larval density (larva/gram of mouse carcass) plotted against F1 brood survival (as a percentage of the total transferred
larvae). Trend lines represent an approximation for each treatment (FC -Full care, PC – Pre-hatching care nad NC – No care).
p = 0.022
FC – PC: p = 0.006
p = 0.050
FC – NC: p = 0.633 FC – PC: p = 0.063
Figure 3.16: Block A larval density (larva/gram of mouse carcass) plotted against treatment (FC - Full care and PC – Pre-hatching care). Error
bars represent standard deviation.
Figure 3.17: Block B larval density (larva/gram of mouse carcass) plotted against treatment (FC - Full care, PC – Pre-hatching care and NC – No
care). Error bars represent standard deviation.
p = 0.024
FC – NC: p = 0.341 FC – PC: p = 0.002
19
Figure 3.18: Block A larval density (larva/gram of mouse carcass) plotted against maternal lytic activity of anal exudates (logarithmic scale of mg/mL). Trend lines represent an approximation for each treatment (FC
-Full care and PC – Pre-hatching care).
Figure 3.19: Block B larval density (larva/gram of mouse carcass) plotted against maternal lytic activity of anal exudates (logarithmic scale of mg/mL). Trend lines represent an approximation for each treatment (FC
-Full care, PC – Pre-hatching care and NC – No care). p = 0.016
FC – PC: p = 0.074
p = 0.291
FC – NC: p = 0.001 FC – PC: p = 0.906
Figure 3.20: Block B larval density (larva/gram of mouse carcass) plotted against paternal lytic activity of anal exudates (logarithmic scale of mg/mL). Trend lines represent an approximation for each treatment (FC
-Full care, PC – Pre-hatching care and NC – No care).
Figure 3.21: Block A larval density (larva/gram of mouse carcass) plotted against F1 lytic activity of anal exudates (logarithmic scale of mg/mL). Trend lines represent an approximation for each treatment (FC - Full care
and PC – Pre-hatching care). p = 0.001
FC – NC: p = 0.001 FC – PC: p = 0.002
3.2.3. Investment in social immunity
Blocks A and B show contradictory results to the treatment variable: in block A the is no difference between FC and PC (Fig. 3.22) while in block B there are significant differences from FC in both PC (Full Care – Pre-hatching Care: t(159) = 2.92, p < 0.01) and NC (Full Care – No Care: t(159) = 3.93, p <
0.001)(Fig. 3.23). The FC treatment had a lower mean value of F1 lytic activity than the NC which had a lower value than the PC treatment (mean ± sd: -0.98 ± 0.93 log(mg.mL-1), -0.67 ± 1.05
log(mg.mL-1), -0.36 ± 0.82 log(mg.mL-1), respectively) (Fig. 3.23).
The previously described difference between sexes is shown only in block A, with females investing more in this trait than males (Block A: female – male: t(217) = -3.18, p < 0.01) (Fig. 3.24 and
Fig. 3.25). In block B the effect of sex was only significant when interacting with the NC treatment (Block B: Treatment[NC] * Sex[Male]: t(159) = -2.31, p < 0.05). F1 larval survival had significant a
negative effect in block A(t(217) = -2.52, p < 0.05)(Fig. 3.26) and only a significant interaction with the
NC treatment in block B (Block B: Treatment[NC] * Survival: t(159) = -2.78, p < 0.01).
Paternal lytic activity (in block B) had a significant negative effect (t(159) = -3.18, p < 0.01) and
significant interactions with both the NC and PC (Treatment[NC] * Paternal lytic activity: t(159) = 3.98,
p < 0.001 and Treatment[PC] * Paternal lytic activity: t(159) = 3.84, p < 0.001) (Fig. 3.27).
21
Figure 3.22: Block A mean F1 lytic activity of anal exudates (logarithmic scale of mg/mL) in relation to treatment (FC - Full care and PC –
Pre-hatching care). Error bars represent standard deviation. p = N.S.
Figure 3.23: Block B mean F1 lytic activity of anal exudates (logarithmic scale of mg/mL) in relation to treatment (FC - Full care, PC –
Pre-hatching care and NC – No care). Error bars represent standard deviation.
Figure 3.24: Block A mean F1 lytic activity of anal exudates (logarithmic scale of mg/mL) in relation to gender. Error bars represent standard
deviation.
FC – NC: p < 0.001 FC – PC: p = 0.004
23
Figure 3.25: Block B mean F1 lytic activity of anal exudates (logarithmic scale of mg/mL) in relation to gender. Error bars represent standard
deviation.
Figure 3.26: Block A F1 lytic activity of anal exudates (logarithmic scale of mg/mL) plotted against brood survival (as a percentage of the total
transferred larvae).
p = 0.149
3.2.4. Average larval mass
Both blocks show a negative effect of larval density on average larval mass in the FC treatment as one would expect (Block A: t(203) = -11.28, p < 0.001 and Block B: t(117) = -7.95, p < 0.001)(Fig. 3.28 and
Fig. 3.29). However, there were also significant positive effects on the interaction between Treatment and Larval density meaning there is a less negative relationship between Larval density and Average larval mass in the PC (Treatment[PC] * Density (block A): t(203) = 2.53, p < 0.05 and Treatment[PC] *
Density (block B): t(117) = 2.48, p < 0.05) and NC treatments (Treatment[NC] * Density: t(117) = 2.04, p
< 0.05).
Maternal lytic activity had a significant negative effect in both blocks (Block A: t(203) = -2.67,
p < 0.01 and Block B: t(117) = -2.44, p < 0.05)(Fig. 3.30 and Fig. 3.31) with a positive interaction with
the PC treatment in block B (Treatment[PC] * Maternal lytic activity: t(117) = 2.46, p < 0.05).
The PC treatment had a significantly lower Average larval mass than the FC treatment but only in block A (Full Care – Pre-hatching Care: t(203) = -3.32, p < 0.01). Larvae survival to treatment
had a negative effect on this variable in block A (t(203) = -2.01, p < 0.05) but not in block B (t(117) =
1.36, p < 0.2)(Fig. 3.32 and Fig. 3.33). Carcass mass had a positive significant effect only in block A (t(203) = 4.37, p < 0.001)(Fig. 3.34).
Figure 3.27: Block B F1 lytic activity of anal exudates (logarithmic scale of mg/mL) plotted against paternal lytic activity of anal exudates (logarithmic scale of mg/mL). Trend lines represent an approximation for
each treatment (FC - Full care, PC – Pre-hatching care and NC - No care).
p = 0.002
FC – NC: p < 0.001 FC – PC: p < 0.001
25
Figure 3.28: Block A average larval mass (in grams) in relation to larval density (larvae per gram of mouse carcass). Trend lines represent an approximation for each treatment (FC - Full care and PC – Pre-hatching
care).
Figure 3.29: Block B average larval mass (in grams) in relation to larval density (larvae per gram of mouse carcass). Trend lines represent an approximation for each treatment (FC - Full care, PC – Pre-hatching care
and NC – No care). p < 0.001 FC – PC: p = 0.012 p < 0.001 FC – NC: p = 0.044 FC – PC: p = 0.015
Figure 3.30: Block A average larval mass (in grams) in relation to maternal lytic activity of anal exudates (logarithmic scale of mg/mL). Trend lines represent an approximation for each treatment (FC - Full care
and PC – Pre-hatching care).
Figure 3.31: Block B average larval mass (in grams) in relation to maternal lytic activity of anal exudates (logarithmic scale of mg/mL). Trend lines represent an approximation for each treatment (FC - Full
care, PC – Pre-hatching care and NC – No care). p = 0.008
FC – PC: p = 0.012
p = 0.017
FC – NC: p = 0.119 FC – PC: p = 0.016
27
Figure 3.32: Block A average larval mass (in grams) in relation to brood survival (as a percentage of the total transferred larvae).
Figure 3.33: Block B average larval mass (in grams) in relation to brood survival (as a percentage of the total transferred larvae).
p = 0.046
3.2.5. Pronotum width
Using only Full Care data to investigate the natural relationship between larval weight at dispersal and adult pronotum width. The used model included 2 variables and had a very significant overall effect (F(2,144) = 295.1, p < 0.001)(Sup. table 6.12), accounting for 80.4% of the observed variance (R2 =
0.804 and adjusted R2 = 0.801). Larval mass at dispersal had a positive significant effect on adult
pronotum width (t(147) = 24.29, p < 0.001), as would be expected (Fig. 3.35). Males were marginally
bigger than females (female – male, t(147) = 1.84, p < 0.1)(Fig. 3.36).
Figure 3.34: Block A average larval mass (in grams) in relation to mouse carcass weight (in grams). Trend lines represent an approximation for
each treatment (FC - Full care and PC – Pre-hatching care). p < 0.001
29
Figure 3.35: Pronotum width (in millimeters) plotted against larval mass at dispersal (grams). Both data points correspond to the same individual.
Figure 3.36: Mean Pronotum width (in millimeters) in relation to gender. Error bars represent standard deviation.
p < 0.001
3.3. Adaptation
3.3.1. Investment in social immunity
Three variables were considered in the used model, which had a significant effect (F(4,492) = 35.2, p <
0.001) and accounted for approximately 22.3% of the variance observed (R2 = 0.223 and adjusted R2 =
0.216)(Sup. table 6.13). Investment in social immunity increased significantly throughout the five tested generations (t(497) = 6.51, p < 0.001)(Fig. 3.37). Anal exudate's lytic activity was marginally
significantly affected by sex (female – male, t(497) = -1.92, p < 0.1), although this difference decreased
after the five recorded generations in the laboratory in which the lytic activity values of males increased faster than females' across generations (Sex[Male] * Generation: t(497) = 1.79, p < 0.1)(Fig.
3.38). A positive effect of carcass mass was also found (t(497) = 5.59, p < 0.001)(Fig. 3.39).
Figure 3.37: Lytic activity of anal exudates (logarithmic scale of mg/mL) in relation to generation in the laboratory (experiments started on gen
57).
31
Figure 3.38: Lytic activity of anal exudates (logarithmic scale of mg/mL) in relation to generation in the laboratory (experiments started on gen
57). Trend lines represent an approximation for each gender.
Figure 3.39: Lytic activity of anal exudates (logarithmic scale of mg/mL) in relation to mouse carcass weight (in grams). This plot was made using
the data from all generations.
F – M: p = 0.056 S(M)*G: p = 0.074
3.3.2. Larval density
The used model used 2 variables and accounts for only 15.3% of observed variance (R2 = 0.153 and
adjusted R2 = 0.150) but had a significant overall effect (F
(2,497) = 44.74, p < 0.001)(Sup. table 6.14).
There was a negative significant effect of carcass mass (t(497) = -9.38, p < 0.001)(Fig. 3.40). Generation
also had a negative significant effect (t(497) = -5.47, p < 0.001)(Fig. 3.41).
Figure 3.40: Larval density (larva/gram of mouse carcass) in relation to mouse carcass weight (in grams). This plot was made using the data from
all generations.
3.3.3. Average larval mass
Average larval mass increased non significantly throughout the generations (t(408) = 1.77, p < 0.1)(Fig.
3.42)(Sup. table 6.15). Larval density appears to negatively affect the average larval mass (t(408) =
-19.9, p < 0.001)(Fig. 3.43) contrary to carcass mass in which heavier carcasses led to larger larvae (t(408) = 5.91, p < 0.001)(Fig. 3.44).
33
Figure 3.41: Larval density (larva/gram of mouse carcass) in relation to generation in the laboratory (experiments started on gen 57).
Figure 3.42: Average larval mass (in grams) in relation to generation in the laboratory (experiments started on gen 57).
Figure 3.43: Average larval mass (in grams) in relation to larval density (larva/gram of mouse carcass). This plot was made using the data from
all generations.
p = 0.078
35
Figure 3.44: Average larval mass (in grams) in relation to mouse carcass weight (in grams). This plot was made using the data from all
generations.
4. DISCUSSION
Social immunity is a specific type of immunity that is not individual specific, but focuses the community (Cremer et al. 2007). This type of immunity is very common in social insects and it can present itself in several ways, and be behavioural, physiological or organisational. When individuals face a new environment they adapt to it in order to survive, this adaptation is also seen when individuals are taken into captivity (Frankham, 2008, Christie et al., 2012). Captive related adaptation is also expected to be seen in social immunity. If these adaptations are passed to the offspring the first step towards evolution is taken. The existence of these micro evolutionary events in stock populations is of extreme importance when developing research projects and interpreting data.
In this dissertation I investigated which factors influence investment in social immunity and whether small scale evolution is affecting burying beetle’s populations in their laboratory environment. The burying beetle was selected as a study subject due to their rare parental behaviour associated with social immunity and due to its existence in maintenance stock at the Kilner Group laboratory (Evolutionary Biology, Cambridge University) for 55 generations. I found that the individual’s genetics plays an important role on the strength of the social immunity, and that maternal investment in social immunity has a positive relationship with this same investment in the following generation (Fig. 3.2). I show as well that there is an effect of the early environment on the development of social immunity (Fig. 3.22 and Fig. 3.23), with individuals that are more cared for being larger and having higher changes of survival (Fig. 3.6 and Fig. 3.7). In addition, I show that the traits observed appear to be transmitted from parents to offspring and that a linear trend (positive or negative depending on the trait) can be observed through the studied generations (Fig. 3.37, Fig. 3.41 and Fig. 3.42).
4.1. Cross-fostering
Bateman’s principle says that the female investment into their offspring is higher than the male’s. This is related to the fact that males spend less energy on gamete production and have the potential to mate with several females. This phenomenon was observed in my thesis, where the lytic activity of anal exudates of females was higher than in males (Fig. 3.1). This variation in activity between sexes is in agreement with previous studies (Scott & Traniello, 1990; Eggert & Muller, 1997; Cotter & Kilner, 2010). Although not frequent in laboratory due to captive conditions, fostering is common in burying beetles in the wild (Eggert & Muller, 1997). This study shows that investment in social immunity observed in the F1 generation, once they reach adulthood, depends on the biological mother's investment, suggesting that genetic factors and/or maternal effects might come into play and outweigh the environmental ones. The experiments performed were not designed to distinguish between genetic influences and maternal effects so further studies are necessary to better understand this trait and how it is passed on from one generation to the next.
A positive relationship was found between the intensity of the F1 female investment in social immunity and the density of larvae in the F2 generation(Fig. 3.3). The increased maternal investment may allow for higher densities of the offspring due to the higher potential to defend against pathogens. Smaller mothers lead to a smaller pronotum width in the F1 individuals (Fig. 3.4), which may be related to a lower fitness from smaller beetles.
4.2. Influence of parental care
Larval survivability was as expected dependent on how much parental care they received with larvae with carcass preparation and direct parental care having the highest values, followed by larvae with only a prepared carcass, followed by larvae with no care at all (although one of the blocks did not have significant results, when looking at means they show the same pattern – Fig. 3.6 and Fig. 3.7). These show that both direct and indirect parental care has an important role in providing the larvae with enough nutrition and/or protection to reach the pupal stage. At the same time these results also show that larvae without these have the ability to reach pupal and adult stages (for example when one or both parents decide to abandon the clutch, Ward et al., 2009).
Larval density declined with the size of the carcass prepared by the parents (Fig. 3.12, 3.13). This can be associated with the fact that there is a natural limit to the amount of offspring produced . It might also be attributed to culling which enables parents to invest more in fewer offspring, effectively favouring offspring size over offspring number. Culling is well known in burying beetles. Parents can kill up to half of the larvae to allow the remaining larvae to grow with more resources (Bartlett, 1988). This might also explain why in block B the partial care and the no care treatments had higher densities of larvae than the full care one (Fig. 3.17 and Sup. Table 6.7). In block A, on the other hand, the full care treatment had higher densities than the partial care one (Fig. 3.16). This can be related to the fact that, as mentioned above, fewer larvae died in the full care treatment, or, as discussed below, to reproductive adaptation. Higher parental lytic activity was generally associated with lower larval densities (Fig. 3.18 – 3.21). This result is discussed in Duarte et al. (2016) where it was found that higher investments in social immunity by mothers in lower density clutches is not due to a trade off between direct and indirect parental care but due to the existence of a public goods game. As such, parents exchange social cues with their larvae to choose the amount to invest: a larger clutch can provide a larger amount of exudate so parents lower their contribution; a smaller clutch has less larvae to contribute so parents have to invest more.
The investment in social immunity of the F1 generation appears to be dependent on the type of care they received as larvae. Larvae that belonged to the FC treatment tended to invest less than larvae that were not cared for as much (Fig. 3.22, 3.23). Taking into consideration that there is a limit of energy available and that not all traits can be optimized, a trade-off is expected to be found. Individuals that were raised by active care (e.g. mouth fed) will invest more on that behaviour, and so the indirect care (e.g. lytic activity) will be expected to be less developed. Block A F1 females tended to invest more in social immunity than males, but not in block B (Fig. 3.24, 3.25). As discussed before the observations in block A are supported by Bateman’s principle. The loss of this divergence in block B though could be explained by the fact that in captivity males are not allowed to mate with different females and so will invest more in the only offspring they have.
A relationship between the number of offspring and their individual mass is known in several systems (Sinervo & Licht, 1991; Jonsson & Jonsson, 1999; Hendry et al., 2001). This relation was also found here, where higher densities lead to lower body masses (Fig. 3.28, 3.29), and higher masses being associated with wider pronotum (larger body sizes) (Fig. 3.35). A negative trend was found between female lytic activity and F1 mass (Fig. 3.30, 3.31). As discussed above this might be due to a trade off between direct and indirect care. Additionally it was found that larvae raised in bigger carcasses were heavier than larvae raised in smaller carcasses (Fig. 3.34) which can be easily related to food availability.