Equity Valuation – OdontoPrev
How much is a smile worth?
Master Thesis – Católica Lisbon
October 2015
Dissertation Supervisor: Professor José Carlos Tudela Martins
Pedro Oliveira
Nº 152113030
1
Equity Valuation – OdontoPrev “ODPV3”
19th of October 2015
Conservative Scenario: Macroeconomic Slowdown
OdontoPrev’s valuation exercise contemplates the current negative macroeconomic scenario of Brazil. As a result, the future growth assumptions are fairly conservative (i.e. sales are projected to deliver growth slightly above inflation levels). The company has improved its operational efficiency, showing a lower dental loss ratio in the last periods and has also implemented new and more reliable distribution channels with lower commission costs, therefore overcoming the challenges presented by the unfavorable circumstances of the Brazilian economy.
Smile, There is Further Possibility for Growth
After delivering growth based on the expansion of corporate members, the company has now changed its focus to SME’s and individual contracts, which represent today less than 20% of the total portfolio. These segments are considered crucial for the company revenues’ expansion, allowing higher margins than the corporate segment. For that, the associations with Bradesco and Banco do Brasil and the new distribution channels of the company arise as a key factor to succeed in this operation. None of OdontoPrev’s competitors have anything close to what Bradesco and Banco do Brasil have to offer, so the market leader should remain with the brightest smile.
OdontoPrev’s Financial Indicators Forecast
ODPV3 HOLD
Last Price (28/08/2015) R$ 9.8 Target-Price (31/12/2015) R$ 10.5 Upside Potential 6.7% Equity Value (R$ million) 5,201 1 Month Change (7.2%) 52w Low R$ 8.6 52w High R$ 11.4
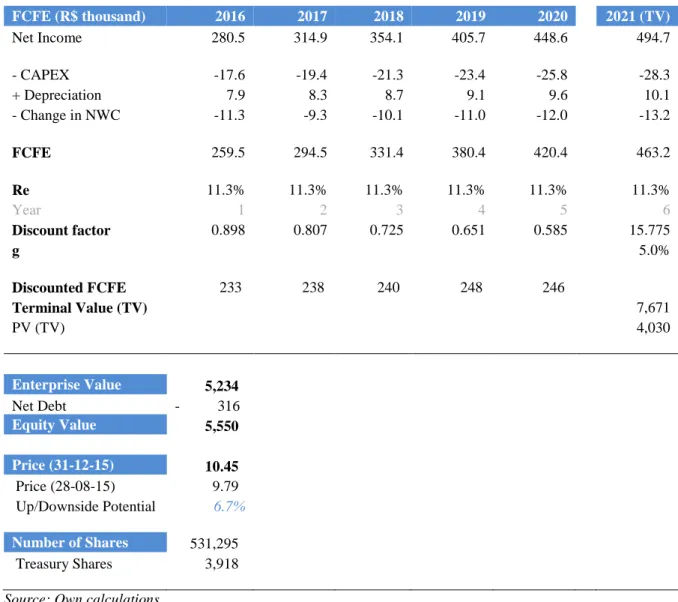
Valuation R$ Million
Enterprise Value 2015E 5,234
Net Debt 2015E (316)
Equity Value 2015E 5,550 Shares (million) 531
Cost of Equity (Re) 11.3% Growth Rate (g) 5%
Multiples 2015
PER 24x
PBR 8x
OdontoPrev Key Indicators 2014 2015 2016 2017 2018 2019 2020 2021
Average Members (thousand) 6,244 6,488 6,754 7,121 7,508 7,917 8,347 8,801 Average Ticket (R$/Live/Month) 15.43 16.64 17.44 18.20 18.95 19.73 20.52 21.35
NOR (R$ million) 1,156 1,258 1,414 1,555 1,707 1,874 2,056 2,255
NOR Growth 9% 12% 10% 10% 10% 10% 10%
EBIT (R$ million) 60 273 325 389 433 482 544 602
Net Income (R$ million) 195 235 281 315 354 406 449 495
Net Debt (R$ million) -316
PER 24 PBV 9 60% 70% 80% 90% 100% 110% 120% 130% 140% 150% 160% OdontoPrev Ibovespa
i.
Abstract
Title:OdontoPrev – Equity Valuation
Author: Pedro Oliveira
The aim of this master thesis is to calculate the most accurate price per share of OdontoPrev (ODPV3) on the 31st of December 2015. To perform that, a review of the related literature is
carried out to realize that the Discounted Cash Flow valuation model, using the Cost of Equity as a discount rate, is the most suitable method to value the company.
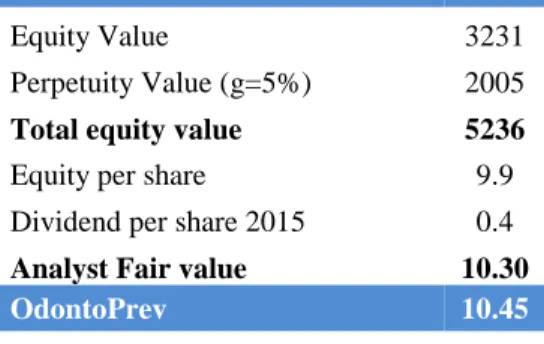
After discounting the free cash flows to equity, the result is a market capitalization of R$ 5,550 million, correspondent to a price per share of R$ 10.45. Besides that, the relative valuation (multiples) approach is also used to confirm the accuracy of the price per share under the discounted cash flow valuation, which displays an upside potential of 6.7% when compared with the share traded on the 28th of August 2015 – R$ 9.79.
This makes it believable that OdontoPrev is being slightly undervalued by the market, making it a good opportunity to hold the investment. A “Hold” recommendation is the result of the assumptions on the future growth prospects of the company, taking into consideration that macroeconomic events occurring in emerging markets (i.e. Brazil) may have significant impact on the valuation.
ii.
Acknowedgments
This valuation exercise proved to be a perfect tool to strengthen my finance knowledge, in particular in the field of stock market and equities, while encouraging me to pursue a career in this area.
Firstly, I would like to thank Professor José Carlos Tudela Martins for the constant availability, guidance and help.
Secondly, I am grateful to OdontoPrev’s Investor Relations department for all the support along this period, with a special thanks to José Roberto Pacheco, Roberta Carneiro and Dárcio Nunciatelli.
Finally, this master thesis is dedicated to all my beloved family, friends and girlfriend, who were always very supportive and have inspired me during the last months.
List of Contents
EQUITY VALUATION – ODONTOPREV “ODPV3” ... 1
I. ABSTRACT... 2 II. ACKNOWLEDGMENTS ... 3 III. INTRODUCTION ... 6 1 LITERATURE REVIEW ... 7 1.1 VALUATION IMPORTANCE ... 7 1.2 VALUATION STEPS ... 9 1.3 VALUATION METHODS ... 10
1.3.1 DISCOUNTED CASH FLOW APPROACH (“DCF”) ... 11
1.3.1.1 DIVIDEND DISCOUNT MODEL (“DDM”) ... 12
1.3.1.2 FREE CASH FLOW TO EQUITY (“FCFE”) ... 13
1.3.1.3 FREE CASH FLOW TO FIRM (“FCFF”) ... 14
1.3.2 RELATIVE VALUATION ... 15
1.4 EXPLANATION OF THE MODEL’S VARIABLES ... 17
1.4.1 CAPITAL ASSET PRICING MODEL (“CAPM”) ... 17
1.4.2 RISK FREE ... 18
1.4.3 EQUITY RISK PREMIUM ... 18
1.4.4 COUNTRY RISK PREMIUM ... 18
1.4.5 BETA ... 19
1.4.6 COST OF EQUITY ... 19
1.4.7 COST OF DEBT ... 20
1.4.8 WEIGHTED AVERAGE COST OF CAPITAL ... 20
1.4.9 TERMINAL VALUE ... 21
1.4.10 GROWTH RATE... 21
1.4.11 INFLATION ... 22
INFLATION DIFFERENTIAL ... 22
1.5 VALUATION IN EMERGING MARKETS ... 23
2 MARKET AND COMPANY OVERVIEW ... 24
2.1 MARKET OVERVIEW ... 24
2.2 RISK FACTORS ... 26
2.3 COMPANY BACKGROUND ... 27
2.4 COMPANY ANALYSIS ... 29
2.5 COMPANY’S STOCK PERFORMANCE ... 30
2.6 COMPANY STRATEGY ... 31 2.7 COMPETITIVE ADVANTAGES... 32 2.8 COMPETITOR ANALYSIS ... 33 3 VALUATION ... 34 3.1 NET OPERATING REVENUE... 35 3.2 COST OF SERVICES ... 37 3.3 SELLING EXPENSES ... 39 3.4 OTHER ITEMS ... 40
OTHER OPERATING EXPENSES ... 40
NET FINANCIAL INCOME ... 40
CURRENT AND DEFERRED TAX ... 41
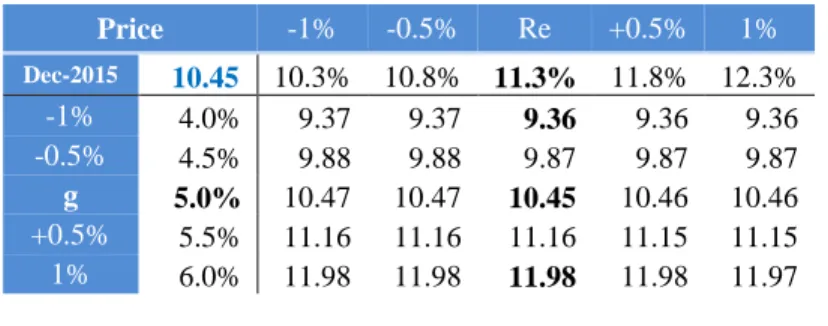
CASH... 41 3.5 EQUITY IN SUBSIDIARIES ... 42 3.6 CAPEX ... 43 3.7 DEPRECIATION ... 43 3.8 NET WORKING CAPITAL ... 44 3.9 DCFVALUATION ... 45 3.10 SENSITIVITY ANALYSIS ... 47 3.11 RELATIVE VALUATION... 48
4. INVESTMENT BANK REPORT COMPARISON ... 50
5. CONCLUSION AND LIMITATIONS ... 52
APPENDIX 1–ADDITIONAL LITERATURE REVIEW... 53
1.4.8.1 RESIDUAL INCOME VALUATION ... 53
1.4.9 CONTINGENT CLAIM VALUATION ... 54
1.4.10 LIQUIDATION AND ACCOUNTING VALUATION ... 54
APPENDIX 2 ... 55 APPENDIX 3 ... 55 APPENDIX 4 ... 56 APPENDIX 5 ... 56 APPENDIX 6 ... 57 APPENDIX 7 ... 57 APPENDIX 9 ... 58 APPENDIX 10 ... 59 APPENDIX 11 ... 59 APPENDIX 12 ... 60 APPENDIX 13 ... 60 APPENDIX 14 ... 61 REFERENCES ... 62
iii. Introduction
Valuation is the practice of measuring the value of an asset, being critical in investments and portfolio management. To outperform in equity markets, one should buy undervalued stocks and sell overvalued stocks, by supporting his decision on accurate estimates of its fair value. Therefore, a recommendation for the investment plan, proposing a buy, hold or sell strategy is given.
Accordingly, the aim of this master thesis is to calculate the value per share of OdontoPrev (ODPV3), on the 31st of December 2015. There is no consensus on what is the best valuation model to value the company chosen, as so, the relevant literature is initially discussed by examining different author’s approaches, presented in several articles, books and journals.
There is also the need to realize what are the characteristics of the environment in which OdontoPrev operates. The company is the market leader in the dental care sector, however, the impact of factors such as the uncertainty surrounding insurance firms, regulatory settings of the sector and fierce competition has to be measured, being fundamental for the performance within the industry.
Under the DCF model – using the FCFE approach (discounted at the cost of equity) – and the multiples approach to value OdontoPrev, the outcome is a stock price believed to reflect the expectations about the future performance of the company. Moreover, a sensitivity analysis to find plausible alternative values for the price, under different scenarios, is performed.
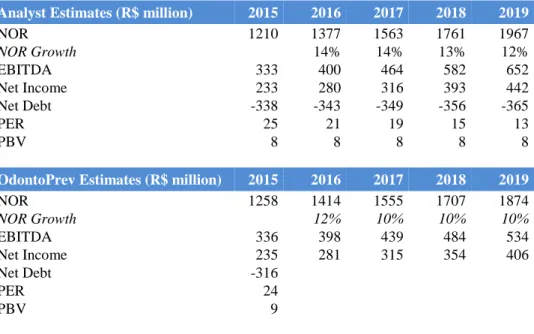
The last step of this master thesis is a comparison between the DCF valuation done with one performed by an investment bank, Itaú BBA, where the assumptions and results are discussed.
1
Literature Review
1.1 Valuation Importance
Valuation is one of the most essential skills in Finance ever since it can reveal opportunities of investment or divestment in the entire spectrum of publicly traded companies. If one reach to a reasonable value for a company, then can take correct decisions regarding investment: According to (Buffet, 1989), “It’s far better to buy a wonderful company at a fair price than a fair company at a wonderful price”. Thus, the more accurate valuation one performs, more profitable one will be because is aware of the fair price per share.
The valuation of an asset essentially consists in predicting the future returns that a company can deliver and consequently discount the estimated future cash flows for today, using the correct discount rate. According to (Damodaran, 2002), “some assets are easier to value than others, the details of valuation vary from asset to asset, and the uncertainty associated with value estimates is different for different assets, but the core principles remain the same”. Valuation is the assessment of the asset’s value based either on variables related to future returns or through direct comparisons with similar assets. According to (Stowe et al., 2007), “this process includes understanding the company to be valued, forecasting the company’s performance, and selecting the appropriate valuation model for a given valuation task”. Valuation is not an exact exercise, subject to the assumptions and biases of each analyst, who figures a way to calculate the value of an asset. It plays an important role in many financial operations, such as mergers and acquisitions (M&A), portfolio management and corporate finance.
According to (Stowe et al., 2007), valuation techniques can be applied in several circumstances and its main purposes are the following:
Stock - picking. To realize which stocks are undervalued and overvalued, guiding the investor to purchase, hold, or sale the stock;
Understanding the market. The current share prices in the market are a result of investors’ expectations about the performance of variables influencing the price of the stock (e.g., earnings growth and expected return). Analysts can estimate these expectations by comparing market prices with a stock’s intrinsic value;
Estimating the value of corporate events. Market professionals use valuation techniques to analyze proposed corporate mergers & acquisitions (M&A), management buyouts (MBOs) and financial restructuring;
Corporate governance planning. Evaluate the effects of proposed corporate strategies on the firm’s stock price;
Communication. Valuation provides a discussion between company, analysts and investors to evaluate the company’s performance and future policies;
Valuation of private owned businesses. To determine the value of firms that are not publicly traded, investors typically rely on valuations made by investment banks, which were the ones with the access to information and mandated for that purpose; Portfolio management. Equity valuation is the starting point for the construction of a
portfolio of stocks, being a more powerful tool when used in a group context because mitigates the diversifiable risk of the market;
As described above, there are several purposes for valuing a company, however, this thesis will be focused on the first one (stock - selection), aiming to reach the price per share of the company and ultimately give the recommendation for the purchase, hold or sale of the stock.
1.2 Valuation Steps
Valuation is perceived as a complex process with several stages that should be followed in a particular way. According to (Stowe et al., 2007), “each individual valuation that an analyst undertakes can be viewed as a process with the following five steps”:
“Understanding the business”. Industry and company overview, by examining firm strategies and the financial statements;
“Forecasting company performance”. Forecasted revenues and earnings are key to estimate the value of the company;
“Selecting the appropriate valuation model”. Each industry or company type has a specific valuation model that lead to a more accurate valuation, hence an overall analysis should be embraced;
“Converting forecasts to a valuation”;
“Making the investment decision”. After valuing the company, a recommendation should be given – hold, buy or sell the asset;
In the next stage of this literature review, a detailed discussion of the third step (“selecting the appropriate valuation model”) will be addressed, by stressing out the main and current valuation models as well as the elements and formulas supporting them. All the approaches are relative to author’s different points of view. The model that best fits the company will be chosen taking into consideration the industry sector and company structure.
1.3 Valuation Methods
There are numerous ways to value a company but being more specific and following (Damodaran, 2005), “In general terms, there are four approaches to valuation. The first, discounted cash flow valuation, relates the value of an asset to the present value of expected future cash flows on that asset. The second, liquidation and accounting valuation, is built around valuing the existing assets of a firm, with accounting estimates of value or book value often used as a starting point. The third, relative valuation, estimates the value of an asset by looking at the pricing of 'comparable' assets relative to a common variable like earnings, cash flows, book value or sales. The final approach, contingent claim valuation, uses option pricing models to measure the value of assets that share option characteristics”. There is a wide range of methods for valuing an asset, nevertheless, to choose the most relevant for the analysis, one should carefully select, apply and interpret each of them.
1.3.1 Discounted Cash Flow Approach (“DCF”)
Discounted Cash Flow valuation, as implicit in the concept, is based on future cash flows to reach the firm value as of today. For that, future cash flows are discounted for today, using the right cost of capital. According to (Fernandez, 2007), the general formula for discounting cash flows is given by the following equation:
Equation 1 – Discounted Cash Flows
𝑉𝑎𝑙𝑢𝑒 = 𝐶𝐹1 1 + 𝑟+ 𝐶𝐹2 (1 + 𝑟)2+ 𝐶𝐹3 (1 + 𝑟)3… 𝐶𝐹𝑛+ 𝑅𝑉𝑛 (1 + 𝑟)𝑛 Where:
CFi= cash flow generated by the company in the period i
RVn = residual value (terminal value) of the company in the year n
𝑟 = appropriate discount rate
g = constant growth rate after year n
The DCF model can be computed through several ways. Following (Stowe et al., 2007), concerning cash flow, three main approaches are considered:
Dividends (Dividend Discount Model); Free Cash Flow (FCFE and FCFF); Residual Income;
There is a fourth method with respect to DCF, the so called Adjusted Present Value (APV) which is useful to value companies where it is expected its capital structure to alternate. The purpose of APV valuation is to measure apart the effect of debt in the value of the company. In line with (Luehrman, 1997), “APV is exceptionally transparent: you get to see all the components of value in the analysis”. The company being analyzed doesn’t have and doesn´t intend to have debt, so this literature review will not deeply discuss the APV approach.
1.3.1.1 Dividend Discount Model (“DDM”)
Dividend Discount Model is based on expected dividends, which are the expected cash flows to remunerate shareholders. This approach was developed by John Burr Williams in 1938 and assumes that the single cash flow that a shareholder has the right to receive is the dividend paid by the company. The general formula to compute the stock price is given by:
Equation 2 – Value per Share according to DDM
𝑉𝑎𝑙𝑢𝑒 𝑝𝑒𝑟 𝑠ℎ𝑎𝑟𝑒 𝑜𝑓 𝑠𝑡𝑜𝑐𝑘 = ∑ 𝐸(𝐷𝑃𝑆𝑡) (1 + 𝑘𝑒)𝑡 𝑡=∞ 𝑡=1 Where: 𝐸(𝐷𝑃𝑆𝑡) = 𝑒𝑥𝑝𝑒𝑐𝑡𝑒𝑑 𝑑𝑖𝑣𝑖𝑑𝑒𝑛𝑑𝑠 𝑝𝑒𝑟 𝑠ℎ𝑎𝑟𝑒 𝑖𝑛 𝑝𝑒𝑟𝑖𝑜𝑑 𝑡 𝑘𝑒= 𝑅𝑒= 𝑐𝑜𝑠𝑡 𝑜𝑓 𝑒𝑞𝑢𝑖𝑡𝑦
The stock price is the value of the expected future dividends per share, discounted at the cost of equity. In order to forecast future dividends, accurate assumptions should be made for profitability and company’s dividend policy. (Stowe et al., 2007), reasons that “a discounted dividend approach is most suitable for dividend-paying stocks, where the company has a discernible dividend policy that has an understandable relationship to the company´s profitability and the investor has a control (minority ownership) perspective”. This model is only dependent of one variable (expected dividends) and could lead to a gap when the payout policy is under/overestimated, so this thesis will not use the DDM approach. Gordon, in 1963, presented the Gordon Growth Model, which is given by:
Equation 3 – Gordon Growth Model
𝑉𝑎𝑙𝑢𝑒 𝑜𝑓 𝑡ℎ𝑒 𝑆𝑡𝑜𝑐𝑘𝑡 = 𝐸(𝐷𝑃𝑆𝑡+1) 𝑘𝑒 − 𝑔 Where: 𝐸(𝐷𝑃𝑆𝑡+1) = 𝑒𝑥𝑝𝑒𝑐𝑡𝑒𝑑 𝑑𝑖𝑣𝑖𝑑𝑒𝑛𝑑𝑠 𝑖𝑛 𝑡ℎ𝑒 𝑛𝑒𝑥𝑡 𝑝𝑒𝑟𝑖𝑜𝑑 𝑘𝑒= 𝑐𝑜𝑠𝑡 𝑜𝑓 𝑒𝑞𝑢𝑖𝑡𝑦 𝑔 = 𝑒𝑥𝑝𝑒𝑐𝑡𝑒𝑑 𝑔𝑟𝑜𝑤𝑡ℎ 𝑟𝑎𝑡𝑒 𝑖𝑛 𝑝𝑒𝑟𝑝𝑒𝑡𝑢𝑖𝑡𝑦
1.3.1.2 Free Cash Flow to Equity (“FCFE”)
The free cash flow to the equity approach values the part of the company that belongs to shareholders, in the same line as the Dividend Discount Model but with a key adjustment observed by (Damodaran, 2009): “one way to describe a free cash flow to equity model is that it represents a model where we discount potential dividends rather than actual dividends”.
Equation 4 – Equity Value
𝐸𝑞𝑢𝑖𝑡𝑦 𝑉𝑎𝑙𝑢𝑒 = ∑ 𝐹𝐶𝐹𝐸𝑡 (1 + 𝑘𝑒)𝑡 𝑡=∞ 𝑡=1 Where: 𝐹𝐶𝐹𝐸𝑡= 𝑓𝑟𝑒𝑒 𝑐𝑎𝑠ℎ 𝑓𝑙𝑜𝑤 𝑡𝑜 𝑒𝑞𝑢𝑖𝑡𝑦 𝑖𝑛 𝑦𝑒𝑎𝑟 𝑡 𝑘𝑒= 𝑐𝑜𝑠𝑡 𝑜𝑓 𝑒𝑞𝑢𝑖𝑡𝑦
To compute shareholder’s equity, the free cash flow to equity is discounted at the cost of equity (𝑘𝑒), representing the intrinsic risk of dividends. As stated by (Stowe et al., 2007),
“free cash flow to equity is the cash flow available to the company’s common equity holders after all operating expenses, interest, and principal payments have been paid and necessary investments in working and fixed capital have been made”. Essentially, it is the maximum amount of cash that can be paid to the equity shareholders of the company after all expenses, reinvestment needs and debt repayment. The FCFE formula is given by:
Equation 5 – FCFE Calculation
𝐹𝐶𝐹𝐸 = 𝑁𝑒𝑡 𝐼𝑛𝑐𝑜𝑚𝑒 − 𝐶𝑎𝑝𝑖𝑡𝑎𝑙 𝐸𝑥𝑝𝑒𝑛𝑑𝑖𝑡𝑢𝑟𝑒𝑠 + 𝐷𝑒𝑝𝑟𝑒𝑐𝑖𝑎𝑡𝑖𝑜𝑛𝑠 − 𝐶ℎ𝑎𝑛𝑔𝑒 𝑖𝑛 𝑛𝑜𝑛 𝑐𝑎𝑠ℎ 𝑤𝑜𝑟𝑘𝑖𝑛𝑔 𝑐𝑎𝑝𝑖𝑡𝑎𝑙 + 𝑁𝑒𝑤 𝐷𝑒𝑏𝑡 − 𝐷𝑒𝑏𝑡 𝑅𝑒𝑝𝑎𝑦𝑚𝑒𝑛𝑡
This approach starts with the net income, and then subtracts capital expenditures, since they represent a cash outflow, same as the change in non-cash working capital. Depreciations should be added because they are non-cash charges. Finally, one should add new debt, net of debt repayments. Each of the components of the FCFE formula exposed above will be explained in detail in chapter 3 – valuation.
1.3.1.3 Free Cash Flow to Firm (“FCFF”)
The FCFF approach values the firm as a whole – debt and equity. Accordingly, the free cash flows to the firm are discounted at the weighted average cost of capital (WACC), which is the discount rate that takes into consideration both debt and equity weighted. FCFF is considered the cash flow available to all type of investors: equity holders and debt holders. The value of the company can be obtained as the present value of the FCFF:
Equation 6 – Firm Value
𝐹𝑖𝑟𝑚 𝑉𝑎𝑙𝑢𝑒 = ∑ 𝐹𝐶𝐹𝐹𝑡 (1 + 𝑊𝐴𝐶𝐶)𝑡 𝑡=∞ 𝑡=1 Where: 𝐹𝐶𝐹𝐹𝑡= 𝑓𝑟𝑒𝑒 𝐶𝑎𝑠ℎ 𝐹𝑙𝑜𝑤 𝑡𝑜 𝑡ℎ𝑒 𝑓𝑖𝑟𝑚 𝑖𝑛 𝑦𝑒𝑎𝑟 𝑡 𝑊𝐴𝐶𝐶 = 𝑤𝑒𝑖𝑔ℎ𝑡𝑒𝑑 𝑎𝑣𝑒𝑟𝑎𝑔𝑒 𝑐𝑜𝑠𝑡 𝑜𝑓 𝑐𝑎𝑝𝑖𝑡𝑎𝑙
According to (Stowe et al., 2007), “free cash flow to the firm is the cash flow available to the company’s suppliers of capital after all operating expenses (including taxes) have been paid and necessary investments in working capital (e.g., inventory) and fixed capital (e.g. equipment) have been made”. The FCFF formula is given by:
Equation 7 – FCFF Calculation
𝐹𝐶𝐹𝐹 = 𝐴𝑓𝑡𝑒𝑟 𝑡𝑎𝑥 𝑜𝑝𝑒𝑟𝑎𝑡𝑖𝑛𝑔 𝑖𝑛𝑐𝑜𝑚𝑒 − 𝐶𝑎𝑝𝑖𝑡𝑎𝑙 𝐸𝑥𝑝𝑒𝑛𝑑𝑖𝑡𝑢𝑟𝑒𝑠 + 𝐷𝑒𝑝𝑟𝑒𝑐𝑖𝑎𝑡𝑖𝑜𝑛𝑠 − 𝐶ℎ𝑎𝑛𝑔𝑒 𝑖𝑛 𝑛𝑜𝑛 𝑐𝑎𝑠ℎ 𝑤𝑜𝑟𝑘𝑖𝑛𝑔 𝑐𝑎𝑝𝑖𝑡𝑎𝑙
According to (Damodaran, 2009) “financial service firms are best valued when using equity methods, rather than enterprise valuation models”. Since the company doesn’t have debt in its capital structure, neither intends to, therefore, the DCF valuation model used in this thesis was based on the FCFE approach (described above), because it discounts future cash flows at the cost of equity, which is the only opportunity cost that the stockholders face and the only financial source of company.
1.3.2 Relative Valuation
Relative valuation approach highlights the value of a company by considering a group of comparable companies (peer group), while looking to key common variables among them. Considering (Damodaran, 2005), “a potential investor in a stock tries to estimate its value by looking at the market pricing of “similar” stocks”. Agreeing with (Frykman & Tolleryd, 2003), in order to compute a relative valuation multiple one should follow this steps:
Identification of a key variable to value the company; Choose comparable companies;
Adjust for differences between companies; Calculate multiples of the peer group;
Apply multiples to the chosen company to estimate enterprise value/equity;
The valuation with multiples is computed with ratios that express the firm value in relation to particular variables such as net operating revenue, earnings or book value. By multiplying the average ratio of the peer group with the variable chosen, one obtains the firm value. Multiples offers several advantages to the valuation analysis for the reason that they are easy to calculate and give another valuation perspective – external one (peers). Consequently, one must identify which multiple is more appropriate to value each company, according to industry sector and company structure, and also take precaution on how to compute it correctly. There is one important aspect relatively to which type of multiples should be used to value each company, it is empirically verified by (Liu, 2001) that, “the dispersion of pricing errors increases substantially for multiples based on historical drivers, such as earnings and cash flows, and is especially large for sales multiples”.
Choosing the appropriate group of comparable companies – peer group – is one of the most challenging tasks in relative valuation, distinguishing high-level analysts from common ones. The fact that a company is in the same industry is not sufficient condition for belonging to the peer group since it’s reasonable for companies in the same industry to have completely different growth patterns, capital structure and risk. This fact is easily explained by the discrepancy of stock’s performance within an industry. According to (Damodaran, 2002), the peer group members should be similar to the company being valued, namely in cash flows, growth potential and risk Accordingly, (Goedhart, 2005) recommends to be considered as peers, companies with comparable projections of return on invested capital and growth rate.
Multiples are divided in two groups: enterprise multiples, which reflect the enterprise value (“EV”) of a company, and equity multiples, which express the market capitalization of a company. Examples of enterprise multiples include EV / EBITDA, EV / EBIT and EV / SALES, among others. Concerning, equity multiples, the most commonly used are the Price / Earnings ratio (“PER”) and Price-to-Book value (“PBV”).
Taking into consideration that the company doesn´t hold debt in its capital structure, enterprise multiples will lead to less precise estimates since the comparable companies have totally different capital structures – most of them use debt. Besides that, and in line with (Damodaran, 2009), “the cash flows to a financial service firm cannot be easily estimated, since items like capital expenditures, working capital and debt are not clearly defined”, as so, enterprise value multiples cannot be easily adapted to financial services firms. Consequently, equity multiples will better forecast the value of the company and the most commonly used are price earnings ratio (“PER”) and price to book value ratios (“PBV”). Also due to the fact that this valuation will be based on the FCFE, it seems a more coherent strategy to emphasize equity multiples as a complement to the DCF valuation. Price multiples offers several benefits: it’s simple and easy to implement, uses market information directly and it values a company relative to comparable assets.Price to book value ratio measures the equity market value (MV) of an asset in relation to its book value (BV). It is commonly used to value financial services firms such as banks and insurance companies. Price earnings multiple measures the current share price relatively to earnings (net income).
Equation 8 – PBV 𝑃𝑀𝑎𝑟𝑘𝑒𝑡 𝑉𝑎𝑙𝑢𝑒 𝑃𝐵𝑜𝑜𝑘 𝑉𝑎𝑙𝑢𝑒 Equation 9 – PER 𝑃𝑀𝑎𝑟𝑘𝑒𝑡 𝑉𝑎𝑙𝑢𝑒 𝐸𝑎𝑟𝑛𝑖𝑛𝑔𝑠 𝑝𝑒𝑟 𝑆ℎ𝑎𝑟𝑒
1.4 Explanation of the Model’s Variables 1.4.1 Capital Asset Pricing Model (“CAPM”)
The CAPM approach was developed in 1970 by William Sharp. The author identified two distinct types of risk when calculating the expected return of a stock:
Systematic risk – related with the interest rates of the country of activity and other events that could impact the country’s market as a whole. This risk cannot be diversified anyway since it is intrinsic to the economy.
Specific risk – can be diversified when the investor owns a portfolio of stocks. This type of risk is not correlated with general market variations.
In order to calculate the expected returns of an asset, in this particular case, the cost of equity (Re), one should use CAPM since it is the most widely used method among academics and
analysts. The expected return of an asset equals the rate of a risk free security plus a risk premium shown below:
Equation 10 – CAPM - Re 𝑅𝑒 = 𝑅𝑓+ 𝛽𝑒∗ (𝑅𝑚− 𝑅𝑓) Where: 𝑅𝑓 = 𝑟𝑎𝑡𝑒 𝑜𝑓 𝑎𝑛 𝑖𝑛𝑣𝑒𝑠𝑡𝑚𝑒𝑛𝑡 𝑤𝑖𝑡ℎ 𝑧𝑒𝑟𝑜 𝑟𝑖𝑠𝑘 𝑅𝑚− 𝑅𝑓= 𝑒𝑞𝑢𝑖𝑡𝑦 𝑟𝑖𝑠𝑘 𝑝𝑟𝑒𝑚𝑖𝑢𝑚 𝛽𝑒= 𝑚𝑒𝑎𝑠𝑢𝑟𝑒 𝑜𝑓 𝑡ℎ𝑒 𝑟𝑖𝑠𝑘 𝑜𝑓 𝑐𝑜𝑚𝑝𝑎𝑛𝑦’ 𝑒𝑞𝑢𝑖𝑡𝑦
It is important to stress that one should not invest in the occasion that the expected return of an asset doesn´t meet the required rate of return. All the variables for computing the return of a stock will be individually explained below, aiming to comprehend the multiple drivers of one of the most important assumption of this valuation – cost of equity (Re).
1.4.2 Risk Free
As pointed out by (Damodaran, 2008), “we define risk in statistical terms to be the variance in actual returns around an expected return. The greater this variance, the more risky an investment is perceived to be”. So, for an investment to be risk free, the actual returns should always be equal to the expected return. The risk free (“Rf”) rate is defined as the rate of an
investment with no risk, which implies that, when no variance around the expected return is reported, one should consider the investment as risk free, meaning that the investment will deliver the same return, regardless of the scenario at hand. There is an intrinsic requirement for an investment to be can considered risk free, which concerns its default risk1. As such,
the securities that may be considered as risk free are government bonds2 due to the fact that
the governments control the country’s monetary policy and currency issuing. For the valuation purposes, this thesis will use the risk free rate of a US ten-year treasury bond traded on the 28th of August 2015 – 2.2%.
1.4.3 Equity Risk Premium
The equity risk premium (ERP) reflects the incremental premium required by an investor above the risk free asset and so is defined as the spread between the historical return of a portfolio of stocks (market returns), usually representative of the market portfolio, over the historical returns of government bonds. There is a lot of debate on how to calculate the equity risk premium – historical ERP, as explained above, or alternative ERP regressions based on dividend returns. According to (Damodaran, 2002), the historical ERP is the most commonly used method and accordingly to his data, ERP is 5.75% for a mature market such as the S&P 500.
1.4.4 Country Risk Premium
The calculation of the company’s cost of equity is based on US figures, so in order to reflect the additional risk present in emerging markets one should incorporate a country risk premium in the discount rate (cost of equity). The country risk premium for Brazil was obtained in Damodaran’s data sets – estimated as 2.9%.
1.4.5 Beta
Beta (“”) is a company’s measure of risk, being estimated by regressing stock returns (ODPV3) against the market returns (IBOV), in order to observe how close the company stock and the market move together. This examination is undertaken as the formula suggests:
Equation 11 – Beta Calculation
𝐵𝑒𝑡𝑎 =𝐶𝑜𝑣(𝑅𝑠, 𝑅𝑚) 𝑉𝑎𝑟(𝑅𝑚)
Where:
𝑅𝑠= 𝑐𝑜𝑚𝑝𝑎𝑛𝑦 𝑠𝑡𝑜𝑐𝑘 𝑟𝑒𝑡𝑢𝑟𝑛𝑠
𝑅𝑚= 𝑠𝑡𝑜𝑐𝑘 𝑚𝑎𝑟𝑘𝑒𝑡 𝑟𝑒𝑡𝑢𝑟𝑛𝑠
The company’s beta estimation contemplated different time spans and has shown significant changeability when calculated on a daily, weekly and monthly basis (see Appendix 2). The beta chosen for the valuation is estimated with data from 28th of August 2010 to 28th of August 2015 on a weekly basis, leading to a value of 0.44. This estimation is weekly based because it is the intermediate time between the three time spans and also showed a more representative value, comparatively with the other analysis. A beta below 1 indicate that the stock price will be less volatile than market. In contrast, a beta above 1 represents an investment pattern more volatile than the market.
1.4.6 Cost of Equity
Cost of equity (“Re”) represents the rate of return of a shareholder’s investment. There are
numerous ways to compute the cost of equity: CAPM, Fama-French three-factor model and Arbitrage Pricing Theory model (“APT”).
The CAPM approach is the most widely used method to compute the cost of equity. Nevertheless, the method has been under some criticism during the last years, since Fama-French pointed out that differences in betas from 1963 to 1990 did not explain different stock performances. Even though CAPM is being criticized by the investment community, it’s still the most used and studied method. Thus, to estimate the cost of equity of the company, this thesis will address the CAPM approach, but with some increments, such as inflation differential and country risk premium.
1.4.7 Cost of Debt
Cost of debt (“Rd”) is the current rate that a company pays to use debt financing. Cost of debt it is normally computed after taxes since the interest payments represent are tax-deductibles. The financing cost gives investors an indication of the risk of a company, since the riskier companies are, the higher will be its cost of debt. The company doesn’t have debt in its capital structure so this topic will not be further discussed.
1.4.8 Weighted Average Cost of Capital
The weighted average cost of capital (“WACC”) is the calculation of a firm’s rate of return, taking into consideration the weight of each source of capital (equity and debt) in the firm’s value, multiplying each by the cost of each source of financing. As stated by (Damodaran, 2007), “cost of capital is the cost of all capital invested in an enterprise”, thus calculating the cost of capital of a company with WACC, when the company holds different sources of financing, seems to be the most coherent approach. There is also the fact that WACC considers the adjustment for tax purposes (interest tax shield3), due to the use of debt and payment of interest expenses, by deducting its absolute value. The WACC is calculated according to the formula below:
Equation 12 – WACC Calculation
𝑊𝐴𝐶𝐶 =𝐷 𝑉∗ (1 − 𝑡) ∗ 𝑅𝑑+ 𝐸 𝑉∗ 𝑅𝑒 Where: 𝐷 = 𝑚𝑎𝑟𝑘𝑒𝑡 𝑣𝑎𝑙𝑢𝑒 𝑜𝑓 𝑡ℎ𝑒 𝑓𝑖𝑟𝑚′𝑠 𝑑𝑒𝑏𝑡 𝐸 = 𝑚𝑎𝑟𝑘𝑒𝑡 𝑣𝑎𝑙𝑢𝑒 𝑜𝑓 𝑡ℎ𝑒 𝑓𝑖𝑟𝑚′𝑠 𝑒𝑞𝑢𝑖𝑡𝑦 𝑉 = 𝐷 + 𝐸 = 𝑡𝑜𝑡𝑎𝑙 𝑚𝑎𝑟𝑘𝑒𝑡 𝑣𝑎𝑙𝑢𝑒 𝑜𝑓 𝑡ℎ𝑒 𝑓𝑖𝑟𝑚′𝑠 𝑓𝑖𝑛𝑎𝑛𝑐𝑖𝑛𝑔 𝑡 = 𝑡𝑎𝑥 𝑟𝑎𝑡𝑒
This valuation will not calculate the WACC of the company due to the inexistence of debt in the capital structure, thus, the cost of capital used as a discount rate will be the cost of equity.
1.4.9 Terminal Value
An imperative issue regarding the DCF analysis is the unbounded life of firms. The DCF equation have two distinct elements in the numerator: the free cash flow forecasts and the terminal value. This differentiation is made due to the fact that cash flows cannot be accurately estimated forever. For sake of simplicity, DCF users assume that after several years of cash flow forecasts (terminal year), cash flows will grow forever (terminal value) at a constant rate. According to (Young et al., 1999), the calculation and use of the terminal value is the most consistent way to deal with the uncertainty of the company’s future performance – expressing the upcoming with a perpetuity formula. The terminal value represents a very important portion of the valuation since it accounts for 77% of the equity value estimated.
1.4.10 Growth Rate
Growth rate (“g”) is the rate assumed, in the perpetuity, for the terminal year of the valuation - year after the explicit period. For the growth rate estimation one should take into consideration that growth must not exceed the growth of the economy where the firm operates and dividend growth must increase at the same rate of other performance measures (Damodaran, 2002).
In a general way, g is calculated as a product between the retention rate (“RR”) and the return on equity (“ROE”) as shown below:
Equation 13 – Growth Rate Calculation
𝑔 = 𝑅𝑅 ∗ 𝑅𝑂𝐸
Where,
𝑅𝑅 = 𝑡ℎ𝑒 𝑝𝑒𝑟𝑐𝑒𝑛𝑡𝑎𝑔𝑒 𝑜𝑓 𝑛𝑒𝑡 𝑖𝑛𝑐𝑜𝑚𝑒 𝑟𝑒𝑡𝑎𝑖𝑛𝑒𝑑 𝑏𝑦 𝑎 𝑐𝑜𝑚𝑝𝑎𝑛𝑦 𝑡𝑜 𝑓𝑖𝑛𝑎𝑛𝑐𝑒 𝑖𝑡𝑠 𝑔𝑟𝑜𝑤𝑡ℎ
𝑅𝑂𝐸 = 𝑛𝑒𝑡 𝑖𝑛𝑐𝑜𝑚𝑒 𝑑𝑖𝑣𝑖𝑑𝑒𝑑 𝑏𝑦 𝑡ℎ𝑒 𝑠ℎ𝑎𝑟𝑒ℎ𝑜𝑙𝑑𝑒𝑟’𝑠 𝑒𝑞𝑢𝑖𝑡𝑦
The company has been distributing 100% of its net income in the last years, only retaining an amount for legal reserve purposes – 5% of the net income until 20% of capital value is reached. Post that, the growth rate will not be calculated with the formula shown above, thenceforth will be assumed a growth rate equal to the inflation estimations for the terminal year (4.5%) plus 0.5% premium, reflecting a g of 5%.
1.4.11 Inflation
Inflation is the rate at which the level of prices for goods and services increases, as a result, the currency purchasing power is reduced. Generally, in order to keep the economy running efficiently, central banks restrict inflation and try to avoid deflation4. Inflation is considered one of the main reasons for people investing, because the value of money varies in time - time value of money5.
From 1980 to 1994, Brazil suffered periods of hyperinflation due to the massive volumes of money creation undertaken by the central bank, aiming development projects. Nowadays, Brazil is showing high inflation levels (8%) but not compared with those of the last decades – fourteen-year period of three to four-digit annual inflation rates.
For the purpose of this valuation, the items of the financial statements will be projected in nominal terms, meaning that inflation effects will be taken into consideration. The source used to provide the inflation estimates was the IMF databases – inflation projections, data from March 15th, 2015.
Inflation Differential
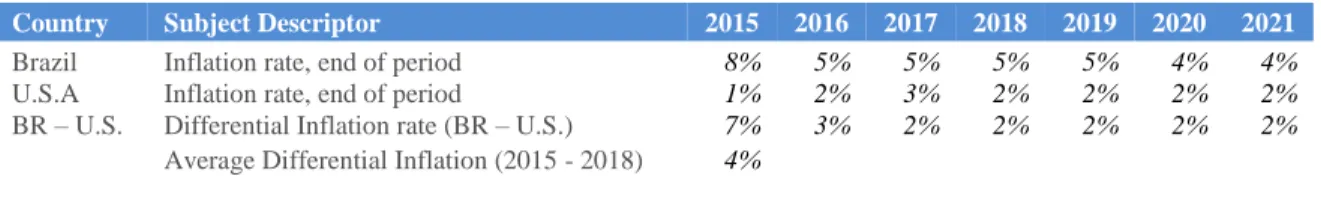
In order to adjust the cost of capital for inflation differences among U.S. and Brazil, one should calculate the spread between Brazilian and U.S. inflation rates. The inflation differential in 2015 is exceptionally high when compared with future projections so, with the purpose of not biasing the cost of equity and the DCF valuation, merely based on 2015 figures, an average during a larger period (2015 to 2018) is made, giving a value of 4%.
Table 1 - Inflation Differential between Brazil and United States (U.S.)
Country Subject Descriptor 2015 2016 2017 2018 2019 2020 2021
Brazil Inflation rate, end of period 8% 5% 5% 5% 5% 4% 4%
U.S.A Inflation rate, end of period 1% 2% 3% 2% 2% 2% 2%
BR – U.S. Differential Inflation rate (BR – U.S.) 7% 3% 2% 2% 2% 2% 2%
Average Differential Inflation (2015 - 2018) 4%
Source: IMF and own calculations
1.5 Valuation in emerging markets
More than ever, capital movements between countries are becoming more liberalized, in a way that companies easily shift their investments from developed countries to emerging markets (i.e. Latin America and Asia), pursuing expansion of activities and risk diversification. Investing in emerging markets provide attractive returns when compared with mature markets, but in contrast, expose an investor or a company to additional risk, i.e. high inflation levels, macroeconomic volatility, political changes, war, corruption, regulatory changes and the lack of accounting control. The cross border investment increase has obligated academics and analysts to review the assumptions on the foundations of value (risk parameters, debt ratios and growth rates), which is forcing one to apply dynamic valuation models instead of the static ones – used in mature markets.
As explained by (Goedhart et al., 2010), there are two ways to deal with the uncertainty in emerging markets: develop DCF scenarios or increment a country risk premium to the cost of capital.
The first approach develops two different scenarios for future cash flows weighted at a certain probability: The positive scenario where the assumptions reflects business growth as it is expected, on the other hand, a negative scenario need to be valued, in order to match with the risks associated with emerging markets.
The second technique adds a country risk premium to the cost of capital of the company, which will negatively affect the share price valuation since it increases the denominator in the present value calculation, thus reflecting the risks associated with emerging markets.
This thesis addressed the second approach, adding a country risk premium, being the construction of scenarios considered not plausible for the valuation, as a consequence of the sustainable business model of the company and industry type (described in chapter 2). Therefore, adding a country risk premium to the calculation of the cost of equity will reflect the potential risks over the economy that can impact the company in the long run.
2
Market and Company Overview
2.1
Market Overview
In order to perform an accurate valuation of OdontoPrev, it´s crucial to analyze the environment in which the company operates, with special attention to industry growth drivers and risk factors of the sector.
According to ANS6, in 2014, 50.8 million Brazilians were members of private healthcare
plans and 21.3 million were members of dental plan benefits - 10% of the Brazilian population7. The dental plans market grew from 2.6 million members, in 2000, to 21.3 million in 2014, corresponding to a CAGR of 16.2%. In the same period, OdontoPrev achieved a CAGR of 20.8%, growing from 450 thousand to 6.3 million members. In 2000, the company had 17% market share and nowadays has 30% (see Appendix 3). A significant portion of the dental market is concentrated in corporate plans (as a benefit from companies to employees) which is a very reliable source of new members, nevertheless highly dependent on job creation.
Exhibit 1 – Evolution of OdontoPrev Members vs. Dental Plans Market
Source: OdontoPrev and ANS.
6ANS is the regulator of the healthcare industry. 447 6,316 2,603 21,263 2,000 4,000 6,000 8,000 10,000 12,000 14,000 16,000 18,000 20,000 22,000 24,000 2000 2001 2002 2003 2004 2005 2006 2007 2008 2009 2010 2011 2012 2013 2014 OdontoPrev members Dental Plans Market
Keeping into view the Brazilian population and the percentage of the country’s population that owns a dental plan (11%), it is expected that dental sector continue to grow at least at the same pace of the last years.
Brazil has one of the highest dentists supply in the world8, being registered 268 thousand
professionals, equivalent to a dentist to member ratio of 1:764 comparatively with U.S. - 160 thousand professionals for a population of 320 million, which presents a ratio of 1:2000. While comparing these two countries and having in mind that the U.S. is a developed country it’s noticeable that Brazil has an excess surplus of dentist professionals. Even though the existence of numerous professionals in the sector, there is a huge gap between supply and demand for this service, since only 11% of the population has access to dental care. This occurred due to the lack of efficient companies providing the service, resulting in higher prices – not affordable for the population in general. As opposed to the healthcare industry, where individuals have the government healthcare system, the dental care was only fulfilled by dentists, without the support of a management team and financial partner, being extremely unaffordable for the population. This business model was directed to the segment of the population who could afford higher prices and prompt payment. This fact allowed for the provision of highly technical and scientifically advanced dental care procedures using refined and exclusive resources.
The lack of access to dental care created an opportunity for dental plan companies to penetrate the market, supported with capital and management know-how. As a result, after the second half of the 1990s, the dental plan sector grew consistently due to several factors:
Structural disparity between the supply and demand of the service; Lack of public service alternative;
Inclusion of dental plans in corporation’s benefits for the employee; Interest from new distribution channels;
Reforms made by the regulator of the sector (ANS);
2.2
Risk Factors
There are two types of risk factors to be pointed out: risks related to Brazil (macroeconomic events) and risks related to the dental plan sector. While analyzing an emerging market, it’s important to be aware of all macroeconomic and political risks that could harm the company. The Brazilian government exercises significant influence over the economy and so, there are several variables that could negatively affect the company:
Unemployment Inflation
Fluctuation of interest rates
Volatility in the exchange rate (mostly, BRL - USD)
Those negative variables can impact catastrophically the Brazilian economy in a sense that they can restrict the production of the country (GDP), raise the prices of goods and services at an internal and external level, leading to a reduction in the OdontoPrev’s dental plan sale and ultimately impact the company in the stock market. Dental care companies operate in the insurance business and in order to be profitable, have to accurately estimate and control costs: the company increases monthly fees to offset future cost increases. Companies have been reducing its dependence on external brokers, since they work without exclusivity and have an excessive bargaining power. Companies must undergo new distribution channels, such as bancassurance9, direct sales and online sales to create a better dynamic of customer addition, leading to a better quality of sales, with lower commissioning and higher margins. The dental care industry could be adversely affected by new government regulation and also in the case where government decides to establish a subsided dental care system itself. Nevertheless, the risk pattern of dental care is different from medical care. Medical care costs increase with the aging of the population and with the introduction of new and costlier equipment. Inversely related, dental care costs are higher in the beginning of the contract period, since dental treatments had never been made but after this initial peak, the cost per member decreases until it reaches a maintenance level that tends to remain stable, independently of the member’s age (see Appendix 4).
2.3
Company Background
OdontoPrev was established in 1987, when a group of dentists identified an opportunity in providing dental care for corporate clients. In August 1998, a Private Equity firm acquired control of OdontoPrev, highly contributing to the strategic leadership positioning of the company, current market leader in the sector and responsible for the development of new innovative corporate governance practices in the Healthcare sector. In December 2006, the company went public through an Initial Public Offering (IPO), raising 171,411 BRL net of placement expenses. Overall, 18,643,973 shares were sold at 28 BRL per share, totalling 522 million BRL - at this time the free float of the company was 84.2%. The IPO and the companies that OdontoPrev bought contributed to a member increase of 1.5 million (2006) to 6.2 million (2013). After the IPO, OdontoPrev bought several companies (inorganic growth10), mainly small competitors and other companies that presented high potential of synergy, generating competitive advantages, i.e. Easy, a supplier of medical software provided a helpful monitoring system that assess the quality of the service provided and mitigates fraudulent activity on the dentist and customer side, resulting in a lower DLR11.
Exhibit 2 – Evolution of the Net Operating Revenue and Companies Bought since the IPO
Source: OdontoPrev Corporate Presentation September 2015.
10A growth in the operations of a business, due to mergers or takeovers, rather than an increase in the
company’s own business activity.
In October 2009, OdontoPrev celebrated an agreement with Bradesco Dental S.A to merge the activities of both companies and two months later OdontoPrev was a fully integrated subsidiary of Bradesco S.A (see company structure below):
Exhibit 3 – Company Structure: Owners and Subsidiaries
1 2
Source: OdontoPrev; 1 – Company Shares; 2 – Minority Shareholders
In June 2013, OdontoPrev signed a contract with Banco do Brasil Seguros Participações S.A for an Association through a separate vehicle - Brasildental Operadora de Planos Odontológicos S.A, with the objective of distribute and commercialize dental plans, exclusively under the channel and brand name of Banco do Brasil, during 20 years, with the option of renewal for the same period. This association will allow OdontoPrev to better reach SME’s and individual contracts, which are the operating segments that the company as lack of access. Banco do Brasil has 60 million clients and those are different target clients while comparing with Bradesco.
2.4
Company Analysis
OdontoPrev is a dental care operator that provides dental benefit plans for three main segments: corporate, small and medium enterprises (“SME”) and individuals. In compensation for the dental service provided, the company charges a monthly fee, depending on the coverage of the plan. In December 2014, the company had 6.3 million clients, from which 5.1 million were corporate clients; 800 thousand SME contracts and 400 thousand were individuals. The member’s portfolio of the company divided by segment is exhibited below.
Exhibit 4 - Evolution of Members by Segment
Source: OdontoPrev Corporate Presentation of September 2015
OdontoPrev is the market leader of the dental care sector in Latin America, where its clients enjoy differentiated health solutions provided by an extremely specialized network of 25,000 dentists. OdontoPrev operate two distinct types of plans: pre-paid plans and post-paid plans. In the first and most chosen payment modality, the type of coverage and the monthly payment are previously defined. The customer receives the dental care service covered by the plan chosen through the accredited network, without any additional disbursement. In the second model, the customer chooses the surgeon and the clinic where wants to be treated, but has to pay directly to the dentist and subsequently ask for the reimbursement, under the limits of the contract. OdontoPrev also provide some treatments in company-owned units.
2.5
Company’s Stock Performance
OdontoPrev is listed in the BM&FBovespa12 (Ticker: ODPV3), being a component of Brazil IbrX 100 index, which is designed to measure average stock performance of the 100 most traded stocks of the Brazilian stock market. The company is part of the most demanding listing segment in Brazil (also called Novo Mercado), founded in 2000, aiming companies to voluntarily assume corporate governance levels above the requirements. For instance, the minimum requirement for Dividend Pay-out Ratio (“DPR”) is 25%, meanwhile OdontoPrev distributes 100% of the net income to shareholders. The company’s free float represents 47.6% of total shares, dispersed in 33 countries, 50.01% belongs to Bradesco, the controlling shareholder, and the remaining amount is treasury (see Appendix 5). Bradesco is the second largest private bank in Brazil and is considered a strong partner of OdontoPrev since the bank has a large amount of clients (more than 80 million) and a strong reputation with them. The company had been constantly beating the Bovespa index since 2009 and the total shareholder remuneration in 2014 was 4.5%, represented by a share variation of 0.3% and 4.2% in dividends and interest on capital.
Exhibit 5 - Total Shareholder Remuneration since 2006
Source: OdontoPrev Corporate Presentation September 2015.
2.6
Company Strategy
The strategy of OdontoPrev is to lead the consolidation of the healthcare sector in Brazil, by providing dental care treatment to the population at a fair price, or as stated in their mission: “To become a major link between society and dentistry, adding value to this relationship by providing excellent services to both”.
The mission of the company will be achieved through the efforts of an experienced and specialized management team, who have a deep understanding of the Brazilian dental care market, by maximizing the quality and reliability of the service given. OdontoPrev is constantly seeking economies of scale to improve cost efficiency, placing though the product at a fair price.
There are multiple growth vectors that allow this strategy to happen:
Inertial growth: the expansion of corporate clients’ workforce represents a chance to growth, since a higher number of members will be reached without cost of capture; Organic growth: capturing new clients with the effort of sales and marketing teams; Inorganic growth: by acquiring companies seeking potential synergies whereas could
increase growth and generate higher results;
Commercial partnerships and new distribution channels: strategic partnerships such as bancassurance is the optimal way to access unexplored markets with lower penetration, providing higher growth potential, namely SME’s and individuals;
Those growth vectors are consistent with the distribution channels used by the company, allowing for the provision of an efficient and diversified distribution channel network:
Internal sales team; Online sale;
Independent brokers;
Cross sale with medical plans (through partnerships with other operators); Bancassurance (Bradesco & Banco do Brasil);
2.7
Competitive Advantages
The dental service provided by OdontoPrev is recognized for its reliability by more than 6,000 Brazilian and multinational corporate clients, such as Ambev, Globo, MacDonald’s and Coca Cola. The diversity of services offered, carefully segmented for each group of clients plus the multiple and strategic distribution channels enable the company to grow sustainably. Besides that, OdontoPrev is proprietary of an IT platform, allowing the company to:
Manage the logistics and relations with dentists; Monitor the performance of each dentist;
Monitor the oral health of their associates and their relations with the company; Adopt a pro-active approach for managing the clinical and behavioural risk of dentists
and members;
Monitor the quality of the services provided;
The IT platform owned by the company has proven to be a good competitive advantage, resulting in a significant decrease in the cost of services, by reducing the service claims while increasing the quality of the service provided due to the higher monitoring and control of the dentist’s skills and member’s claims.
The management team have demonstrated a deep knowledge of the market. Most of the managers are dental plan specialists, with expertise in the dental sector for decades, having the awareness to design the product to fit different client’s needs. Concluding, actions taken in the past and measures implemented recently, alongside with the multiple competitive advantages presents OdontoPrev as an undisputed market leader with lot of potential for further growth.
2.8
Competitor Analysis
The dental care sector in Brazil is highly fragmented, facing significant rivalry from new and existing competitors. In the last 3 years, companies engaged in an irrational fierce competition fighting for the same client, pushing towards a price war scenario. According to an Industry Outlook for 2015, done by Votorantim corretora13: “In 2012, the difference between the average maximum and minimum prices was R$ 6.90. In June 2014, this gap narrowed to R$ 3.60, showing a more competitive environment among the main players”. The war on prices ended last year due to the unaffordable costs that companies had to bear, as a consequence of that strategy.
As mentioned before, 21.3 million Brazilians own a dental plan and OdontoPrev assists 6.3 million, representing 30% of the market. One crucial fact that explains the leadership position of the company is the degree of specialization in the dental care sector, comparatively to its peers, which are mainly healthcare operators – cross-selling healthcare plans with dental plans. Thus, the company provides a differentiated service and operates throughout the entire Brazilian territory.
The company operates in a competitive market where companies offer dental care plans with comparable benefits, such as healthcare companies, insurance companies and hospitals. The sector has 1,425 dental care active providers and according to ANS, the dental plan sector is going through a period of consolidation14. Most of the companies operating in the dental plan sector are specialized in medical care but also sell dental plans (cross selling), i.e. Amil, which was bought by UnitedHealthcare15, has 10% of the market share. Amil is the biggest Brazilian company in the healthcare sector, specialized in all type of medical services, dental benefits included. Other significant players are: InterOdonto (5%), SulAmérica, MetLife and Caixa all with 3% each (see Appendix 6).
13 Votorantim Corretora is a Brazilian Investment bank acting mostly as a brokerage firm.
14 A stage in the life of an industry in which its components start merging to form fewer components. 15UnitedHealthcare is one of the biggest medical insurance companies across the US and internationally.
3 Valuation
In this chapter, assumptions and forecasts that ultimately lead to the estimated value per share will be presented. Each variable of the income statement will be defined, analyzed and projected for future periods (explicit period16 and terminal value), the same will be done to the cost of capital and the determinants of its calculation. All the assumptions are estimates of the IMF database projections and own analysis of company historical performance. Furthermore, as introduced previously, two methods were used to value the company on the 31st of December 2015: The DCF Model and the Relative Valuation approach.
3.1
Net Operating Revenue
The company valuation strongly depends on the revenues forecast, since the vast majority of the items in the income statement are projected as a percentage of net operating revenue. According to (Stowe et al., 2007), a top-down forecasting approach should be followed, starting with international and national macroeconomic forecasts to reach industry and asset forecast, in contrast with the bottom-up forecasting approach, which is based on asset forecasts rather than macroeconomic environment – subject to inconsistent problems, such as different inflation assumptions undertaken by different analysts.
OdontoPrev offers dental plan benefits to three different segments (corporate, SME’s and individuals), each of them with different growth standards and pricing strategies – considered relevant to forecast revenues for the explicit period. Since the company only started to disclose their revenues by type of segment in the first quarter of 2015 and yet has not provided any historical background, this Thesis will not display the breakdown of revenues by segment. Hence, the revenues estimation was addressed using global values, in mind revenues historical growth.
To better understand the growth drivers of sales, a breakdown between average ticket and average members is made: average ticket refers to the price that members pay per month (R$/Live/Month) and average members stand for the amount of contracts that a company owns within one year, on average. For the average ticket - as a pricing strategy of the company - a growth rate marginally beyond inflation is assumed, as mentioned in the conference call of the company in first quarter of 2015. Thus, based on IMF inflation estimates and historical pricing policy of the company, an average ticket growth weighted at 90% of the estimated inflation is assumed, revealing a 4% ticket growth per year. The average members forecast is based on the historical average growth between 2012 and 2015 - a period where sales showed a consistent and constant growth (see Appendix 7).
After estimating the average members and average ticket, a forecast of the NOR for the explicit period is the final outcome, reaching to R$ 2.25 billion in 2021, as exhibited below:
Exhibit 6 – Historical and Forecasted NOR, in Value (R$ million) and Percentage (%)
Source: OdontoPrev and own calculations
The average ticket for 2015 is calculated taking into consideration the average ticket reported in the 1st half of 2015, 16.64 BRL, which is assumed to remain the same value for the 2nd half of the year. Average members in 2015 are estimated to grow 3% over 2014.
The combined effect of the revenue drivers (average ticket and average members) results in a growth rate of 10% of the net operating revenue (NOR) during the explicit period – except for 2015 and 2016 which is 12%, as shown in the figure below:
Exhibit 7 – Historical and Forecasted NOR growth (%) vs. Brazilian GDP (%), at current prices
Source: IMF data, OdontoPrev and own calculations
12.6% 7.7% 9.4% 7.1% 7.8% 6.8% 7.9% 7.6% 7.6% 7.7% 7.7% 19.7% 14.4% 11.9% 8.1% 12.1% 12.4% 10.0% 9.8% 9.8% 9.7% 9.7%
2011 2012 2013 2014 2015 2016E 2017E 2018E 2019E 2020E 2021E
Brazilian GDP Growth OdontoPrev NOR growth
382 698 1,156 1,295 1,413 2,255 23% 20% 82% 20% 14% 12% 8% 12% 12% 10% 10% 10% 10% 10% 0 200 400 600 800 1,000 1,200 1,400 1,600 1,800 2,000 2,200 2,400
2008 2009 2010 2011 2012 2013 2014 2015 2016E 2017E 2018E 2019E 2020E 2021E NOR NOR Growth
3.2
Cost of Services
This thesis calculated the cost of services as a percentage of NOR, taking into consideration the top-down forecasting approach and following (Goedhart et al., 2010), who recommends operating expenses, such as cost of services, selling and administrative expenses and other operating expenses to be forecasted as a percentage of net operating revenue. Cost of services is the cost of providing the treatment to the clients of the company and it’s composed by:
Healthcare claims (87% of cost of services) – represents the amount paid to the network of dentists for treatment purposes. In the past years, this item has shown variability in the amount of claims. The company closely monitors its contracts to mitigate future risks and currently considers that a claim ratio of up to 60% permits a margin that supports the company’s administrative expenses;
Payroll charges on services (6% of cost of services) – social security charges on the account of the employee. Since 2010, the company is facing a judicial process claiming allegedly unpaid extraordinary expenses. OdontoPrev is holding the position that the network of dental practitioners’ social security taxation is not imputable to the company, but rather to the dental offices, since OdontoPrev simply aims to act as an intermediate;
Dental materials (1% of cost of services) – provided to the network of dental clinics to ensure the maximum quality of the treatment;
Other expenses (6% of cost of services) – composed by IBNR and other expenses. IBNR stands for incurred but not reported claims reserve. This item refers to claims that were accounted later than the period of occurrence, due to a certain circumstance.
Cost of services represent the percentage of NOR that turns into cost for the company and the major growth driver of this item is the healthcare claims. Cost of services is estimated as a whole, in a simplistic way, since the other components did not represent a significant weight in this item, as so, they were not projected for the explicit period. In the last 8 years, cost of services had fluctuated between 43% and 51%, as a percentage of NOR.
Exhibit 8 – Historical and Forecasted Cost of Services as a % of NOR
Source: OdontoPrev and own calculations.
Cost of services represented 47% of NOR in the first half of 2015, which is in line in the last two years, thus it’s assumed that figure for 2015. Moreover, for the explicit period, cost of services is projected to represent 46% of NOR, displaying a reduction in the DLR, as result of the management team’s effort to mitigate the fraud and improve the quality of the service given (see Appendix 8). This assumption is also supported by the rational stability of the dental care need in the oldest members of the company’s portfolio.
43% 44% 44%
49% 50% 51%
47% 47% 47% 46% 46% 46% 46% 46% 46%
2007 2008 2009 2010 2011 2012 2013 2014 2015 2016E 2017E 2018E 2019E 2020E 2021E
3.3
Selling Expenses
Selling Expenses comprise the amount of commissions paid to brokers, who were responsible for the dental plan sale. Generally, these expenses follow the growth pattern of revenues, but not necessarily at the same pace, given that the company is changing its distribution channels in order to increase its margin and reduce the dependence on external brokers.
The company relies on many sources to distribute its service, such as external brokers, own sales team and retail stores. However, this year the company launched a new and more efficient distribution channel: the online selling, which will help the company to reach new clients with zero commissioning, resulting in an overall lower cost. In addition, bancassurance is becoming a more prominent and strategic distribution channel, resulting in a reduction of the selling commission from 17.5% to 12.5%, in comparison with retail store channels and external brokers. As a result, a reduction of the selling expenses’s weight on NOR is forecasted for future periods.
In the last four years, selling expenses presented a constant performance profile, ranging between 9% and 9.5% of NOR. After the implementation of distribution channel structural changes, one may assume a growth for this item in line with sales, but must also take into consideration the efficiency of the new distribution channels. Thus, for the projections of selling expenses, 90% of the revenues growth rate is considered, emphasizing future cost improvements.