MEASURING BRAND EQUITY
WITH SOCIAL MEDIA
MEDICIÓN DEL BRAND EQUITY
CON SOCIAL MEDIA
A
nAM
ArgAridAB
Arreto/
AMBArreto@
fcsh.
unl.
ptprofesorA AuxiliAr del depArtAMento de ciênciAs de lA coMunicAción de lA universidAde novA de lisBoA, lisBoA, portugAl
this work is finAnced By nAtionAl funds through the fct - foundAtion for science And technology under the project ref: uid / cci / 04667/2019
1er triMestre
,
enero 2020|
sección teMáticA|
pp.
68-85r e c i B i d o
:
4/11/2019–
A c e p tA d o:
18/12/2020REDES SOCIALES Y FENÓMENOS
COMUNICATIVOS: APLICACIÓN,
ANÁLISIS Y METODOLOGÍAS
DE INVESTIGACIÓN
ABSTRACT
The main purpose of this paper is to suggest a consumer-based brand equity (CBBE) model that takes into account new ways of interaction between brands and consumers on social media, to propose its simple, valid and parsimonious measurement scale and to assess if and how differently brands are perceived when consumers are exposed (or not) to their participation on Facebook.
The scale was applied to 361 consumers that follow a specific brand on Facebook and consumers that don’t, in order to understand if differences can be found on brand equity between consumers. Hence, three groups of consumers of the same brand were considered and their reactions to brand compared: consumers that follow the brand on Facebook; consumers that do not follow the brand on Facebook, although they are Facebook users; and consumers that do not use Facebook.
Findings suggest that for brand followers on Facebook the brand had better results on brand image, brand loyalty, and brand relationship than for the other two groups. No statistically significant difference was found on brand image, brand loyalty, and brand relationship between people that do not follow the brand on Facebook (whether or not they use it) in the same variables.
PALABRAS CLAVE
Brand equity; brands; measurement; social media.
KEYWORDS
Brand equity; marcas; medición; social media.
RESUMEN
El propósito de este trabajo es sugerir un modelo de brand equity basado en el consumidor que tenga en cuenta las nuevas formas de interacción entre marcas y consumidores en las redes sociales, además de proponer una escala de medición simple, válida y económica, y evaluar si y cómo se perciben las marcas de manera diferente cuando los consumidores están expuestos (o no) a su participación en Facebook.
La escala se aplicó a 361 consumidores que siguen una marca específica en Facebook y a consumidores que no lo hacen, para compreender si se pueden encontrar diferencias en el brand equity. Se consideraron tres grupos de consumidores y se compararon sus reacciones a la misma marca: consumidores que siguen la marca en Facebook; consumidores que no siguen la marca en Facebook, aunque son usuarios de Facebook; y los consumidores que no usan Facebook.
Los hallazgos sugieren que para los seguidores de la marca en Facebook, la marca tuvo mejores resultados en la imagen de marca, lealtad a la marca y relación de marca que para los otros dos grupos. Para las mismas variables (imagen de marca, lealtad a la marca y relación de marca) no se ha encontrado una diferencia estadísticamente significativa entre las personas que no siguen la marca en Facebook, ya sea porque no usen Facebook o porque no siguen la marca en el Facebook.
1. INTRODUCCIÓN
Influenced by the growing number of adopters from different parts of the world, marketing ma-nagers have invested crescent shares of their communication budgets on social network sites (SNS) to maintain their profile web pages and to publish paid advertisements. eMarketer (2018) predicts that US social network video ad revenues will reach $11.69bn in 2020, more than doubling the 2017 total of $5.68bn.
One of the reasons why SNS are important to brands is because SNS consumers are at the cen-ter of discussions and talk about brands through «word of mouth» (WOM) (Chu and Kim, 2011) - a type of earned advertising that has a tendency to reach thousands of current and potential consumers at no additional cost (Barreto, 2014).
Facebook, the leading social network in the world, is still the most popular and the most widely used (DreamGrow, 2018). Facebook users can have different levels of brand interaction through branded Facebook fan pages. These levels are essentially «likes», «comments;» and «shares» (Peters et al, 2012) that show user engagement - a crucial aspect of social media marketing (Ashley & Tuten, 2015; Schulze et al., 2015). The passive component (consumption) is positively influenced by the sense of belonging while the active component (contribution) is influenced by entertainment and socialization (Triantafillidou & Siomkos, 2018).
Previous studies have analyzed the relationship between participation on a Facebook page and customer behavior. Borle et al. (2012) results suggested effects on behavioral loyalty as well as deepening relationships with clients. In fact, González et al. (2015) study shows a link between Facebook intention to use in purchasing decisions, being influenced by variables such as percei-ved utility, social influence and attitude towards Facebook. On the other hand, Estrella-Ramón et al. (2019) found that marketers’ and users’ content (specifically content quality, content valence, and content volume) on Facebook have significant effects on brand equity. Also, a recent study from Erkan et al. (2019) focused on the effect of Facebook ads revealed that they play an impor-tant role on brand image, brand awareness, and brand equity.
Despite the growing number of studies focused on Facebook, little is known about the impact of brands’ participation on SNS on their brand equity overall from the consumer perspective (with exception of Bruhn, Schoenmueller & Schäfer, 2012), specifically, on various brand equity cons-tructs, such as brand awareness, brand image, brand loyalty, and brand relationship.
From an academic point of view, although Aaker (1991) and Keller (1993) are among the most quoted academics in brand equity measurement analysis, they only conceptualized brand equity, and have not operationalized a scale for its measurement, specially one applied to the SNS context.
The model that is suggested seeks to contribute to the academic discussion of this topic by com-bining in a single model some already established brand equity components in the literature, like Aaker & Joachimsthaler (2000) and Keller (1993) models. Contrary to the majority of studies on CBBE, the presented model aims to go beyond the individual perception of brand equity and includes a holistic approach to the process. That means recognizing the importance of the influence of social dynamics and including it in the analysis of the consumer-brand relationship. The chosen components of the model are also based on the neural psychology findings that
provide useful inputs on how a brand is perceived (e.g. Quartz & Asp 2005; Yoon et al. 2006; Moutinho & Santos 2009). Special attention was also given to the identification of key metrics that can explain customer behavior and their purchase decision, providing a reliable measure of the brand's ability to generate cash flow.
2. DESIGN AND METHOD
The main purpose of this paper is to suggest a consumer-based brand equity model and its scale that allows the measurement of brand equity through established constructs such as awareness, image, loyalty and brand relationship. The novelty of this scale comes by taking into account new ways of interaction between brands and consumers on social media.
The choice of a conceptual model able to describe the process of construction of brand equity is not consensual given its behavioral nature and is hence complex and interpretive. Therefore, although the literature is composed of several proposals, there is still interest for new conceptual contributions of the discussed phenomenon. From an academic point of view, Aaker (1991) & Keller (1993) are among the most quoted academics in brand equity measurement analysis, but as far as it is known, their models have not been applied to assess the effectiveness of brand presence on SNS on their brand equity.
The four constructs that compose the suggested CBBE model are: brand awareness, brand ima-ge, brand loyalty, and brand relationship (Figure 1). These components constitute the outcomes of branding decisions that impact the equity of a brand, causing reactions to each other in a linear process and are beyond the objectively perceived value.
Brand awareness represents the measure of the percentage of the target market that is aware of a brand name (Bovee et al, 1995), and for that reason plays an important role in consumer decision-making, perceived value, and consumer loyalty. In order to have strong, favorable, and unique associations, a brand should first be in the consumer’s memory (Keller, 1993) and should be recognized as a member of a certain product category. Only then do the chances of a brand being in the consideration set increase, allowing the occurrence of loyalty (consumers respond strongly and decide to buy familiar and well-established brands (Jacoby, Syzabillo, & Schach, 1977; Roselius, 1971). Besides, brand awareness is an asset that can be durable and sustai-nable. Hence, it may be extremely difficult to dislodge a brand that had achieved a dominant awareness level (Aaker, 1996). Therefore, brand awareness is an indispensable asset and the base on which to place any brand in the consideration set, increasing choice advantage (Aaker, 1991; Keller, 2003), and strengthening the brand image.
There are different levels of brand awareness, from recognition to recall, or to top-of-mind (Aaker, 1991), and multiple sources that lead to brand knowledge: feelings, behaviors, experiences, attitudes, beliefs, perceptions and thoughts, which are the basic dimensions. Secondary sources of brand knowledge can be people (employees, endorsers), things (events, causes, endorse-ments), places (country of origin, channel) or other brands (co-brands, ingredients, company, extensions).
Brand image is constituted by a set of brand associations and subjective evaluations automati-cally formed, made over time, that may or may not represent the objective reality (Aaker, 1991;
Keller, 1993). Using the words of Keller (1993, pg. 3) «brand image is defined as perceptions about a brand as reflected by the brand associations held in consumer memory». This definition, as mentioned by Korchia (1999), is consistent with many other authors’ (Newman, 1957; Di-chter, 1985; Aaker, 1991; Engel, Blackwell & Miniard, 1995, etc).
Brand image is an important element for the creation of brand equity, inasmuch as it helps to process or retrieve information related to the brand, influencing buying decisions and behaviors. Moreover, brand image has a differentiation role, given that each image is unique (Aaker, 1991). When the image is positive it can become a stimulus for positive attitudes and feelings, with the possibility of leading the consumer to commitment (along with the existence of satisfac-tion), or to loyalty (Janiszewski & Osselaer, 2000), while providing a basis for extensions (Jiang, Dev, Rao, 2002; Klink, Smith, 2001; McCarthy, Heath & Milberg, 2001).
Customer loyalty is another concept widely discussed in marketing research and many defini-tions have been introduced over time. Engel, Kollat & Blackwell (1982), for instance, defined brand loyalty as «the preferential, attitudinal and behavioral response toward one or more brands in a product category expressed over a period of time by a consumer» (in Anderson & Srinivasan, 2003). Other researchers have defined loyalty as «a favorable attitude toward a brand resulting in consistent purchase of the brand over time» (Assael, 1992, pg.87).
According to these definitions, loyalty is expressed by an intention to maintain the relationship in the future reflected by continued purchases. Nonetheless, this measure of loyalty has been criticized due to the fact that customers with weak relational bonds and little loyalty may report high continuity expectations as a result of their perceptions of high switching costs or their lack of time to evaluate alternatives (Oliver, 1999).
Loyalty, therefore, implies a preference to a particular brand or company, although satisfactory alternatives may exist. Moreover, «for a customer to become and remain loyal, he or she must believe that an object firms’ products continue to offer the best choice alternative» (idem, pg. 35).
Obtaining consumer loyalty has been considered a crucial aspect for gaining success and sustai-nability over time (Keating et al, 2003). Not only will it enable higher future purchase intention, but it will also favor higher intensity in positive word-of-mouth (Hallowell, 1996), lower price sen-sibility (Lynch & Ariely, 2000), create more stable and bigger incomes (Knox, Denison, 2000), lower switching to competitors (Yi & La, 2004), maintain premium pricing, provide greater bar-gaining power with channels of distribution, reduce selling costs, and synergize advantages of brand extensions to related product/service categories.
For some researchers, the relation between satisfaction and loyalty seems almost intuitive and se-veral have attempted to confirm it (Newman & Werbel, 1973; Woodside et al., 1989; Cronin & Taylor, 1992). The results show that the strength of the relation between satisfaction and loyalty varies significantly under different conditions. For example, Jones & Sasser (1995) discovered that the mentioned strength depends upon the competitive structure of the industry. Oliver (1999) discovered that satisfaction leads to loyalty, but true loyalty can only be achieved when other factors are present. Also, loyalty implies satisfaction, but satisfaction does not necessarily lead to loyalty (Waddell, 1995; Oliver, 1999).
Due to the fact that what people say they will pay and which brands they claim to be loyal to do not usually closely match what they actually do and can be influenced by the desired image perception of the participant, the short-term results of brand equity are believed to be the best measurable results (Tim Ambler, 1995). Therefore, the focus should be on recent past consump-tion behaviors.
The focus on brand relationship is not novel. Fournier (1998), for instance, is among the firsts to suggest that brands should be viewed as relationship partners. Even before, Grönroos (1994) suggested that relationship marketing would be one of a number of paradigms that would in-creasingly supplement the marketing mix perspective. Moreover, Berry (2000) advocated that brands should go beyond getting pure economic value to also generate emotional value such as closeness and affection. In other words, «being authentic summations of a company with a soul» (pg.134).
In the last years different researchers have suggested a switch in the marketing perspective, going from the cognitive (rational) to the affective point of view, focusing on human feelings. However, in order to accomplish a close relationship with customers, firms’ products and servi-ces should first meet the customer’s needs and expectations. Nevertheless, even a brand with a solid and strong position in a specific market, may not be able to achieve the desired relations-hip equity (defined as the tendency of the customer to stick with the brand, above and beyond the customer’s objective and subjective assessments of the brand), that enables customer to be less willing to recreate a relationship with an alternative provider (Lemon et al. 2001).
Brand relationship is therefore a cluster of emotional and functional values (de Chernatony & Dall’Olmo Riley, 1999), a specific asset that measures how consumers are engaged and invol-ved with a brand. Moreover, it allows for an understanding of the extent to which consumers are willing to recommend a brand. This relationship equity (also known as retention equity) repre-sents the psychological or emotional meanings of a brand to the consumer.
Though the components are the same, the model differs in the last two stages, as it postulates that brand loyalty can also be the outcome of brand relationship and not necessarily the inverse. Finally, the model is simple, valid and parsimonious, capable of being applied at any context, whether it is in the consumption market (product and services) or business-to-business.
Figure 1: CBBE Model for Low and High Involvement Purchases
Not all authors see brand awareness as a brand equity component (e.g., Berry, 2000; Prasad & Dev, 2000), claiming that it is not a direct antecedent of brand equity. This view, however, is not shared in this paper, since awareness can impact future brand choice and market share (Srinivasan, Park & Chang, 2005) like any other asset, and is directly related to brand-related attitudes, such as brand loyalty (Konecnik & Gartner, 2007).
Regarding brand image, from a neuroscience point of view it represents a neurological reaction toward a tangible or intangible object; visual or conceptual stimulus. Unless a perception is emotionally encoded it will not be rationally useful (Damasio, 1994). This means that the emoti-ve experiences come to the fore to set the context inside which the rational interpretation takes place. Thus, brand images are conceptual, rational, and emotional reactions (i.e., perceptions or subjective evaluations) based on emotions and evaluations. Therefore, judgments (such as perceived quality1) and feelings should be included in the brand image asset, and should not be
considered independent, as they represent perceptions of how the brand performs and are also conceptual reactions to previous experiences (direct or indirect) as well as to received informa-tion. Moreover, if we assume brand equity as consumers' overall evaluation of a brand, whether good or bad (Mitchell & Olson, 1981), then it is suggested that the concepts of brand image and brand attitude describe the same phenomenon, since brand image is already an evaluation per se, making both concepts redundant.
Although Aaker (1991) and Keller (2003) presented brand loyalty as a component of brand equity, in practice other researchers see it as a variable determined by brand awareness, brand image, and/or perceived quality (e.g., Brunner, Stocklin & Opwis, 2008; Lai, Griffin & Babin, 2008). In this work brand loyalty is analyzed as a brand asset that composes the consumer-based brand equity model, since it is an outcome of the branding activities that can express the power of a brand in a consumer.
The last component (brand relationship) of the suggested brand equity model aims to embrace a more holistic point of view of brand equity construction by considering the influence of brand participation on SNS in the brand-consumer relation at an individual level. By taking into accou-nt the type of relation that a consumer has with the brand and how this relation impacts brand equity, we can gain a better picture of how a brand is perceived. Moreover, considering brand relationship on brand equity measurement allows managers to interpret marketing accountability in the long-term, reinforcing the strategic discipline that marketing is, and not only the tactical. In this study, the concept of relationship is analyzed and measured from two perspectives: from a dyad level (brand/consumer), and from a triad level (brand/consumer/consumer social net-work), whereas the first impacts the second.
In the first case, the focus of brand relationship is on the tendency of a consumer to actively search for extra information about a brand or the associated company, to engage with it, and to contribute to the brand development whenever possible. Here customer service, such as loyalty programs, special treatment, affinity programs, community-building programs, and
knowledge-1 By perceived quality it is understood the customer’s perception of overall quality or superiority of a
pro-duct or service with respect to its intended purpose and as an intangible, overall feeling about the brand (Aaker, 1991; Keller, 2003). In this sense, perceived quality can be understood as a functional benefit association.
building programs, as well as brand communities, play an important role, since they may incre-ment the level of engageincre-ment, i.e., «behaviors that go beyond simple transactions, and may be specifically defined as a customer’s behavioral manifestations that have a brand focus, beyond purchase, resulting from motivational drivers» (van Doorn et al., 2010, p. 254).
In the second type of relationship, the focus is on the measurement of the strength of the brand relationship and how it is extrapolated to the individual social interaction sphere through advo-cation. In other words, if brand relationship is strong at the first level it can be transferred from an individual and personal relation to an open and exposed relation, whereas the consumer becomes the brand ambassador and ultimately can affect other’ people’s brands perceptions, specifically affecting positively or favoring a brand in the information distribution and in the buying decisions of the social network. One possible way to measure this perspective will be defining the share of voice of a brand from a particular individual towards his social network over a defined period of time. This share of voice measurement represents the percentage of brand «advocativeness» a brand receives in relation to other brands from the same category, considering that this measurement is more likely to be affected by personal characteristics, than from loyalty levels, or buying behavior. However, the fact that this analysis is done at an indivi-dual level jeopardizes the feasibility of the task due to the expected high costs.
It is worth mentioning that this study does not aim to be exhaustive, as the referral brand assets are complex phenomena with countless effects on consumer behavior. The main objective is to identify some of these effects by focusing on specific points rather than presenting a comprehen-sive model, which would be unrealistic in view of the complexity of the issue.
3. FIELD WORK AND DATA ANALYSIS
In order to operationalize the suggested consumer-based brand equity model and assess the impact of brand participation on SNS on brand equity a scale was developed and applied to a popular brand from the soft drinks’ category was analyzed. Some of the suggested items of the identified constructs to study customer-based brand equity have their roots on previous work (Aaker & Joachimsthaler, 2000; Keller, 2003), others are simply new to the literature.
The questionnaire survey was chosen as the main data collection instrument, since this method enables researchers to examine and explain relationships between constructs, in particular cau-se-and-effect relationships. The suggested scale is composed with 32 items (questions). Brand awareness is measured with two polar questions. Brand image is measured by taking into account brand performance and brand imagery (each with 3 items), brand judgments (with 6 items), and brand feelings (with 3 items). Brand loyalty is measured with 4 questions. And brand relationship is measured through brand attachment (4 items), brand engagement (3 items) and brand advocation (4 items). The two first questions were treated as a polar question (no/ yes), while a five-point Likert scale (1 – strongly disagree; 5 - strongly agree) was used to capture the respondents’ answers for the following questions. The questionnaire format applied during the investigation is attached (Table 1).
From an industrial perspective, according to research conducted by Ittner & Larcker (2003), at least 70 per cent of organizations employ metrics to assess brand equity that lack statistical validity. Therefore, this survey was developed with the goal of being a simple, valid and
par-simonious paper-and-pencil measurement scale (not involving complex statistical modeling) of consumer-based brand equity (CBBE) through its constituent dimensions. Finally, the survey can be applied on various product fields, from business-to-business to consumption market, since the items that compose the scale (with the exception of one) aim to measure consumer perceptions at an abstract level (not specifically to a product and industry-class) and at an individual level, allowing the researcher to assess which areas and sub-areas need to be improved or not. Due to difficulties involved in comparing the equity results of a brand before and after using a specific SNS, this study assesses how differently brand consumers that follow a brand’s activity on a SNS perceive the equity of the brand in comparison to consumers that do not follow it. The SNS chosen was Facebook and three groups of consumers were identified: consumers that follow the brand on Facebook, consumers that use Facebook but do not follow the brand, and consumers that do not use Facebook. All the answers of non-consumers of the analyzed brand were excluded.
The survey starts with an introduction and an opening question (interesting, simple, and nonthrea-tening) that introduces the topic and attempts to gain the cooperation of the respondents. Possi-bly difficult, sensitive, or complex questions were placed late in the sequence. The words used in the survey were also chosen carefully, giving preference to ordinary, non-technical words. In order to generalize the results and the application of the same methodology (survey) to diffe-rent samples with the same profile, validation and reliability become crucial factors (Freitas et al., 1998a, b; Straub, 1989). As a result, the content was validated, and the reliability of the survey was assessed using statistical methods. Content validity evidence if the content of each item instrument assesses the topic proposed. The reliability coefficient is an indicator of the accuracy of the results observed in the sense of the degree of confidence and is estimated by empirical procedures (Brown, 2002).
Content validation was obtained by applying a pre-test, reviewed and validated by two acade-mic experts on branding and research methodology, which was administered to 30 university students, selected randomly. Since the survey was to be distributed online, the pretest was con-ducted using the same method. In the pre-test sample, all aspects of the questionnaire concerning the content, wording, sequence, form and layout, question difficulty, and instructions were asked about. The overall results show that the question content, wording, sequence, form and the layout were scored as good, and the questions were clear and simple, attesting to the content valida-tion of the survey in both languages.
To determine the internal consistency of the scale as an estimate of its reliability (the consistency with which a particular set of items of a given measure estimated latent construct or dimension), the coefficient of alpha for the five-point Likert questions and a K20 (a special case of Cronbach’s Alpha) to the polar question were used. The Cronbach's coefficient estimates the internal con-sistency of a set of items and the alpha varies from 0 to 1. The higher the count, the greater the reliability of the scale. A value of at least 0.7 reflects an acceptable reliability (Nunnaly, 1978). The results show that the coefficients reflect on acceptable reliability (0.925), establishing the understanding and considering the variability of items relevant to be interpretable.
Finally, the online survey was distributed to 500 undergraduate and graduate students through their email contacts. These students have previously had signed up on the SONA system of an
American university to participate in research projects. Their participation in this study was in-centivized by the possibility of winning a $25 Amazon gift card in a raffle.
4. RESULTS
A total of 361 students completed successfully the survey. 245 subjects were female, 116 males. The majority of subjects age was between 18-25 (176), 112 were 26-35 years old, 57 were 36-50 years old, and the rest 51 years old or more.
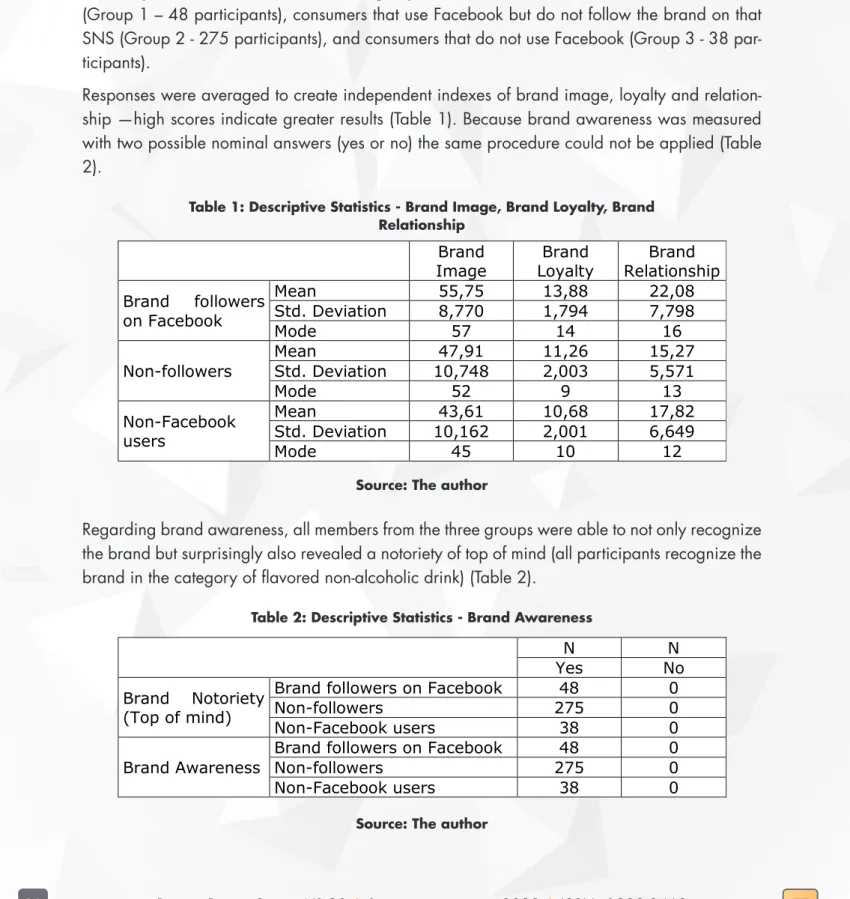
The sample was then divided into three groups: consumers and brand followers on Facebook (Group 1 – 48 participants), consumers that use Facebook but do not follow the brand on that SNS (Group 2 - 275 participants), and consumers that do not use Facebook (Group 3 - 38 par-ticipants).
Responses were averaged to create independent indexes of brand image, loyalty and relation-ship —high scores indicate greater results (Table 1). Because brand awareness was measured with two possible nominal answers (yes or no) the same procedure could not be applied (Table 2).
Table 1: Descriptive Statistics - Brand Image, Brand Loyalty, Brand Relationship
Brand
Image Loyalty Brand Relationship Brand Brand followers
on Facebook
Mean 55,75 13,88 22,08
Std. Deviation 8,770 1,794 7,798
Mode 57 14 16
Non-followers Mean Std. Deviation 10,748 47,91 11,26 2,003 15,27 5,571
Mode 52 9 13 Non-Facebook users Mean 43,61 10,68 17,82 Std. Deviation 10,162 2,001 6,649 Mode 45 10 12
Source: The author
Regarding brand awareness, all members from the three groups were able to not only recognize the brand but surprisingly also revealed a notoriety of top of mind (all participants recognize the brand in the category of flavored non-alcoholic drink) (Table 2).
Table 2: Descriptive Statistics - Brand Awareness
N N
Yes No
Brand Notoriety (Top of mind)
Brand followers on Facebook 48 0
Non-followers 275 0
Non-Facebook users 38 0
Brand Awareness Brand followers on Facebook Non-followers 275 48 0 0
Non-Facebook users 38 0
Overall, the descriptive findings revealed that brand followers show greater/better brand equity levels than the two other groups (except on brand awareness).
Due to the fact that not all groups have equal sample sizes, it was applied the Scheffe’ test to compare the mean ranks of the three groups. Surprisingly, the findings from Scheffe’ test suggest a statistically significant difference (p=0.000) between groups that follow the brand on Face-book and those that do not follow (because they chose not to do it or they do not use FaceFace-book) on brand image, brand loyalty and brand relationship. Moreover, no difference between the two groups that do not follow the brand on the mentioned SNS were found on the exact same variables (brand image, brand loyalty and brand relationship) (Table 3).
Table 3: Scheffe’ Test results Dependent
Variable (I) Groups (J) Groups Difference Mean (I-J)
Std.
Error Sig. 95% Confidence Interval Lower
Bound Bound Upper
Brand Image 1 2 3 12,1457,841** 1,635 2,269 ,000 ,000 3,82 6,57 11,86 17,72 2 1 3 -7,8414,304 * 1,635 1,808 ,000 ,060 -11,86 -,14 -3,82 8,75 3 1 2 -12,145-4,304 * 2,269 1,808 ,000 ,060 -17,72 -8,75 -6,57 ,14 Brand Loyalty 1 2 3 2,6133,191** ,309 ,429 ,000 ,000 1,85 2,14 3,37 4,25 2 1 3 -2,613,578 * ,309 ,342 ,000 ,242 -3,37 -,26 -1,85 1,42 3 1 2 -3,191-,578 * ,429 ,342 ,000 ,242 -4,25 -1,42 -2,14 ,26 Brand Relationship 1 2 6,811* ,943 ,000 4,49 9,13 3 4,268* 1,308 ,005 1,05 7,48 2 1 3 -6,811-2,543 * 1,043 ,943 ,000 ,052 -9,13 -5,11 -4,49 ,02 3 1 2 -4,2682,543 * 1,308 1,043 ,005 ,052 -7,48 -,02 -1,05 5,11 *. The mean difference is significant at the 0.05 level.
Note: 1 - Brand followers on Facebook; 2 - Non-followers; 3 - Non-Facebook users. Source: The author
5. CONCLUSIONS AND DISCUSSION
One of the purposes of this research project was to suggest a customer-based brand equity mo-del and its scale. This goal was achieved, and the proposed scale show an acceptable reliability (Cronbach alpha 0.925), establishing the understanding and considering the variability of items relevant to be interpretable.
The other purpose of this research project was to assess if and how differently brands are perceived when consumers are exposed to their participation on SNS and when they are not by understanding if brands’ participation on Facebook impacts its brand equity from a consumer perspective.
The findings revealed that brand followers showed better scores than the other two groups in brand image, brand loyalty, and brand relationship. The obtained findings also showed no statistically significant difference on brand awareness between groups, which could suggest a more conscious decision from non-followers to not follow the brand on Facebook, expressing an already possible less favorable perception of the brand. Moreover, findings revealed more di-fferences between the groups of brand-followers and non-followers on Facebook suggesting the existence of a positive impact of brands participation on Facebook on its brand equity results. Finally, this research also shows similarities on how the brand is perceived between the groups of non-followers of the brand on Facebook and non-users of that SNS.
These are important outcomes for marketing managers, who have been aiming to improve their sales numbers (Smith, Fisher & Yongjian, 2012), their loyalty rates (Erdogmus & Çiçek, 2012), or even to enhance a relational approach with their audience, through the use of online social networks.
It is not known if consumers that follow the brand’s profile on Facebook already had better per-ceptions about the brand compared with the other groups, or if their results were influenced after engaging with the brand in this online environment. In other words, it is not known if these results precede or are an outcome of following the brand on the analyzed website. Therefore, further research based on different methodology and capable of explaining the observed phenomenon that this research confirms (the direct cause-effect relation between positive brand equity and brands participation on social network sites) is welcome. Moreover, it would be interesting to analyze if the number of brands followed by a user on a SNS can influence the brand notoriety results as it was not found here.
One other important managerial and academic impact that can be drawn from this study is the proposed statistically validated scale that analyses the brand equity from a customer perspective and allows the separate assessment of different elements that compose the overall brand per-ception and attitude towards it. This consumer-based brand equity proposal model encompasses most of the accepted assumptions in the literature, while also adding new ones.
As with other studies, this one has some limitations that should be considered when analyzing and generalizing the results. Concerning the sample size, it was easier to find participants that consume the brand and do not follow any of the analyzed brands on Facebook than consumers that follow. For further validation of the developed scale it would be interesting to include larger sample. A different limitation is related to the brands category selection. It would seem reaso-nable that what makes a brand valuable in a business-to-business (B2B) context will differ from a business-to-consumer (B2C) context, so it would also be interesting to submit the same scale to other categories, specifically to the service industry and to B2B environments for further vali-dation of the scale. Finally, as it was mentioned in the beginning of this paper, the main goal of the suggested scale is to be simple and easily applied to any sample, in order to give an overall brand image result. Many other items can be added to the scale and it is highly recommended to do so (particularly in the brand loyalty construct) whenever a specific construct raises more in-terest to the researcher. Therefore, it is stressed that this model is not exhaustive in each construct analysis, which is why only 32 items were proposed.
6. REFERENCES
Aaker & Joachimsthaler (2000), Brand Leadership. London: Free Press. Aaker, D.A. (1996), Building Strong Brands. Free Press, New York, NY. Aaker, David A. (1991), Managing Brand Equity. New York: The Free Press.
Ambler, T. (1995), Building brand relationships. Financial Times Mastering Management Series, No. 6, pp. 8-11.
Ashley, C. & Tuten, T. (2015). Creative strategies in social media marketing: An exploratory study of branded social content and consumer engagement. Psychology & Marketing, 32(1), 15–27
Assael, Henry (1992), Consumer behavior and marketing action. Boston, MA: PWS-KENT Pu-blishing Company.
Barreto, A.M. (2014), The word-of-mouth phenomenon in the social media era, International Journal of Market Research, Vol. 56 No. 5, pp. 631-654.ISO 690.
Berry, Leonard (2000), Cultivating Service Brand Equity. Journal of the Academy of Marketing Science 28(1), pp.128-137.
Borle, S., Dholakia, U., Singh, S. & Durham, E. (2012). An empirical investigation of the impact of Facebook fan page participation on customer behavior, Marketing Science, 1-36.
Bovee, C.L., Thill, J.V., Dovel, G.P. & Wood, M.B. (1995), Advertising Excellence McGraw-Hill, New York, NY.
Brown, J. D. (2002), The Cronbach Alpha Reliability Estimate. Shiken: JALT Testing & Evaluation Sig Newsletter, ISSN 1881-5537, v. 6, n. 1, p. 12-15, Feb.
Bruhn, M., Schoenmueller, V. & Schäfer, D. B. (2012). Are social media replacing traditional media in terms of brand equity creation? Management Research Review, 35(9), 770-790. Brunner, T. A., Stocklin, M. & Opwis, K. (2008), Satisfaction, Image, and Loyalty: New versus Experience Customers. European Journal of Marketing, 42 (9/10): 1095-1105.
Chu, S.C. & Kim, Y. (2011), Determinants of consumer engagement in electronic word-of-mouth (eWOM) in social networking sites, International Journal of Advertising, Vol. 30 No. 1, pp. 47-75.
Cronin, J. J. Jr. & Taylor, S. A. (1992), Measuring Service Quality: A reexamination and exten-sion. Journal of Marketing, 56.
Damasio, Antonio (1994), Descartes' Error, Avon Books, New York.
De Chernatony, Leslie & Riley, Francesca Dall'Olmo (1999), Experts' views about defining servi-ces brands and the principles of serviservi-ces branding. Journal of Business Research 46.2: 181-192. Dichter, E. (1985), What's in an Image. Journal of Consumer Marketing, 2 (1, Winter): 75-81. DreamGrow (2018), «Top 15 most popular social networking sites and apps», available at: www.dreamgrow.com/top-15-most-popular-social-networking-sites/
eMarketer (2018), «Social networks’ video ad revenues balloon», available at: www.emarketer. com/content/us-social-video-ad-spending-will-reach-11-69-billion-by-2020
Engel, Blackwell & Miniard, (1995), Consumer Behavior. The Dryden Press, Harcourt Brace College Publishers.
Engel, J. F., Kollat, D. & Blackwell, R. D. (1982), Consumer behavior. New York: Dryden Press. In Anderson, Rolph E., & Srini S. Srinivasan. "E‐satisfaction and e‐loyalty: A contingency fra-mework." Psychology & Marketing 20.2 (2003): 123-138.
Erdo‐mu,. E. & Cicek, M. (2012). The impact of social media marketing on brand loyalty. Procedia-Social and Behavioral Sciences, 58, 1353-1360.
Erkan, I., Gokerik, M. & Acikgoz, F. (2019). The Impacts of Facebook Ads on Brand Image, Brand Awareness, and Brand Equity. In Handbook of Research on Entrepreneurship and Marke-ting for Global Reach in the Digital Economy (pp. 442-462). IGI Global.
Estrella-Ramón, A., García-de-Frutos, N., Ortega-Egea, J. M. & Segovia-López, C. (2019). How does marketers’ and users’ content on corporate facebook fan pages influence brand equity?. Electronic Commerce Research and Applications, 100867.
Fournier, Susan (1998), Consumers and their brands: developing relationship theory in consu-mer research. Journal of consuconsu-mer research 24.4: 343-353.
Freitas et al. (1998b), The Design Process of a Cross-Cultural Exploratory Quantitative - Qualita-tive Survey Research Project to Study the Decision-Making Process. Association for Information Systems Americas Conference 1998. Technology Research in Progress, v.14, n.16, p.944-946, Aug.
FREITAS, H. M., Zanela, A. C., Macadar, M. A., BECKER, J., MOSCAROLA, J. & Jenkins, M. (1998a), Quanti-Qualitative Instruments to Study the Decision-Making Process. WP ISRC No. 020298, Merrick School of Business, University of Baltimore, MD, EUA, Feb., p.29.
González, F. J. M., Lacoba, S. R., Mera, A. C. & Loureiro, S. M. C. (2015). Determinantes de la intención de uso de Facebook en el proceso de decisión de compra. Investigaciones europeas de dirección y economía de la empresa, 21(1), 26-34.
Grönroos, Christian (1994), From Marketing Mix to Relationship Marketing: Towards a Para-digm Shift in Marketing, Management Decision, Vol. 32 Iss: 2, pp.4 – 20.
Jones, T. & Sasser, E. W. (1995), Why Satisfied Customers Defect. Harvard Business Review. Keating, B., Rugimbana, R. & Quazi, A. (2003), Differentiating Between Service Quality and Relationship Quality in Cyberspace. Managing Service Quality, 13(3).
Keller, K, L, (1993), Conceptualizing, measuring, and managing customer-based brand equity. Marketing 57 (January) 1-22.
Klink, Richard R. & Smith, Daniel C. (2001), Threats to the external validity of brand extension research. Journal of Marketing Research: 326-335.
Knox, S. D. & Denison, T. J. (2000), Store Loyalty: Its Impact on Retail Revenue. An Empirical Study of Purchasing Behaviour in the UK. Journal of Retailing and Consumer Services, 7(1).
Konecnik, Maja & Gartner, William C. (2007), Customer-based brand equity for a destination. Annals of Tourism Research 34.2: 400-421.
Korchia, M. (1999), A New Typology of Brand Image, European Advances in Consumer Re-search, 4, 147-154
Lai, F., Griffin, M. & Babin, B. J. (2008), How Quality, Value, Image, and Satisfaction Create Loyalty at a Chinese Telecom. Journal of Business Research, 62 (10): 980-86.
Lemon, Katherine N, Rust, Roland T, Zeithaml & Valarie A (2001), What drives customer equity. Marketing Management. Chicago: Spring. Vol. 10, Iss. 1.
Lynch, J., Ariely, D. (2000), Wine Online: Search Costs Affect Competition on Price Quality and Distribution. Marketing Science, 19(1).
McCarthy, Michael S., Heath, Timothy B. & Milberg, Sandra J. (2001), New Brands Versus Brand Extensions, Attitudes Versus Choice: Experimental Evidence for Theory and Practice. Mar-keting Letters 12 (1): 75-90.
Mitchell, Andrew A. & Olson, Jerry C. (1981), Are product attribute beliefs the only mediator of advertising effects on brand attitude? Journal of Marketing Research. 18(August), 318-332. Moutinho, L. & Santos J.P. (2009), Neuroscience in Marketing: Empirical Evidence of Social and Emotional Meanings Conveyed by Brands. Presentation at the 5th Thought Leaders International Conference on Brand Management, Athens. MSI (2008), Research Priorities: Guide to MSI Re-search Programs and Procedures, Marketing Science Institute, MA, available at: www.msi.org/ pdf/MSI_RP08-10.pdf (accessed 2 October 2008).
Newman, J. W., Werbel, R. A. (1973), Multivariate Analysis of Brand Loyalty for Major House-hold Appliances. Journal of Marketing Research, 10.
Newman, J.W. (1957), New Insight, New Progress, for Marketing. Harvard Business Review, November-December: 95-102.
Oliver, Richard L. (1999), Whence consumer loyalty? Journal of Marketing: 33-44.
Peters, K., Chen, Y., Kaplan, A.M., Ognibeni, B. & Pauwels, K. (2012). Social media metrics – A framework and guidelines for managing social media. Journal of Interactive Marketing, 27(4), 281–298.
Prasad, Keshav & Dev, C. S. (2000), Managing hotel brand equity: a customer-centric framework for assessing performance. Cornell Hotel and Restaurant Administration Quarterly 41.3: 22-31. Quartz, S. & Asp, A. (2005), Brain Branding: Brands on the Brain. ESOMAR Annual Congress, Cannes.
Roselius, Ted. (1971), Consumer rankings of risk reduction methods. The Journal of Marketing: 56-61.
Santos, J. R. A. (1999), Alfa de Cronbach: Uma ferramenta para avaliar a confiabilidade das escalas. Journal of Extension. ISSN 1077-5315, EUA, v.37, n.2, Apr.
Schulze, C., Schöler, L., & Skiera, B. (2015). Customizing social media marketing. MIT Sloan Management Review, 56(2), 8–10.
Smith, A. N., Fischer, E. & Yongjian, C. (2012). How does brand-related user-generated content differ across YouTube, Facebook, and Twitter? Journal of Interactive Marketing, 26(2), 102-113. Srinivasan, V., Park, Chan Su & Chang, Dae Ryun (2005), An approach to the measurement, analysis, and prediction of brand equity and its sources. Management Science 51.9: 1433-1448.
Straub, D. W. (1989), Validating Instrument in MIS Research. MIS Quarterly, University of Min-nesota, v.13, n.2, p.147-169, Jun.
Triantafillidou, A. & Siomkos, G. (2018). The impact of Facebook experience on consumers’ behavioral Brand engagement. Journal of Research in Interactive Marketing, 12(2), 164-192. van Doorn, J., Lemon, K.N., Mittal, V., Nass, S., Doreen, P., Pirner, P. & Verhoef, P.C. (2010), Customer engagement behavior: theoretical foundations and research directions, Journal of Ser-vice Research, Vol. 13 No. 3, pp. 252-266.
Waddell, H. (1995), Getting a Straight Answer. Marketing Research, 7.
Woodside, A. G., Frey, L. L. & Daly, R. T. (1989), Linking service quality, customer satisfaction, and behavioral intention. Journal of Health Care Marketing, 9.
Yi, Y., La, S. (2004), What influences the relationship between customer satisfaction and repur-chase intention? Investigating the effects of adjusted expectations and customer loyalty. Psycho-logy & Marketing, 21(5).
Yoon, Gutchess, Feinberg & Polk (2006), A Functional Magnetic Resonance Imaging Study of Neural Dissociations between Brand and Person Judgments. Journal of Consumer Research, vol 33.
7. ATTATCHMENT
Table 1: Scale constructs and items
Constructs Items
Brand Awareness a) What brands of flavored non-alcoholic drinks can you think of?
b) Do you know this brand?
Brand Image Performance c) I consider this brand as a relevant option d) I like the look, design of the brand
e) Compared with other brands in the same category, I like the price
Imagery f) The brand is social responsible g) The brand brings me good memories h) People I admire and respect use this brand Judgments i) I like the taste/quality of the brand
j) The brand is better than others of the same category
k The brand takes my interests in mind l) The brand is unique
m) I am satisfied with the brand n) I trust this brand
Feelings o) I like the brand
p) The brand gives me the feeling of social approval
q) The brand gives me the feeling of security – no risks associated with consumption
Brand Loyalty r) I frequently consume this drink
s) I consume this brand because I have not had the opportunity to look for an alternative
t) I prefer this brand although there are other equally good brands
u) If I don’t find this brand, I’ll go to another place to buy it
Brand
Relationship Attachment v) I’m proud to have others know I use this brand w) The brand is more than a product to me x) I identify with the brand
y) I feel strongly connected with others who use this brand
Engagement z) I’m always interested in learning more about this brand
aa) I add "likes" on the brand’s Facebook page bb) I add comments on the brand’s Facebook page
Advocation cc) I would recommend the brand to others dd) I talk about this brand to others in my person-to-person contacts
ee) I talk about this brand to others in my online interactions
ff) I share the brand’s posts on my Facebook page