MASTER
FINANCE AND TAXATION
Confidence Indicators and Economic
Cycles in Euro Area and Portugal
Joel Casimiro Resende Alves
CONFIDENCE INDICATORS AND ECONOMIC CYCLES IN EURO AREA AND PORTUGAL
Joel Casimiro Resende Alves
Dissertation
Master in Finance and Taxation
Supervised by
António de Melo da Costa Cerqueira Elísio Fernando Moreira Brandão
ii
Acknowledgements
To professor António Cerqueira: for showing availability and giving me valuable advices to conclude my dissertation.
To professor Elísio Brandão: for the continuous and succeeded efforts in making our Master in Finance and Taxation a reputable course both nationally and internationally, which then helps its students in the labor market integration.
To FEP and all my professors: for contributing to build my knowledge and professional identity in economy, management, finance and taxation areas.
To my family: for providing the structure and support that made possible reaching this goal.
To Sofia: for leading me to rediscover the person who was always here, a person that, 5 years after starting a path in FEP, knows way better what he desires professionally; for being always present with guidance, patience and, most of all, love.
iii
Abstract
The main focus of this work is to determine the relationship between the confidence of economic agents, measured by the Economic Sentiment Indicator (ESI), Consumer Confidence Indicator (CCI) or Business Confidence Indicator (BCI), and the evolution of economic cycles in Euro Area as well as specifically in Portugal. A Structural Vector Autoregression (SVAR) model is used, which conjugates confidence indicators and macroeconomic variables. It is observed that fluctuations in confidence have significant impact in economic activity.
Keywords: Confidence, Economic Sentiment Index, Economic cycles, Structural Vector
iv
Resumo
O objetivo principal deste trabalho é determinar a relação entre a confiança dos agentes económicos, medida pelo Economic Sentiment Indicator (ESI), Consumer Confidence Indicator (CCI) ou Business Confidence Indicator (BCI), e a evolução dos ciclos económicos na Zona Euro, bem como no caso específico de Portugal. Um modelo Structural Vector Autoregression (SVAR) é usado, conjugando indicadores de confiança e variáveis macroeconómicas. Observa-se que variações na confiança têm um impacto significativo na atividade económica.
Palavras-chave: Confiança, Economic Sentiment Index, Ciclos económicos, Structural
v
Index
Acknowledgements ... ii Abstract ... iii Resumo ... iv Index of Tables ... viIndex of Figures ... vii
Introduction ... 1
Related Studies and Hypotheses Development ... 4
Methodology and Sample ... 8
Results ...14
Conclusion ...21
vi
Index of Tables
Table 1 – Variables covered in the monthly business and consumer surveys ... 8
Table 2 – Variables and data sources ...13
Table 3 – Granger causality test ...14
vii
Index of Figures
Figure 1 – Euro Area: Consumption growth and change in confidence ... 5 Figure 2 – Euro Area: Absolute forecast errors ... 6 Figure 3 – Weights of different indicators used to build ESI ... 9 Figure 4 - Performance of the standardized indicators ESI, CCI and BCI in Portugal and in the Euro Area ...10 Figure 5A - Responses of confidence variables and Industrial Production to a shock to the different confidence variables - Euro Area data ...15 Figure 5B - Responses of confidence variables and Industrial Production to a shock to the different confidence variables -Portugal data ...17 Figure 6A - Responses of confidence variables and Harmonized Unemployment Rate to a shock to the different confidence variables - Euro Area data ...18 Figure 6B - Responses of confidence variables and Harmonized Unemployment Rate to a shock to the different confidence variables - Portugal data ...19
1
Introduction
The effects of the financial crisis of 2008 are still very present in the minds of several consumers, producers and policy makers. During the deterioration of economic conditions, there was a quick global decline in confidence amongst economic agents, as it can be seen in data related with confidence indicators (OCDE, 2019; European Commission, 2019).
The main purpose of this is work is to analyze the importance of confidence, namely via indicators usually adopted to measure it, for the variation of economic activity in Euro Area and also specifically in Portugal.
In terms of relevance of the investigation, its conclusions support the potential use of a broader range of variables, particularly by associating confidence indicators with more commonly used macroeconomic inputs, to help determine future fluctuations in business cycles. This research also emphasizes the importance of an initial analysis by financial regulators and governments of the possible impacts of policies that can influence economic confidence.
One of the main researches influencing this study is “The role of confidence in the evolution of the Spanish economy: empirical evidence from an ARDL model”, by Castellanos-Garcia et al. (2014), where the relationship between several macroeconomic variables and Economic Sentiment Indicator (ESI), which is a composite indicator made up of five sectoral confidence indicators, is tested in Spain. It is observed that unemployment varies inversely with ESI, which means that less confidence implies a higher unemployment rate. The authors also argue that confidence indicators should be included in predictive models for economic activity to improve their reliability.
Dees and Soares-Brinca (2011) empirically evaluate the association between consumer confidence and private consumption, both in USA and Euro Area. It is shown that a consumer confidence indicator is a good predictor of private consumption, which is an important GDP component.
According to Christiansen et al. (2014), variables related with the sentiment of economic agents, tested with 150 other macroeconomic variables and other usual recession predictors, improve the performance of recession prediction models. The authors’ work shows that indicators related with the confidence of producers should be more reliable to predict fluctuations in economic activity than those associated with the confidence of consumers.
2 In terms of methodology, the addition of survey and expectation data into Structural Vector Autoregression (SVAR) models is in line with the research of Leduc and Sill (2012) and Barsky and Sims (2012), which also provide evidence of the relevance of economic expectations for business cycles fluctuations.
In this investigation, it is examined if shocks to the ESI, Consumer Confidence Indicator (CCI) or Business Confidence Indicator (BCI) are relevant to explain variation in economic activity, measured via Industrial Production (as in Hamilton, 2018) and Unemployment Rate (as in Castellanos-Garcia et al., 2014). Overall, results show that confidence indicators do account for significant fluctuations in business cycles, both in the Euro Area as a whole and in Portugal. Furthermore, it is tested if BCI is more significant than CCI to explain those fluctuations. There isn’t, however, enough evidence to support that hypothesis.
The main contributes of this work to the existing literature are to show the relationship between several confidence indicators (both composite – ESI – and simple – CCI and BCI) and business cycles in Euro Area, as well as to test the potential difference in effects between ICI and CCI in the same geographical context and in Portugal specifically.
It is worth noting that although this investigation is fundamentally a macroeconomic study, I believe that the theme is very pertinent in the context of my Master in Finance and Taxation, because of the way Macroeconomics and Finance are indissociable and work together. Further study and knowledge of economic cycles can be an invaluable advantage when, for example, investment decisions are to be made. According to McGee (2015), the absolute and relative performance of different asset classes is consistently associated with macroeconomic trends. In his book Applied Financial
Macroeconomics and Investment Strategy, the author investigates investment implications using
real-world examples linking economic dynamics to investment outcomes. Also because I am presently involved in professional activity related with financial markets in a banking institution, it is readily apparent to me that, however small that advantage may be, it may represent an investment decision with better returns. Thus, I intend to explore the predictive potential of models linked to macroeconomic performance, and may, in potential later investigations, study investment strategies associated with the predictions of these same models. It is also my intention, after having a better and deeper understanding of all the potential of SVAR, to further complexify the models with the introduction of financial variables such as stock returns and also fiscal policy shocks.
3 The remainder of the document proceeds as follows: ‘‘Related Studies and Hypotheses Development’’ section reviews the relevant literature and develops the hypotheses; ‘‘Methodology and Sample’’ section presents the methodology and describes the sample; ‘‘Results’’ section discusses the results with detail; and ‘‘Conclusion’’ section presents the most important conclusions of this research.
4
Related Studies and Hypotheses Development
The discussion of confidence and its influence on economics dates back to Pigou (1927) and Keynes (1936). In the latter case, the main question that is raised in "The General Theory of Employment, Interest and Currency" is how full employment and a stable economy can be secured in a society with a capitalist economy. Its well-known response is that the state must intervene in order to increase demand and mobilize investment in order to increase productivity. This is where the construct of confidence comes in, whose role, according to Keynes, is crucial, to overcome the uncertainty that inevitably makes part of the decision to invest. The author argues that investments cannot only be made on the basis of rational considerations - they also involve confidence.
More recently, Farmer (1999) associates the concept of confidence with the theory of self-fulfilling prophecy. It is argued that the fact that if economic conditions show minor signs of slowdown, it may lead to a slight decrease in consumer and investor confidence, for fear that the deterioration of the economy will worsen. The fact that there is (initially) slight fear may lead to less consumption and investment, making the economy slow down more than it would happen if the behavior of economic agents, previous to the recognition of the slowdown, was maintained. Consequently, the "prophecy" of these agents will end up happening, and even more aggravated, due to their own (self-fulfilling) behavior. If we take as an example the recent financial crisis of 2008, the above question is very noticeable. There was a gradual deterioration of confidence that eventually contributed to the later Sovereign Debt Crisis - Portugal was one of the most affected countries. The extension in time of an economically fragile situation led to an even greater shock in the confidence of the economic agents, which made it difficult to exit the crisis and revert the economic cycle.
One of the most influential studies of my research is “The role of confidence in the evolution of the Spanish economy: empirical evidence from an ARDL model” (Cas-tellanos-García et al., 2014). In this article it is tested the relationship between the ESI confidence indicator and some macroeconomic variables in Spain, using an Autoregres-sive-Distributed Lag (ARDL) model, defining unemployment as a dependent variable rep-resentative of the state of the economy. Through Granger causality tests, a causal relation-ship between confidence and unemployment is also found. In the main conclusions of the study, it is observed that unemployment varies inversely with the ESI, both in the short term and in the long term. Thus, the lower the confidence, the higher unemployment will
5 tend to be. This does not mean that the behavior of the unemployment rate is fully ex-plained by the confidence of economic agents, but it emphasizes the importance of this qualitative variable in terms of job creation. The relevance of the inclusion of confidence indicators in the predictive models of economic fluctuations is advocated, to increase their reliability.
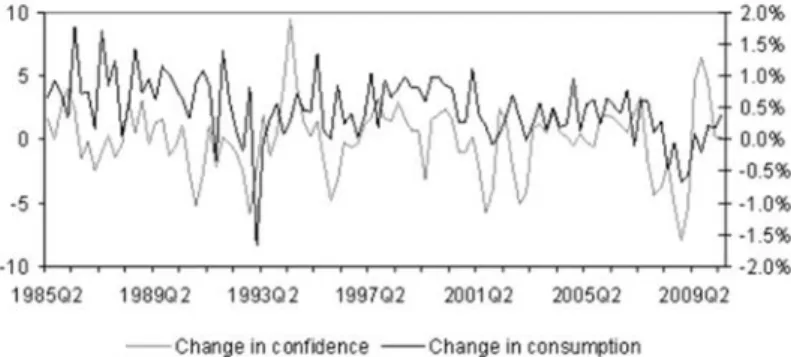
In another article, Dees and Soares-Brinca (2013) empirically assess the link between consumer sentiment and consumption expenditure, in the US and the Euro Area. It is demonstrated that indicators of consumer confidence can be good predictors of private consumption, which is one of the components of GDP. By observing Figure 1, it is possible to observe that some of the consumption peaks are preceded by peaks, in the same direction, of confidence, which indicates that the latter can help explain, in advance, variations of an important economic indicator.
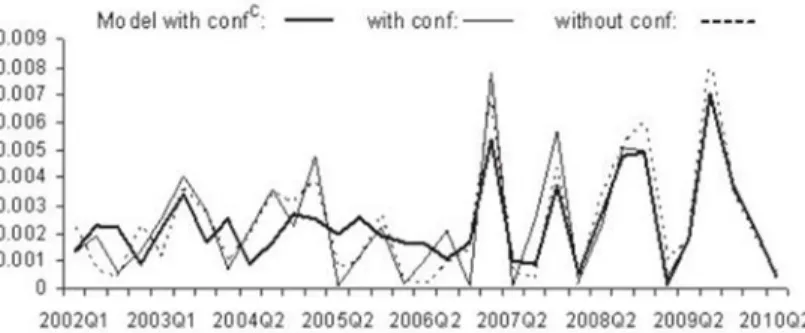
The authors also argue that the predictive capability of the models improves considerably when there are major changes in the confidence indicator, which tends to occur in periods of greater political or economic instability. Observing Figure 2, it is noticeable that when models do not include variables associated with confidence (dashed line), there is a tendency to observe more significant errors than when these variables are included. The differences are accentuated in more troubled for the economy.
Figure 1 - Euro Area: Consumption growth and change in confidence
Source: Dees, S. and Soares-Brinca, P. (2013), Consumer confidence as a predictor of consump-tion spending: Evidence for the United States and the euro area. International Economics.
6 It is also concluded that future research should focus on the use of subcomponents of aggregate confidence indexes. This idea led me to the intention of studying effects of both CCI and BCI, besides testing the composite indicator ESI. The investigators also state that it would be interesting to verify whether the conclusions at the Euro Area level are confirmed at the level of the different countries, since, for example, their results con-trasted with those found by Al-Eyd et al. (2008), who did not find consumer confidence to be a good predictor for consumption for the three largest euro area countries (Germany, Italy and France).
By combining survey data of unemployment rate expectations from alternative surveys for the US, Leduc and Sill (2012) model a Structural Vector Autoregression (SVAR) that includes actual unemployment rate, inflation and the 3-month Treasury Bill rate. They demonstrate that shocks in unemployment rate expectations significantly influence current economic fluctuations. Likewise, Barsky and Sims (2012) calculate a VAR model where they use GDP, real consumption and survey data from the US, to separate the causal effect of animal spirits (sentiment) on economic activity from fundamental information about future business cycles. They find that changes in the confidence indicators have important real effects. Following the research of these authors, Mendicino and Punzi (2013) estimated a SVAR to identify the effects of confidence shocks in Portugal and conclude that they account for a non-negligible fraction of variation in economic activity. Lambertini et al. (2013) further demonstrate that unexpected variations in forward-looking variables from the University of Michigan Survey of Consumers affect housing market dynamics and aggregate fluctuations.
Also noteworthy is the work of Taylor and McNabb (2007), who argue that their results indicate that both consumer and producer confidence indicators are procyclical and play a significant role in forecasting the start of negative phases of the business cycle.
Figure 2 - Euro Area: Absolute forecast errors
Source: Dees, S. and Soares-Brinca, P. (2013), Consumer confidence as a predictor of consump-tion spending: Evidence for the United States and the euro area. International Economics.
7 Therefore, it is predicted that shocks to ESI, CCI and BCI impact economic activity, which is measured via Industrial Production (as in Hamilton, 2018) and Unemployment Rate (as in Castellanos-Garcia et al., 2014).
The formulation of the first hypothesis is as follows:
Hipothesis 1 (H1): Confidence indicators are positively associated with economic
activity (therefore, positively associated with Industrial Production and negatively associ-ated with Unemployment Rate)
As mentioned before, Dees and Soares-Brinca (2013) highlight the importance of examining not only aggregate confidence indexes, but also indicators related with the confidence of distinct groups of economic agents, such as consumers and investors, so that the conclusions could be more precise about the importance of perceptions of each group.
Christiansen et al. (2014) argue that variables related with the sentiment of economic agents demonstrate good ability to predict recessions in the US. It is noted that when the aforementioned variables are tested along with more than 150 other macroeconomic variables or with other usual predictors of crisis (10 year spread, principal interest rate, stock market index return), the predictive power of the models increases. One of the main contributions to the current research is the idea that the variables linked to the economic sentiment of producers should have a better predictive capacity than those of consumers. The authors conjecture that news related to key economic indicators - fundamental news - play a central role in the predictive potential of confidence. By examining consumer confidence as well as business confidence, they point out that the latter is a stronger predictor of recessions. This fact suggests that the professionals will be better than individual consumers in the processing of fundamental news about the state of the economy, so their confidence indicators are expected to have greater predictive power. This conclusion reinforced my intention of studying CCI and BCI independently and led me to hypothesize that the latter may have better explanatory performance for economic activity than the first one.
The formulation of the second hypothesis is as follows:
Hipothesis 2 (H2): Shocks to BCI have bigger influence in economic activity than
8
Methodology and Sample
Data from monthly business and consumer surveys of the European Commission is used in this investigation.
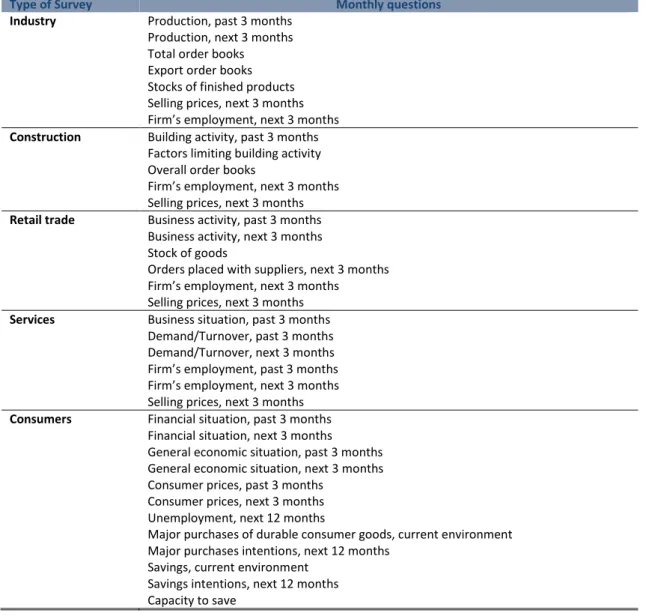
For the estimation of the Economic Sentiment Indicator (ESI) by the European Commission, business and consumer surveys, which are mostly qualitative, provide monthly judgements and anticipations concerning diverse facets of economic activity in the different sectors of the economy: industry, services, construction, retail trade and consumers (see Table 1 for a list of variables covered in the monthly business and consumer surveys).
Type of Survey Monthly questions
Industry Production, past 3 months Production, next 3 months Total order books Export order books Stocks of finished products Selling prices, next 3 months Firm’s employment, next 3 months Construction Building activity, past 3 months
Factors limiting building activity Overall order books
Firm’s employment, next 3 months Selling prices, next 3 months Retail trade Business activity, past 3 months
Business activity, next 3 months Stock of goods
Orders placed with suppliers, next 3 months Firm’s employment, next 3 months Selling prices, next 3 months Services Business situation, past 3 months
Demand/Turnover, past 3 months Demand/Turnover, next 3 months Firm’s employment, past 3 months Firm’s employment, next 3 months Selling prices, next 3 months Consumers Financial situation, past 3 months
Financial situation, next 3 months
General economic situation, past 3 months General economic situation, next 3 months Consumer prices, past 3 months
Consumer prices, next 3 months Unemployment, next 12 months
Major purchases of durable consumer goods, current environment Major purchases intentions, next 12 months
Savings, current environment Savings intentions, next 12 months Capacity to save
Table 1 - Variables covered in the monthly business and consumer surveys Source: European Commission
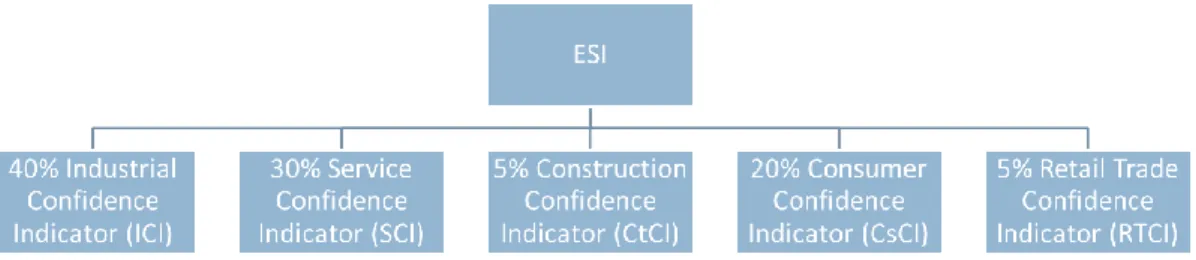
9 Survey variables report the results aggregated in the form of seasonally adjusted “balances” of the difference between the percentage of respondents giving positive and negative replies. For each of the five surveyed sectors, so-called confidence indicators are produced to reflect overall perceptions and expectations at the individual sector level in a one-dimensional index. After, in order to be able to track overall economic sentiment, the broader ESI has been calculated since 1985, summarizing developments in all five surveyed sectors. Explicit weights are allocated to the different sectors for the computation of the composite indicator (see Figure 3). The weights reflect the representativeness of the sectors and the performance with respect to GDP growth. As a result of a standardization process, the long term average of the indicator is 100.
The Consumer Confidence Indicator (CCI) is the arithmetic average of the balances of the answers to the questions on the past and expected financial situation of households, the expected general economic situation and the intentions to make major purchases over the next 12 months. The Business Confidence Indicator (BCI) is calculated in order to receive a timely indicator for the manufacturing sector in the euro area. The indicator uses, as input series, five balances of opinion from the industry survey: production trends in recent months, order books, export order books, stocks and production expectations.
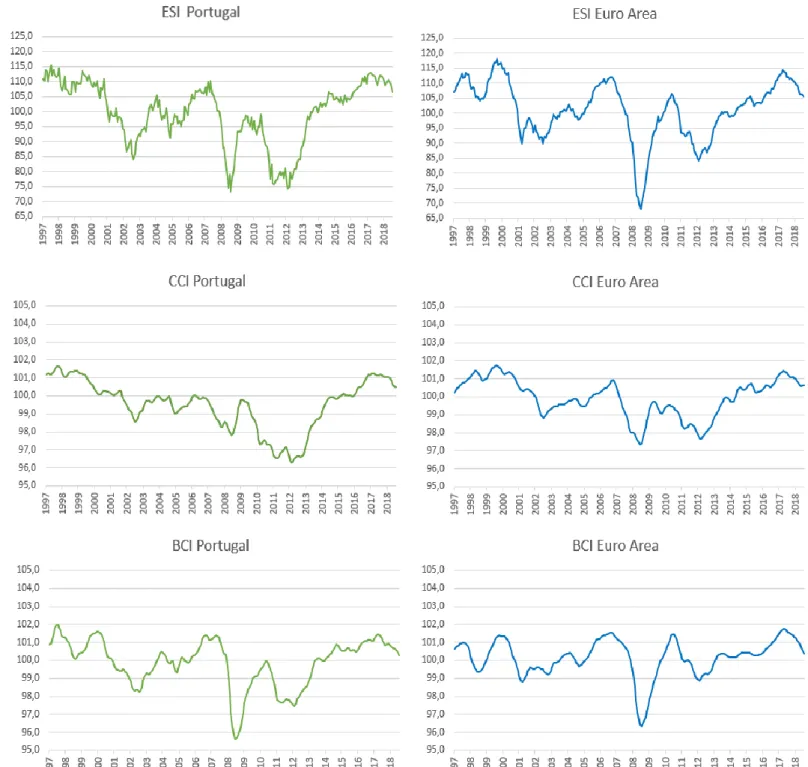
The OECD has implemented a standardization process for both the CCI and BCI in order to achieve comparability of confidence indicators across countries and business cycles phases. As a result, all the three series of confidence indicators have a long term average of 100. Values greater than 100 indicate an above-average economic sentiment, whereas values below 100 indicate a below-average position. In Figure 4, the performance of these standardized indicators can be observed.
Figure 3 - Weights of different indicators used to build ESI Source: European Commission
10 Vector autoregression (VAR) has become one of the main models for macroeconomic forecasting. The initial use in economics was largely motived by Sims (1980) critique of the “incredible restrictions” used by the large macroeconometric models developed in the 1970s and much effort was put into tools for policy analysis based on
Figure 4 - Performance of the standardized indicators ESI, CCI and BCI in Portugal and in the Euro Area Source: European Commision and OECD
11 VAR models. The role of the VAR model as the baseline, serious, model for economic forecasting is unchallenged. The popularity arises from its relative simplicity, flexibility, ability to fit the data and also from its success as a forecasting device (Karlsson, 2013).
A VAR is the generalization of the univariate autoregressive model to a vector of economic variables. An n-variable vector autoregression of order p, VAR(p ), is a system of n linear equations, with each equation describing the dynamics of one variable as a linear function of the previous p lags of every variable in the system, including its own p lags.
Following the methodology of Leduc and Sill (2013) and Mendicino and Punzi (2013) a baseline VAR model is initially estimated:
Yt is the vector of endogenous variables, A0 is the matrix of contemporaneous
interaction, A(L) is a matrix polynomial in the lag operator L and εt is the vector of
structural shocks with covariance matrix ∑. Besides including each confidence variable at a time, the baseline VAR model adds three endogenous variables: Industrial Production or Unemployment Rate as measures of economic activity, the CPI Inflation Rate and the Nominal Interest Rate (a characterization of the variables can be seen in Table 4). The model is estimated based on monthly data over the sample period of September 1997 to March 2019, which means there are 259 observations for each variable both for the Euro Area and Portugal.
As recommended by Muntaz and Rummel (2015), the appropriate number of lags for each model specification is initially tested using several criteria (AIC, SC and HQ). If the lag length is too short, the estimates may be inconsistent, which can result in an inability to capture important dynamics in the data, while too many lags can result in imprecise estimates in small and moderate samples. Therefore, increasing the number of lags improves the fit but decreases the degrees of freedom and amplifies the danger of over-fitting. An objective approach to decide between these competing objectives is to maximise a weighted measure of these two parameters, which is what the three abovementioned criteria intend to accomplish. If it is found that there is autocorrelation (analyzed with the Autocorrelation LM test) for the chosen lag-length, one ought to increase the lag-length of the VAR until the issue disappears. Stability was also tested by evaluating the roots of the characteristic polynomial of the VAR.
12 From an economic point of view, if the joint dynamics of a set of variables can be represented by a VAR model, then the structural form (SVAR) is an illustration of the underlying economic relationships. Economic theory can sometimes tell us something about the structure of the system we wish to estimate. We must convert these structural or theoretical assumptions into appropriate restrictions on the SVAR.
Since the responses from the monthly surveys are collected in the first two-three weeks of each month and sent to the European Commission by the end of the reference month, when the survey is filled in the respondents do not know the unemployment rate and industrial production of the same month. For instance, up to the first two weeks of February the respondents in Portugal know the unemployment rate and industrial production of December and the CPI of January. This timing is consistent with the use of a recursive (i.e. Cholesky) identification scheme that orders the confidence variable first, as in Leduc and Sill (2013) and Mendicino and Punzi (2013). Therefore, no contemporaneous response of the confidence variable to shocks to the other variables in the system is presumed. That assumption is implemented by specifying the matrix A0-1 as
the lower triangular Cholesky decomposition of the covariance matrix ∑, which results in A also being lower triangular – the zeros on the upper part of the matrix work as restrictions, identifying the SVAR model. After the confidence variable, the ordering of economic activity, inflation, and the interest rate is standard from the monetary transmission literature (Christiano et al., 1997). Changes in expectations about future economic activity are a significant driver of economic fluctuations: the notion that good times are ahead usually leads to a significant rise in current measures of real economic activity and inflation. As a result, the short-term interest rate rises as monetary policy tightens.
Two important outputs from VARs are the impulse response function (IRF) and the forecast error variance decomposition (FEVD). While impulse response functions trace the effect of a shock to one endogenous variable onto the other variables in the VAR, forecast error variance decompositions (or variance decompositions in short) tells us the proportion of the movements in a variable due to its ‘own’ shock versus shocks to the other variables. In the current research, the intention is to track the outcome of a shock to the confidence variables onto the economic activity variables in the different specifications of the SVARs. Leduc and Sill (2013) mention a few examples of what could be shocks to expectations and therefore also shocks to economic confidence: new revelations about future economic developments, the possibility of future labor strikes, new technological
13 developments, preannounced monetary policy actions, etc. that are observed by respondents of the surveys, but that aren’t easy to appropriately capture in a small-scale VAR. With the FEVD, the objective is to verify which proportion of the movements of the economic activity variables is caused by shocks to the confidence variables.
Macro Series
• Industrial Production:Industrial production refers to the output of industrial establishments and covers sec-tors such as mining, manufacturing, electricity, gas and steam and air-conditioning. This indicator is measured in an index based on a reference period that expresses change in the volume of production output. Manufac-turing. 2015Y = 100. Source: OECD.
• Harmonized Unemployment Rate: Harmonized unemployment rates define the unemployed as people of working age who are without work, are available for work, and have taken specific steps to find work. The uniform application of this definition results in estimates of unemployment rates that are more internationally comparable than estimates based on national definitions of unemployment. This indicator is measured in numbers of unemployed people as a percentage of the labour force and it is seasonally adjusted. The labour force is defined as the total number of unemployed people plus those in civilian employment.% of labour force. Source: OECD.
• Inflation:Inflation measured by consumer price index (CPI) is defined as the change in the prices of a basket of goods and services that are typically purchased by specific groups of households. Inflation is measured in terms of the annual growth rate and in index, 2015 base year with a breakdown for food, energy and total excluding food and energy. Annual growth rate (%). Source: OECD.
• Short Term Interest Rate:Short-term interest rates are the rates at which short-term borrowings are effected between financial institutions or the rate at which short-term government paper is issued or traded in the market. Short-term interest rates are generally averages of daily rates, measured as a percentage. Short-term interest rates are based on three-month money market rates where available.% per annum. OECD.
Survey Series
• Economic Sentiment Indicator (ESI): ESI is a composite indicator calculated in order to summarize developments in 5 different sectors. Long-term average = 100. Source: European Commission.
• Consumer Confidence Index (CCI): CCI provides an indication of future developments of households’ consumption and saving, based upon answers regarding their expected financial situation, their sentiment about the general economic situation, unemployment and capability of savings. Long-term average = 100. Source: OECD.
• Business Confidence Index (BCI): BCI provides information on future developments, based upon opinion surveys on developments in production, orders and stocks of finished goods in the industry sector. It can be used to monitor output growth and to anticipate turning points in economic activity. Long-term average = 100. Source: OECD.
14
Results
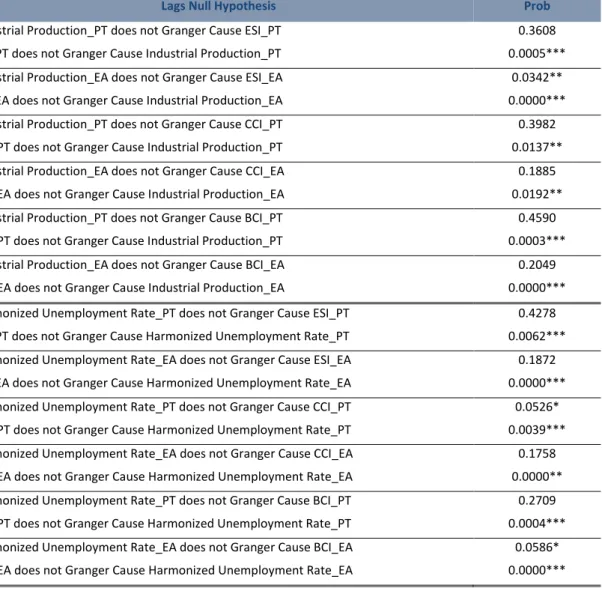
For the Granger causality test, the information criteria suggest that there should be a maximum lag length of 7 for each variable. The application of the LM test for serial independence shows that there is no problem using 7 lags (serial correlation is removed). As it can be seen in Table 3, all the confidence indicators contain statistically significant information for economic activity measured by the Industrial Production or by the Harmonized Unemployment Rate. The hypothesis that each confidence variable does not Granger cause economic activity can be rejected at the one or five percent significance level. This is consistent with the recursive identification assumed in the SVAR model, in which confidence variables are ordered first because of the expectation of them being a significant driver of economic fluctuations. On the other hand, lags in economic activity
Lags Null Hypothesis Prob
Industrial Production_PT does not Granger Cause ESI_PT 0.3608
ESI_PT does not Granger Cause Industrial Production_PT 0.0005***
Industrial Production_EA does not Granger Cause ESI_EA 0.0342**
ESI_EA does not Granger Cause Industrial Production_EA 0.0000***
Industrial Production_PT does not Granger Cause CCI_PT 0.3982
CCI_PT does not Granger Cause Industrial Production_PT 0.0137**
Industrial Production_EA does not Granger Cause CCI_EA 0.1885
CCI_EA does not Granger Cause Industrial Production_EA 0.0192**
Industrial Production_PT does not Granger Cause BCI_PT 0.4590
BCI_PT does not Granger Cause Industrial Production_PT 0.0003***
Industrial Production_EA does not Granger Cause BCI_EA 0.2049
BCI_EA does not Granger Cause Industrial Production_EA 0.0000***
Harmonized Unemployment Rate_PT does not Granger Cause ESI_PT 0.4278 ESI_PT does not Granger Cause Harmonized Unemployment Rate_PT 0.0062*** Harmonized Unemployment Rate_EA does not Granger Cause ESI_EA 0.1872 ESI_EA does not Granger Cause Harmonized Unemployment Rate_EA 0.0000*** Harmonized Unemployment Rate_PT does not Granger Cause CCI_PT 0.0526* CCI_PT does not Granger Cause Harmonized Unemployment Rate_PT 0.0039*** Harmonized Unemployment Rate_EA does not Granger Cause CCI_EA 0.1758 CCI_EA does not Granger Cause Harmonized Unemployment Rate_EA 0.0000** Harmonized Unemployment Rate_PT does not Granger Cause BCI_PT 0.2709 BCI_PT does not Granger Cause Harmonized Unemployment Rate_PT 0.0004*** Harmonized Unemployment Rate_EA does not Granger Cause BCI_EA 0.0586* BCI_EA does not Granger Cause Harmonized Unemployment Rate_EA 0.0000***
Table 3 - Granger causality test
15 do not contain significant information to explain confidence indicators, with a few exceptions where the hypotheses are rejected at the five or ten percent significance level. Regarding the analysis of impulse response functions (IRF), which trace the effect of a shock to one endogenous variable onto the other variables in the VAR, the main intention is to track the outcome of a shock to the confidence variables onto the economic activity variables in the different specifications.
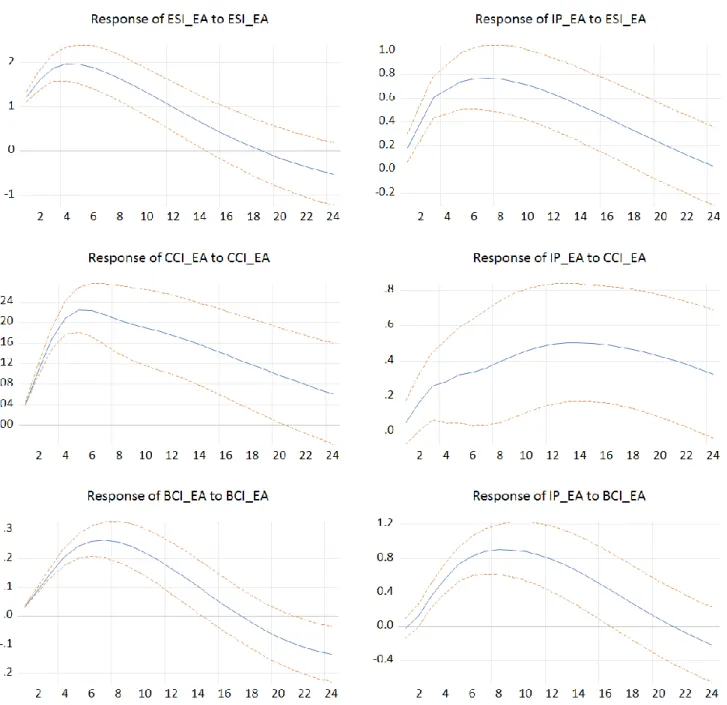
Figure 5A - Responses of confidence variables and Industrial Production to a shock to the different confidence variables - Euro Area data
Note: Sample: Sep1997 to Mar2019. One standard deviation increase in each confidence variable. The x-axis denote months. Error bands correspond to 95% confidence interval.
16 Starting with Figure 5A, the main goal is to investigate the response of the economic variable Industrial Production to shocks/innovations of the different confidence variables, using data from Euro Area. It is noticeable that, in all the three graphs on the right side, there’s a significant increase (at the 95% confidence level) in Industrial Production as a result of a positive shock to the confidence indicators, which confirms H1. It is worth mentioning, nevertheless, that that reaction to the shock is not instantaneous. The Industrial Production starts climbing slowly and peaks only a few months after the innovation. For example, in the top panel, we can see that when the one standard deviation shock to the ESI variable occurs, the Industrial Production (which is measured in an index) advances 0.2 points. After 6 to 8 months, this economic activity variable rises 0.8 points. In the case of the CCI (middle panel) the response is more gradual and not as strong, with the Industrial Production accelerating only around 0.5 points, reaching that level only after more than a year (around 14 months). With BCI (bottom panel), the response is similar to what happens with ESI, but with the peak happening after 8 to 10 months and reaching the highest value of +0.9 points, which might result from the fact that the BCI is based upon opinion surveys on developments in production, orders and stocks of finished goods in the industry sector, being closely related with the variable Industrial Production. After reaching the highest point, the economic activity variable starts slowly declining and reaches zero after about two years.
When evaluating the response of the confidence variable to a shock to itself, it is perceptible that the confidence indicators display an upward path for about 6 months after the initial shock. This should be the result of a feedback effect. In other words, the expansionary macroeconomic effect of the initial shock to confidence generates a further increase in economic agents’ confidence. That effect is a constant in all the graphs related with the response of a confidence variable to a shock to itself (left side of Figures 5A, 5B, 6A and 6B).
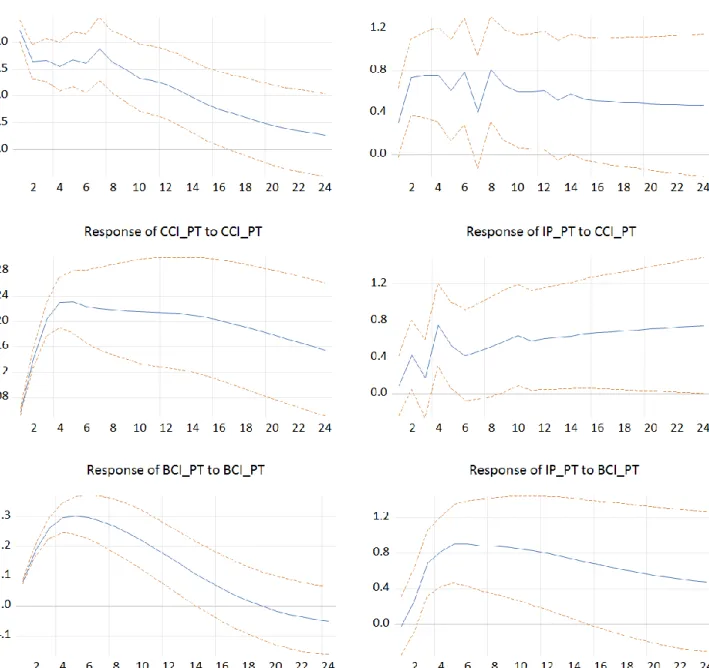
In Figure 5B, analyzing the impulse responses of Industrial Production to shocks to the different confidence variables (using data from Portugal), it is observable that the graphs related with ESI and CCI are initially more irregular than the one associated with BCI, but the three also show a positive response of the business cycle variable. In the case of the first two, the graphs stabilize around an increase of 0.6 points, after hitting +0.8 points 4 months in. In regard to the BCI, as was the case for the Euro Area, the response of Industrial Production peaks a little above what happens with other confidence
17 indicators, at +0.9 points, 4 to 6 months after the initial shock, before declining progressively.
Analyzing Figures 6A and 6B, further evidence is provided of the real effects of innovations to the three confidence indicators by investigating the robustness of the results to the use of Harmonized Unemployment Rate (HUR).
In the case of the results for both the Euro Area and Portugal, the response of HUR to the positive shocks of one standard deviation to the confidence variables, is, as theorized, a decline in this economic activity variable, also confirming H1. The impulse
Figure 5B Responses of confidence variables and Industrial Production to a shock to the different confidence variables -Portugal data
Note: Sample: Sep1997 to Mar2019. One standard deviation increase in each confidence variable. The x-axis denote months. Error bands correspond to 95% confidence interval.
18 responses seem to not peak as early as in the case of the Industrial Production, but on the other hand they are more prolonged in time. All the HUR graphs have an inverse hump shape.
In Figure 6A, we can see that for the ESI, HUR response hits the minimum of about -0.12% after 15 to 20 months and then tends to zero around 4 years after the initial innovation. CCI promotes the most accentuated response of HUR, hitting -0.2% after 25 to 30 months. With BCI, HUR response reaches -0.1% after 15 months and is back to around zero after 30 months.
Figure 6A - Responses of confidence variables and Harmonized Unemployment Rate to a shock to the different confidence variables - Euro Area data
Note: Sample: Sep1997 to Mar2019. One standard deviation increase in each confidence variable. The x-axis denote months. Error bands correspond to 95% confidence interval.
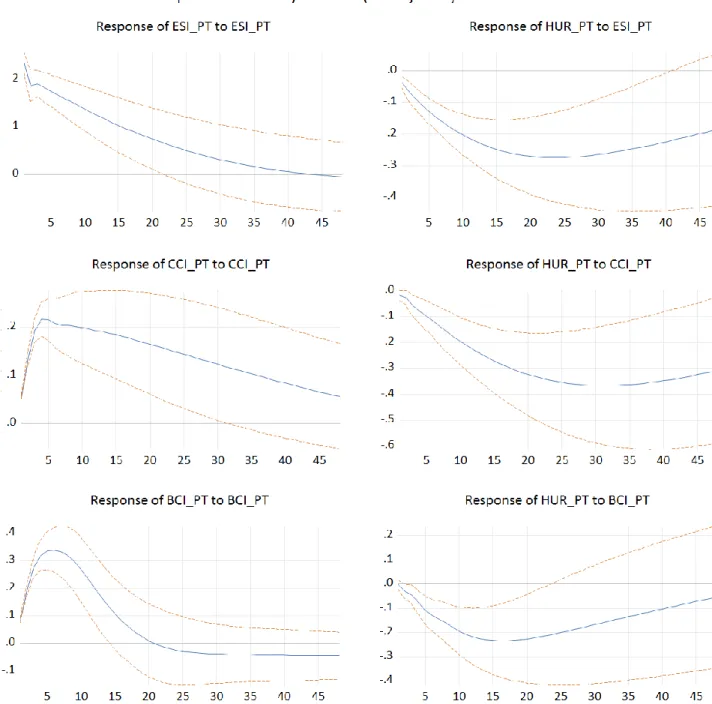
19 Finally, in Figure 6B, when there is a one standard deviation increase in ESI, HUR response hits the minimum of -0.25% after 25 months and then starts to steadily rise. CCI shock once again leads to the most accentuated response of HUR, hitting -0.35% after 30 to 35 months. With BCI, HUR response reaches -0.25% after 15 to 20 months and is back to zero after 4 years.
Regarding the forecast error variance decomposition (FEVD) and the importance of shocks to confidence indicators, it is observable that they account for a non-trivial
Figure 6B - Responses of confidence variables and Harmonized Unemployment Rate to a shock to the different confidence variables - Portugal data
Note: Sample: Sep1997 to Mar2019. One standard deviation increase in each confidence variable. The x-axis denote months. Error bands correspond to 95% confidence interval.
20 fraction of the forecast error variance of economic activity. In Table 4, we can examine the percentage of unconditional variance of the k-step-ahead forecast error in all endogenous variables due to the above-mentioned shocks, for k = 12, 24, 36 and 48 months.
Overall, unexpected changes in the confidence indicators account for bigger percentages of the forecast error variance of HUR than that of Industrial Production, especially in the case of Portugal. Shocks to forward-looking survey variables account for between 10 and 58 percent of the forecast error variance of Industrial Production, and between 7 and 67 percent of the unconditional variance of the HUR. Also, and more importantly, shocks to CCI and BCI have about the same importance in accounting for variations of both the Industrial Production and the HUR in Portugal. Concerning the Euro Area, BCI accounts for a larger fraction of volatility than CCI in Industrial Production, but the opposite happens when we look to the HUR. Therefore, no conclusive differences between shocks to CCI and BCI were found, which means that H2 isn’t observed.
In recap, shocks to forward-looking confidence variables generate a macroeconomic boom as in Leduc and Sill (2012). Furthermore, those shocks also represent a non-negligible fraction of variation in economic activity. The results are robust to the use of alternative measures of economic activity and various survey indicators.
Variance Decomposition
Industrial Production Harmonized Unemployment Rate
Euro Area
ESI CCI BCI ESI CCI BCI
12m 51.16 14.77 57.76 40.27 44.88 23.81
24m 47.43 26.00 49.80 31.16 67.04 13.68
36m 40.21 21.10 51.36 19.64 63.76 7.96
48m 42.16 18.95 53.52 14.36 59.20 7.47
Portugal
ESI CCI BCI ESI CCI BCI
12m 15.24 9.99 19.29 39.79 26.19 27.50
24m 13.07 14.49 16.62 44.89 44.17 28.10
36m 11.50 18.10 14.19 37.07 49.85 20.52
48m 10.91 21.48 13.02 29.30 51.76 14.96
21
Conclusion
The role of confidence indicators for business cycle fluctuations is investigated both in the Euro Area and the Portuguese economies. With that objective, we estimate a SVAR model which, in addition to confidence variables, also includes a measure of economic activity (such as Industrial Production or the Unemployment Rate), the Inflation Rate and the Nominal Interest Rate. Monthly data from September 1997 to March 2019 is used. The results show that an unexpected increase in economic agents’ perceived confidence raises Industrial Production and identical outcomes can be obtained if we focus on the Unemployment Rate, which declines as a signal of a boom in business cycle. Changes in agents’ perceptions about future economic developments could reflect psychological factors or could be related to the release of information regarding the economy’s future state not captured by economic fundamentals and, therefore, not summarized by contemporaneous macroeconomic variables. Changes in consumer and business confidence may therefore become an independent source of macroeconomic fluctuations and anticipate approaching cyclical turning points in economic activity.
Analyzing the importance of shocks to confidence indicators, it was observable that they account for a non-trivial fraction of the forecast error variance of economic activity. Nevertheless, no conclusive differences in accounting for variations of economic activity were detected between shocks to CCI and BCI, contradicting one of the hypotheses. This might be related with the fact that Christiansen et al. (2014) used confidence variables based on surveys from the US, and not from Europe, to conclude that the confidence of producers was better that the confidence of consumers at predicting business cycles developments. The most recent economic crisis began in the US and spread to Europe. Thus, producers in the american continent had better conditions to interpret fundamental news and their sentiments probably were more consistent with what was happenning in their economy. Meanwhile, producers in Europe possibly felt the crisis more abruptly and their sentiment didn’t have as much time to adjust.
This research shows that it is critical that policy makers pay attention to the way the measures they intend to implement might affect economic agents’ confidence. Also, in the future, the addition to the models of this investigation of fiscal policy shocks or financial variables related, for example, with the evolution of stock markets might be considered, to try to conceive investment strategies that could be useful to my professional path.
22
References
Al-Eyd, A., Barrell, R. and Philip, E. (2008). Consumer confidence indices and short-term forecasting of consumption. Manchester School, 77, 96-111.
Barsky, R. B., Sims, E.R., (2012). Information, animal spirits, and the meaning of innovations in consumer confidence. American Economic Review, 102, 1343-1377.
Castellanos-García, P., Pérez-Díaz-del-Rio, I. and Sánchez-Santos, J.M. (2014), The role of confidence in the evolution of the Spanish economy: empirical evidence from an ARDL model. European Journal of Government and Economics.
Christiano, L. J., & Eichenbaum, M - Evans, C (1997). Monetary shocks: what have we learned, and to what end?, in: Taylor, J.B., Woodford, M. (Eds.), Handbook of Macroeconomics, 65-148.
Christiansen, C. Eriksen, J.N., Moller, S.V. (2014). Forecasting US Recessions: The Role of Sentiments. CREATES Research Paper.
Dees, S. and Soares-Brinca, P. (2013),.Consumer confidence as a predictor of consumption spending: Evidence for the United States and the euro area. International Economics.
European Commission (2019). Economic Sentiment Indicator (ESI). Retrieved from https://ec.europa.eu/eurostat/web/products-datasets/-/teibs010 (Accessed on 5 May 2019).
Farmer, R. (1999), Macroeconomics of Self-fulfilling Prophecies, MIT Press.
Gallegati, M. and Gatti, D. (2018). Macrofinancial imbalances in historical perspective: A global crisis index. Journal of Economic Dynamics & Control.
Hamilton, J. D., (2018). Measuring global economic activity. Manuscript, University of California, San Diego.
Karlsson, S., (2013). Handbook of Economic Forecasting (Vol. 2B, 792-794). San Diego: Graham Elliott.
Keynes, J. M., (1936). The General Theory of Employment, Interest and Money. London: Macmillan.
23 Lambertini, L., Mendicino, C., Punzi, M. T. (2013). Expectation-Driven Cycles in the Housing Market: Evidence from Survey Data. Journal of Financial Stability 9(4), 518-529. Leduc, S., Sill, K., (2013). Expectations and economic fluctuations: an analysis using survey data. Review of Economics and Statistics.
McGee, R. T., (2015). Applied Financial Macroeconomics and Investment Strategy: A Practitioner’s
Guide to Tactical Asset Allocation (Global Financial Markets). London: Macmillan.
Mendicino, C., Punzi, M. T., (2013). Confidence and economic activity: the case of Portugal. Banco de Portugal: Economic Bulletin, 39-49.
Mumtaz, H., Rummel, O., (2015). Recent developments in structural VAR modelling. Bank
of England: Centre for Central Banking Studies.
OECD (2019), Business confidence index (BCI) (indicator). doi: 10.1787/3092dc4f-en (Accessed on 5 May 2019).
OECD (2019). Consumer confidence index (CCI) (indicator). doi: 10.1787/46434d78-en (Accessed on 5 May 2019).
Pigou, A., (1927), Industrial Fluctuations. London: MacMillan and Co. Sims, C. A., (1980). Macroeconomics and reality. Econometrica, 48(1), 1-48.
Taylor, K. and McNabb, R. (2007). Business cycles and the role of confidence: evidence for Europe. Oxford Bulletin of Economics and Statistics.
FA CU LD A D E D E E CO NO M IA