Universidade de ´
Evora - Escola de Ciˆ
encias e Tecnologia
Universidade de Lisboa - Instituto Superior de Agronomia
Mestrado em Gest˜
ao e Conserva¸c˜
ao de Recursos Naturais
Disserta¸c˜ao
Linking population trends of wild herbivores harvested in
Portugal and Hunting Zone characteristics: Effects of
location, management, interspecific competition and land
use dynamics
Sofia de Sousa Gorgulho
Orientador(es) | Miguel Nuno do Sacramento Monteiro Bugalho Susana Maria de Abreu Dias
´
A disserta¸c˜ao foi objeto de aprecia¸c˜ao e discuss˜ao p´ublica pelo seguinte j´uri nomeado pelo Diretor da Escola de Ciˆencias e Tecnologia:
Presidente | Pedro Miguel Raposo de Almeida (Universidade de ´Evora) Vogais | Pedro Rocha (Herdade da Contenda) (Arguente)
Susana Maria de Abreu Dias (Universidade de Lisboa - Instituto Superior de Agronomia ) (Orientador)
´
i
Acknowledgments
Firstly, I would like to thank my supervisors, Susana Dias and Professor Miguel Bugalho, for having accepted me in this project, especially in the short notice it all happened at the beginning, as well for all the guidance, help and suggestions throughout this entire time. Also, I thank Inês Duarte for the help and contribution on the ArcGis analyses. Also, I acknowledge ICNF and CEABN the availability of hunting statistics used in this dissertation.
On a personal note, a special thanks to my mom Teresa, for her glorious knowledge in Excel; to my dad Zé, for the help and support every time my computers suddenly broke throughout this process; to my sister Rita, for all the corrections, suggestions and improvements on the structure of the thesis and scientific writing; to my best friend Rui for English revision, infinite patience and care.
To all the people, friends and family who listened to my grunts and complains, endured my negativity and laziness, and in turn gave me light, laughter, motivation and advice. I am grateful that the list is so long it would not fit in these acknowledgments (Bisnagas, master class, Kadampas, from FCUL, from the farms, … as I said, the list goes on). I want to thank all the non-human animals who connect with me, you provide more support and comfort than you could imagine, specially to Vicky for being there when I need hugs, and Mirra and Tigre for the warmth in my lap and calming purr.
I want to thank all the libraries and cafés that were my workstation for this dissertation and to all the people that shared these spaces with me, unknowingly you gave me the motivation to actually work.
To every worker in coffee and tea farms and to everyone that produces music, you provide the power in numerous projects, this dissertation is one of them.
Overall, I want to thank all the living beings that took a part in this process and are easily forgotten and taken for granted, from the trees on the paper of my notebook to the humans that work towards the technology and comfort we live in, for we are all connected.
To the animals that consist on the numbers I worked with, you lost your life but are not forgotten nor dismissed.
ii
Abstract
Wild herbivores affect the ecology of ecosystems and, as game species, are relevant for the socio-economy of various countries. Thus, management of its populations is crucial and can benefit from hunting bag monitoring across time and space. This dissertation assesses the usefulness of data on hunting bags to get insights on wild rabbit (Oryctolagus cuniculus), Iberian hare (Lepus granatensis) and red deer (Cervus elaphus) distribution and population trends in Portugal, assessing the effects of location, administrative type, land-use dynamics and co-occurrence of species on the population dynamics of each species. The density of wild rabbit, Iberian hare and red deer hunting bags from 1989-2017 in Portugal were analysed using ANOVA to ascertain the influence of hunting region, administrative type and hunting season. Population tendencies were calculated for each hunting zone and maps of occurrence were projected in ArcGis to verify whether hunting bag data showed the same trends as other data sources. A primary analysis on the relationship between deer and lagomorphs was made through correlation analysis of populations densities of both species. The occurrence maps obtained for rabbit and hare showed a wider distribution across Portugal as compared to data on species distribution from the Atlas of Mammals of Portugal. Main core areas for deer populations had a scarcer distribution across the country. Hunting bag density is linked to region, administrative type and fluctuates throughout the years. Overall, rabbit and hare hunting bags decreased but deer hunting bags increased across time. There is correlation between deer and lagomorphs, mostly negative but also positive. Results suggest that hunting bags are useful indicators of game population abundances, but extrapolation of results must be assessed critically. Efforts on improving the efficiency of survey methods are advisable. The present dissertation contributes to understand distributions and tendencies of main herbivore game species in Portugal.
iii
Relação entre tendências populacionais de herbívoros selvagens
caçados em Portugal com características de Zonas de Caça: Efeito
da localização, gestão, competição interespecífica e dinâmicas de
uso do solo
Resumo
Os herbívoros silvestres afetam a ecologia dos ecossistemas, sendo também espécies cinegéticas com importância socio-económica. A gestão das suas populações é essencial, estando a caça diretamente relacionada. Esta providencia os números de animais abatidos anualmente nas explorações cinegéticas. A presente dissertação tem como objetivo avaliar o potencial de bases de dados de animais abatidos como indicadores das tendências populacionais das espécies cinegéticas, averiguando ainda como estas podem ser afetadas. Os dados de caça ao coelho bravo, lebre e veado em Portugal foram analisados entre 1989-2017 através de ANOVA usando como fatores fixos: região cinegética, tipo administrativo e época de caça. A tendência populacional foi calculada para cada zona de caça usando os dados de abate e projetaram-se em ArcGIS mapas de ocorrência de espécies, cujos dados foram comparados com outros estudos. Foi também investigada a ocorrência de correlações entre abates de veado e lagomorfos. Os mapas de ocorrência obtidos a partir dos dados de caça ao coelho e lebre sugerem que a distribuição destas espécies é mais ampla do que a sugerida pelo Atlas de Mamíferos de Portugal. O mapa de distribuição do veado identificou os principais núcleos populacionais da espécie. A densidade de animais caçados varia com a região cinegética e tipo de zona de caça, oscilando ao longo dos anos. Em geral, a densidade de coelho e lebre caçados diminuiu ao longo do período de estudo, enquanto que a de veado aumentou, o que é concordante com outros estudos. Foi encontrada uma correlação, maioritariamente negativa, mas também positiva, entre a densidade de lagomorfos e veados. Os resultados da exploração cinegética são um potencial indicador de abundância, mas deve ser avaliado com cuidado. É essencial uma melhoria no método de declaração dos resultados cinegéticos anuais. Esta dissertação contribui para melhorar o conhecimento sobre distribuição e tendências das espécies estudadas.
Palavras-chave:
Cinegética, dinâmica populacional, lagomorfos, veado, gestão doiv
Table of contents
Acknowledgments ...i Abstract ... ii Resumo ... iii Table of contents ... iv List of figures ... vi List of tables ... ix 1. Introduction ... 11 1.1 Wild herbivores ... 111.2 Abundance and distribution study ... 13
1.3 Hunting in Portugal ... 15
1.4 Deer-rabbit/hare interactions ... 18
1.5 Objectives ... 20
2. Materials and Methods ... 21
2.1 Study area ... 21
2.2 Hunting bag statistics ... 23
2.3 Methods ... 25
2.3.1 Comparison between hunting bag locations and species distribution reported in Atlas of Mammals of Portugal (2019) ... 25
2.3.2 Differences in species hunting bags among regions, hunting zone types and across years ... 26
2.3.3 Trends in density of hunting bags across regions and hunting zone types... 26
2.3.4 Correlations between species harvests... 28
3. Results ... 29
3.1 Species occurrence and comparison with Atlas of Mammals of Portugal (2019) ... 29
3.1.1 Wild rabbit ... 29
3.1.2 Hare ... 31
3.1.3 Red deer ... 32
3.2 Hunting bag differences among regions, hunting zone types and across years ... 34
3.2.1 Wild rabbit ... 34
3.2.2 Hare ... 37
3.2.3 Red deer ... 39
3.3 Hunting bag trends ... 41
3.3.1 Wild rabbit ... 41
v
3.3.3 Red deer ... 44
3.4 Correlations between species hunting bags ... 45
4. Discussion ... 50
4.1 Hunting bag data and Atlas of mammal species distribution ... 50
4.2 Differences in density of hunted animals between hunting regions, administrative types and across hunting seasons ... 51
4.3 Hunting bag trends ... 54
4.4 Correlations between species hunting bags ... 56
4.5 Limitations of hunting bags data ... 57
4.6 Linking wildlife conservation and hunting ... 58
5. Final considerations ... 60
6. Bibliographic references ... 62
Annex I – Data distribution before and after logarithmic transformation ... 75
Annex II – Original (untransformed) data ... 76
Annex III – Nonparametric tests ... 78
Annex IV – Tendency categories in rabbit populations ... 80
Annex V – Density of hunted rabbit and hare per hunting season among hunting region (95% CI) ... 81
Annex VI – Transition matrixes resuming changes between major land use classes between 1995 and 2018 ... 82
vi
List of figures
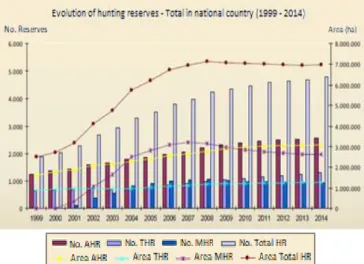
Figure 1 - Evolution of the number and area of total HZs in Portugal from 1999 to 2014 (adapted from
Lopes, 2015) ... 16
Figure 2 - Hunting regions in Portugal: I - North, II - Centre, III - Lisbon and Tagus Valley, IV - Alentejo, V – Algarve (adapted from Lopes, 2015) ... 16
Figure 3 - Rabbit distribution across continental Portugal. A filled-in grid square means that the species
was detected at least once in that area during the time period considered. A. Hunting bags data; A’. Number and percentage of grid squares, regarding the hunting bags data, with registered presence of rabbit. B. Atlas of Mammals of Portugal (adapted image); B’. Number and percentage of grid squares, regarding the Atlas of Mammals of Portugal data, with registered presence of rabbit. Sem data – no available data. Old (Antigo) - data obtained from 1990 – 1999. Recent (Recente) - data obtained from 2000 – 2018. Confirmed (Confirmado) – excludes records of occurrence from vocalizations, records of indirect signs of presence not confirmed genetically or records with no indication of how they were obtained. All the data from the hunting bags comprises only confirmed records, since there was an animal kill. ... 30
Figure 4 - Hare distribution across continental Portugal. A filled-in grid square means that the species
was detected at least once in that area during the time period considered. A. Hunting bags data; A’. Number and percentage of grid squares, regarding the hunting bags data, with registered presence of hare. B. Atlas of Mammals of Portugal (adapted image); B’. Number and percentage of grid squares, regarding the Atlas of Mammals of Portugal data, with registered presence of hare. For more info, see Figure 3 ... 31
Figure 5 - Deer distribution across continental Portugal. A filled-in grid square means that the species
was detected at least once in that area during the time period considered. A. Hunting bags data; A’. Number and percentage of grid squares, regarding the hunting bags data, with registered presence of deer. B. Atlas of Mammals of Portugal (adapted image); B’. Number and percentage of grid squares, regarding the Atlas of Mammals of Portugal data, with registered presence of hare. Peneda-Gerês National Park - PG, Montesinho Natural Park - M, Serra da Lousã - SL, International Tagus - IT, Lisbon (district) - L, east Alentejo - A, Évora - E, Silves - S. For more info, see Figure 3 ... 33
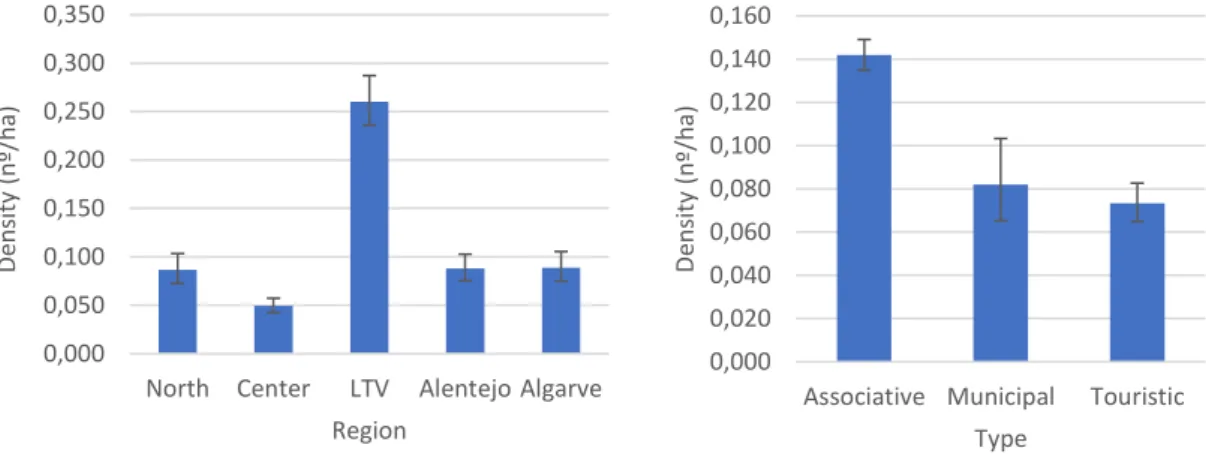
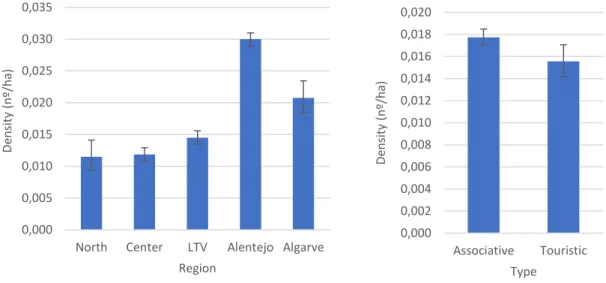
Figure 6 - Mean harvested rabbits per hectare (density) on each hunting region and administrative type.
Values are the mean of all values reported in hunt bags from 1889/90 to 2015/16 from HZs with thirteen or more records. Values were back-transformed from logarithmic transformation. Error bars display 95% CI ... 34
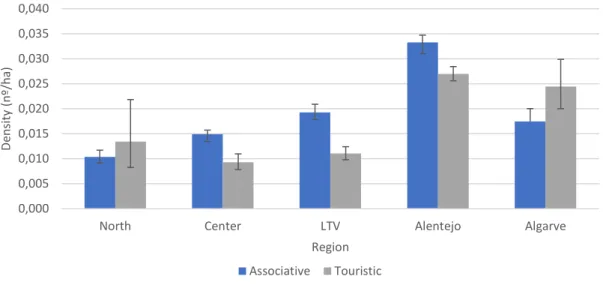
Figure 7 – Mean density of harvested rabbits in each administrative type across the five hunting regions.
Error bars display 95% CI. ... 35
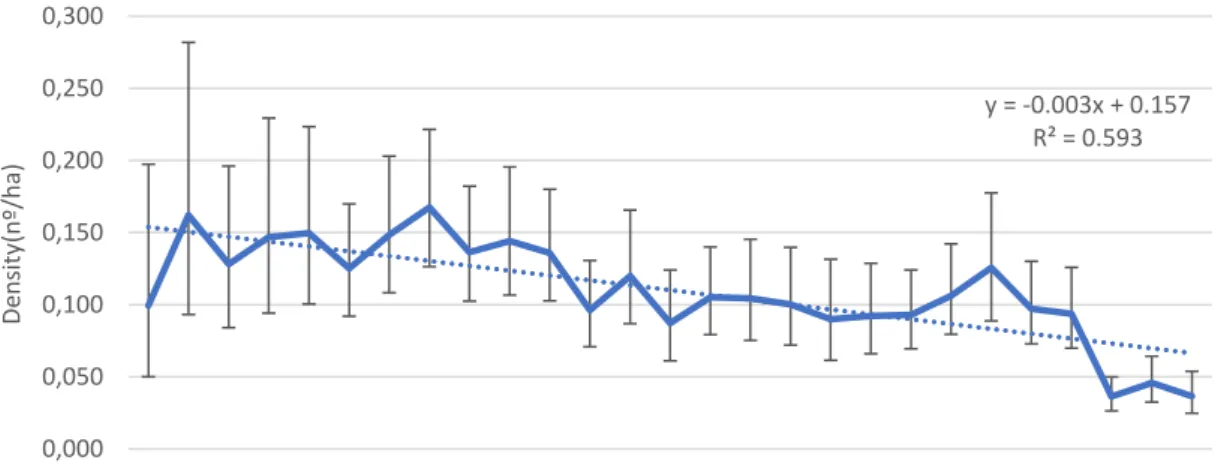
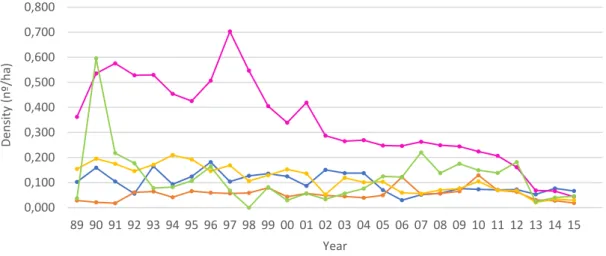
Figure 8 – Mean density of harvested rabbits in Portugal per hunting season since 1989/90 (89) until 2015/16 (15). Error bars display 95% CI. Trendline is displayed, as well as the equation and R-squared
value. ... 35
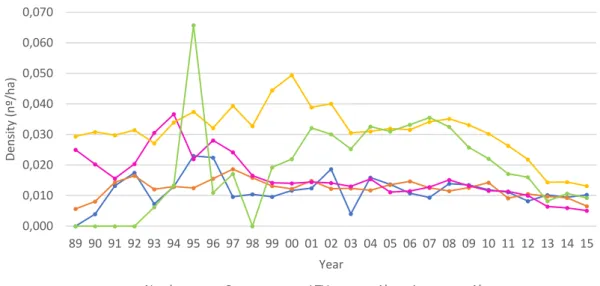
Figure 9 - Mean density of harvested rabbits per hunting season in each region. 95% Confidence intervals
are available in annex V ... 36
Figure 10 – Unusual high values of rabbit density. Rabbit harvest density (nº hunted rabbits per ha,
y-axis) at each hunting season (x-y-axis) in eight HZs, as example. Graphic titles state HZ code per region: AL – Alentejo; C – Centre; LTV – Lisbon and Tagus Valley. Scales are not standardized. ... 36
vii
Figure 11 - Mean harvest hares per hectare (density) on each hunting region and administrative type.
Error bars display 95% CI ... 37
Figure 12 – Mean density of harvested hares in each administrative type across the five hunting regions.
Error bars display 95% CI ... 38
Figure 13 – Mean density of hunted hares in Portugal in each hunting season since 1989/90 (89) until 2015/16 (15). Error bars display 95% CI. Trendline is displayed, as well as the equation and R-squared
value. ... 38
Figure 14 - Mean density of harvested hares per hunting season in each region. 95% Confidence intervals
are available in annex V ... 39
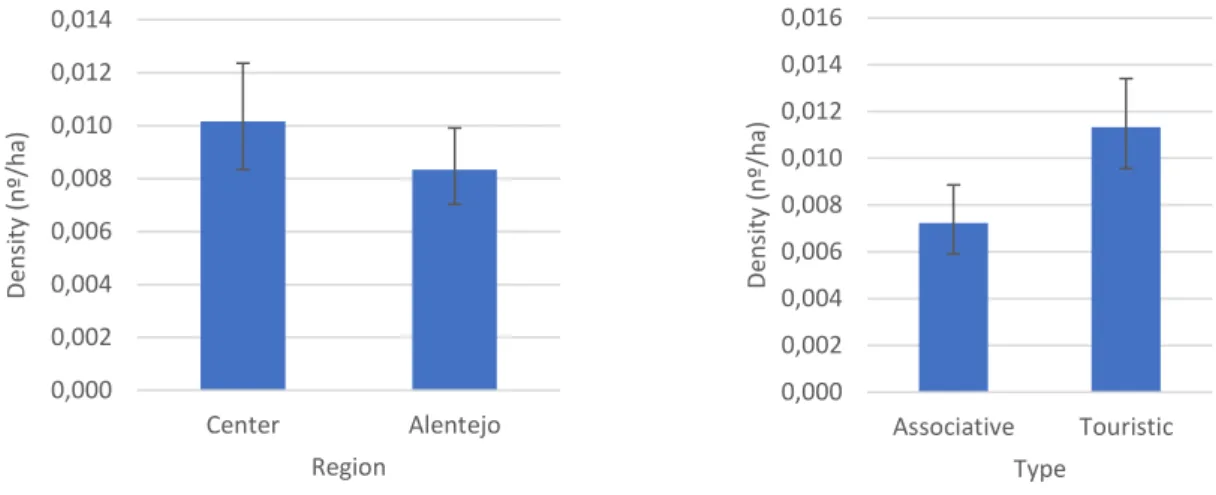
Figure 15 - Mean density of harvested deer in the period 1989-2017 in each hunting region and administrative type. Error bars display 95% CI ... 40
Figure 16 - Mean density of harvested deer in Portugal in each hunting season since 1989/90 (89) until 2017/18 (17). Error bars display 95% CI. Trendline is displayed, as well as the equation and R-squared
value. ... 40
Figure 17 - Proportion (%) of rabbit population tendency category across hunting regions and administrative types. G – growth; D – decline; U – unstable. ... 41
Figure 18 - HZs with rabbit hunts across Portugal. A: HZ tendency category; B: HZ administrative type.
NW – area of rabbit population growth in the northwest of Portugal; GV – area of rabbit population growth in the Guadiana Valley. ... 42
Figure 19 - Proportion (%) of hare population tendency category across hunting regions and administrative types. G – growth; D – decline; U – unstable. ... 43
Figure 20 - HZs with hare hunts across Portugal. A: HZ tendency category; B: HZ administrative type. .. 43
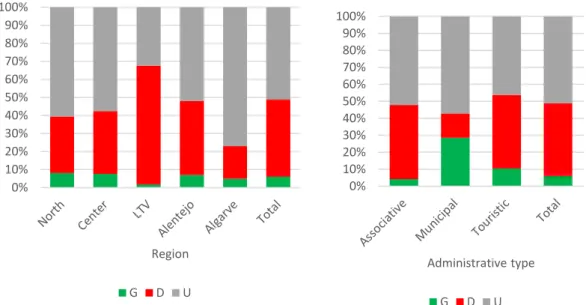
Figure 21 - Proportion (%) of deer population tendency category across hunting regions and administrative types. G – growth; D – decline; U – unstable. ... 44
Figure 22 - HZs with deer hunts across Portugal. A: deer population tendency category; B: HZ
administrative type. IT – area where most HZs with deer hunts are located. ... 44
Figure 23 – Correlation between lagomorphs and deer found in HZs across Portugal. A: HZs with both
rabbit and deer hunts; B: HZs with both hare and deer hunts. ... 48
Figure 24 - Proportion change (mean and 95%CI) of major land-use classes between 1995 and 2018 for the three Pearson correlation categories (negative, neutral and positive) for reed deer and rabbit (left side graphs) and red deer and hare (right side graphs) ... 49
Figure 25 - Histogram and Normal Q-Q plot of rabbit density values in north region. Serves as an example
of the right-skewed distribution the density values of rabbit, hare and deer show for all regions and administrative types in study... 75
Figure 26 - Histogram and Normal Q-Q plot of rabbit logarithmic density values (Log10 (x)) in north
region. Serves as an example of the normal distribution that the log-density values of rabbit, hare and
viii
Figure 27 - Proportion (%) of rabbit population tendency category (extended) across hunting regions and administrative types. G - growth, D - decline, UG – unstable growth, U – unstable, UD – unstable
decline ... 80
Figure 28 - Mean density of harvested rabbits per hunting season in each region. Error bars display 95%
CI ... 81
Figure 29 - Mean density of harvested hares per hunting season in each region. Error bars display 95%
ix
List of tables
Table 1 - Number of HZs with record of at least one hunting season in the period 1989-2015(7) in Portugal, specified by game species, hunting region and administrative type. ... 23
Table 2 - Number of HZs with 13 or more recorded hunting seasons for rabbit and hare, and with 8 or more recorded hunting seasons of deer, between 1989-2015(7) in Portugal, specified by game species, hunting region and administrative type. ... 24
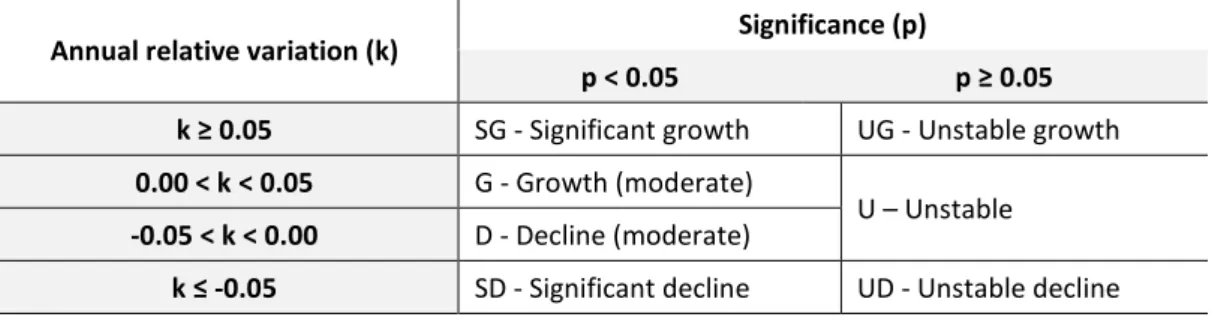
Table 3 - Tendency categories criteria. Adapted from other European studies on population status
evaluation (e.g. Dias, 2016) ... 27
Table 4 - Adjusted tendency categories ... 27
Table 5 – Second adjustment of tendency categories ... 28
Table 6 - Number of grid squares overlapping in the two maps of wild rabbit occurrence. ATLAS: records
regarding the Atlas of Mammals of Portugal. HUNTING BAGS: records regarding the map constructed from hunting bags. Absent (blank): no records of occurrence. For more info, see Figure 3 ... 29
Table 7 - Number of grid squares overlapping in the two maps of hare occurrence. ATLAS: records
regarding the Atlas of Mammals of Portugal. HUNTING BAGS: records regarding the map constructed from hunting bags. For more info, see Table 6 ... 32
Table 8 - Number of grid squares overlapping in the two maps of red deer occurrence. ATLAS: records
regarding the Atlas of Mammals of Portugal. HUNTING BAGS: records regarding the map constructed from hunting bags. For more info, see Table 6 ... 33
Table 9 - HZs where both rabbits and deer were hunted between 1989-2015 for N hunting seasons.
Significant (Sig.) correlation was admitted * at p<0.05 and ** at p<0.01. Positive correlations were admitted at Pearson's r > 0 and negative at Pearson's r < 0. Strongly negative - ; Negative - ; Strongly positive - ; Positive - ; Neutral - . HZ are coded per region: AL – Alentejo, C – Centre, LTV – Lisbon and Tagus Valey, Alg - Algarve ... 45
Table 10 - HZs where both hares and deer were hunted between 1989-2015 for N hunting seasons.
Significant (Sig.) correlation was admitted * at p<0.05 and ** at p<0.01. Positive correlations were admitted at Pearson's r > 0 and negative at Pearson's r < 0. . Strongly negative - ; Negative - ; Strongly positive - ; Positive - ; Neutral - . HZ are coded per region: AL – Alentejo, C – Centre, LTV – Lisbon and Tagus Valey, Alg - Algarve ... 46
Table 12 - Original data (untransformed): mean density of hunted rabbit, hare and deer in each hunting region for the period in study. Mean: number of hunted animals per hectare; Lower/Upper: lower and
upper bounds of 95% confidence interval. ... 76
Table 13 - Original data (untransformed): mean density of hunted rabbit, hare and deer in each administrative type for the period in study. Mean: number of hunted animals per hectare; Lower/Upper:
lower and upper bounds of 95% confidence interval. ... 76
Table 14 - Original data (untransformed): mean density of hunted rabbit, hare and deer in each hunting season for the period in study. Mean: number of hunted animals per hectare; Lower/Upper: lower and
x
Table 15 - Dunn’s pairwaise test on density of wild rabbit between hunting regions. Highlighted: groups
with significant difference (p < 0.05, adjusted using the Bonferroni correction) ... 78
Table 16 - Dunn’s pairwaise test on density of wild rabbit between administrative types. Highlighted:
groups with significant difference (p < 0.05, adjusted using the Bonferroni correction) ... 78
Table 17 - Dunn’s pairwaise test on density of hare between hunting regions. Highlighted: groups with
significant difference (p < 0.05, adjusted using the Bonferroni correction) ... 79
Table 18 - Transition matrix resuming changes between major land use classes between 1995 and 2018 for the all HZ where red deer and rabbit or hare coexist in the hunting bag statistics, in percentage (%)
... 82
Table 19 - Transition matrix resuming changes between major land use classes between 1995 and 2018 for the all HZ where red deer and rabbit or hare coexist in the hunting bag statistics, in hectares (ha) 83
Table 20 – Land-use change between 1995 and 2018 (in %) for the all HZ where red deer and rabbit or hare coexist in the hunting bag statistics. HZ are coded per region: AL – Alentejo, C – Centre, LTV – Lisbon
11
1. Introduction
1.1 Wild herbivores
Wild herbivores, by interacting directly or indirectly with soil, vegetation and fauna, may cause a profound impact on the ecosystems, namely on their structure and dynamics (Hester et al., 2000; Reimoser & Putman, 2011, Lecomte et al., 2019).
The composition and structure of the vegetation are transformed through herbivore feeding habits, implying that herbivory intensity determines not only plant species abundance and diversity, but also community canopy structure and ecosystem primary productivity (Milchunas et al., 1988; Milchunas & Lauenroth, 1993; Bugalho et al., 2006; Bugalho et al., 2013; Mutze et al., 2016). By modifying flora, herbivores also have an impact on animal communities (Stewart, 2001; Bugalho et al., 2006) and can, this way, regulate the abundance, richness and diversity of different faunistic groups, such as lagomorphs, rodents, birds, arthropods and nematodes. These effects differ, however, between faunistic groups and herbivory intensity (Sumption & Flowerdew, 2008; Bugalho et al., 2011). Changes in vegetation communities by herbivores also affect soil’s structure and composition, having consequences in soil’s carbon and nitrogen reservoirs (Milchunas & Lauenroth, 1993), namely Soil Organic Carbon (SOC) stocks (Piñeiro et al., 2010). Additionally, herbivory contributes to changes in frequency and intensity of fires by helping to reduce vegetation loads (Oesterheld et al., 1999; Bond & Keeley, 2005; Lecomte et al., 2019), which will also contribute to modifications in SOC accumulation (Piñeiro et al., 2006) and, consequentially, determine the soil fertility, water retention and structure (Lal, 2004). This makes the relationship herbivores-flora-fauna quite complex, inducing an event cascade with a variety of consequences to the ecosystems (Milchunas et al., 1998).
Wild herbivores play another important role in ecosystems, as they are frequently the basis of food chains. Some herbivorous species play a special role as prey due to their predators’ specialization, particularly when these predators have an unfavourable conservation status. The wild rabbit (Oryctolagus cuniculus) and the Iberian hare (Lepus
granatensis) are good examples of this situation, being preyed by numerous species in
the Mediterranean ecosystem (Delibes-Mateos et al., 2008; Tapia et al., 2010). Some of these predators evolved as “super-specialists” in rabbit hunting, such as the Imperial eagle (Aquila adalberti) and the Iberian lynx (Lynx pardinus), both endemic to the Mediterranean region and sharing a high conservation status (Delibes-Mateos et al., 2008). Other facultative or opportunistic predators of the wild rabbit are also endangered species, like the Bonelli’s eagle (Hieraaetus fasciatus), the Golden eagle (Aquila chrysaetos), the Red kite (Milvus milvus), the Montagu’s harrier (Circus
pygargus), the Egyptian vulture (Neophron percnopterus), the Black vulture (Aegypius monachus) and the Bearded vulture (Gypaetus barbatus) (Fernàndez, 1993; Villafuerte et al., 1998; Delibes-Mateos et al., 2008). In addition, there are several other predators
12
that also include the wild rabbit in their diet to a greater or lesser extent, depending on its abundance, such as the Black kite (Milvus migrans), the Wild cat (Felis silvestris) and the Fox (Vulpes vulpes) (Delibes-Mateos et al., 2008).
Likewise, red deer (Cervus elaphus), namely calves and juveniles, may be part of the diet of various top predators, thus playing a vital role in conservation of protected species such as the Iberian lynx, (Okarma et al., 1997), the Golden eagle (Watson et al., 1992), the Black vulture (Costillo et al., 2007) and the Wolf (Canis lupus) (Jȩdrzejewski
et al., 2000; Salazar, 2009).
On top of influencing the structure of predator communities, prey availability also has consequences on their survival and reproductive success (Watson et al., 1992; Fernàndez, 1993; Serrano, 2000). Thus, the study of the distribution and abundance of those herbivorous species will support a proper management of natural prey populations, which is crucial to the success of their predator’s conservation programs.
Besides their ecological relevance, wild herbivores also have a significant role on the socio-economy of different countries, either positive or negative, depending on the implementation and success of population management plans. There are several cases of poorly animal population management, often leading to high densities of wild herbivores that conflict with land use objectives and create imbalances for biodiversity and ecosystems, causing environmental and economic impacts (Williams et al., 1995; Putman et al., 2011; Reimoser & Putman, 2011). When introduced in a new habitat, or due to changes in land use and human presence, some species can become a pest, inflicting damages in agriculture (Putman, 1986; Norbury & Norbury, 1996; Fleming et
al., 2002; Schley & Roper, 2003; Wilson et al., 2009), forestry (Ratcliffe, 1989; Gill, 1992)
and habitats of conservation concern (Henzell & Lay, 1981; Mitchell & Kirby, 1990; Cooke & Farrell, 2001; Lecomte et al., 2016). It is also important to notice the potential risk to public safety due to vehicle collisions (Langbein et al., 2011) and transmission of diseases to humans, domestic livestock and pets (Simpson, 2002; Froliche et al., 2002; Bohm et al., 2007). For example, millions of dollars are used annually for control of the wild rabbit in Australia (Williams et al., 1995), both by the public and private sector. The consequences of the infestation led to severe economic damage due to losses on the agriculture, livestock and forestry sector, reaching millions of dollars annually (e.g., $135 million in Australia) (Gordon et al., 2004).
However, when populations are well managed, wild herbivores bring numerous social-economic benefits, having a high economic value. They are a popular touristic attraction, especially for public interested in wildlife observation (ecotourism) (Salazar, 2009), thus generating revenue in natural parks where tours are specially designed to observe these animals, usually the largest and most abundant, such as the deer and the wild boar (Maciejewski & Kerley, 2014). Hunting is also an important source of income in different regions, namely of marginal agricultural activity. Hunting is one of the main sources of income in various rural areas, generating employment and moving hunters to these regions worldwide (Mulero, 1991; Lovelock, 2007), in this way contributing to
13
the improvement of life conditions for the underprivileged populations (Conover, 1997; Salazar, 2009). For example, in the United States, over one billion dollars is spent on deer sport hunting (Gordon et al., 2004) and, in Portugal, game activity engages an estimated value of around 330 million euros for the annual economy (Paiva et al., 2016). Hunting can also be a viable and sustainable solution to deal with over-abundance species, with additional economic benefits for the local population through indirect impacts in subsidiary activities (e.g., hotels, restaurants and transportation used by the tourist hunters) (Gordon et al., 2004; Vasios et al., 2020). Hunting plays one other key role in communities, both utilitarian, recreational and cultural, by strengthening social bonds and being a source of food resources (Lovelock, 2007).
Wild herbivores are, therefore, of extreme importance, at ecologic, social and economic levels. Hence, an effective population management is crucial, be it driven by economic or conservation goals. The success of such management plans relies on sound knowledge on species distribution and abundance, across space and time, and on the factors affecting it (Thomas & Martin, 1996; Fewster et al., 2000; Croose et al., 2019).
1.2 Abundance and distribution study
Monitoring the distribution and abundance of wild herbivore species assists in the evaluation of population trends, which is essential for implementing protective measures and allows adaptive management (Hellawell, 1991; Thomas & Martin, 1996; Gibbs et al., 1999; Fewster et al., 2000; Croose et al., 2019). For example, species with declining populations, such as the wild rabbit (Martins et al., 2002; Ferreira et al., 2010), need conservation measures, while other species proliferating ominously, as the wild boar (Fernández-Llario et al., 2003), need control measures in order to keep the ecosystem’s balance.
Population monitoring takes a crucial role in various areas (Lindenmayer & Likens, 2009), namely:
a) when evaluating a species’ conservation status or the progress of its recovery plan (Witmer, 2005; Virgós, 2007);
b) in detecting decreases of population numbers, allowing to redirect research and management efforts before the species is endangered;
c) in containing the spread of pests and their capacity to cause agricultural, sanitary or environmental damages (Witmer, 2005);
d) evaluating intra and interspecific competition when facing limited resources; e) and by assuring a desirable population structure for game species subject to
sustainable exploration (Delibes-Mateos et al., 2009).
In addition, linking population trends with environmental factors and land-use management allows the evaluation of species habitat preferences and somehow predict how it will react to future changes (Gibbs et al., 1999; Witmer, 2005).
14
Monitoring animal populations may be performed by various methods, some needing direct observation of individuals (e.g., in transects, camera and live trapping, for mark-recapture and tracking with radio-telemetry). There are also a variety of indirect methods, which instead of relying on directly seeing or hearing animals merely observe signs of presence, such as faecal counts, hair tubes, food removal, burrow counts, runway counts or track stations (Witmer, 2005; Croose et al., 2019). Accurate collection of data can be challenging on many wildlife species, either because of their small size, secretive or nocturnal habits, large home ranges or low population densities (Milner-Guilland & Rowcliffe, 2007). Also, personality traits may influence detectability, causing under-sampling of less exploratory individuals if a sampling method requires potentially risky behaviour, such as entering a trap. All methods have advantages and disadvantages, a combined sampling approach is the most effective for estimating and monitoring animal populations (Witmer, 2005; Croose et al., 2019).
Hunting bags statistics, by reporting date, local and some information about the hunted specimen, can be a tool for monitoring and study population trends (Myrberget, 1988; Besnard et al., 2010). For instance, in the UK, many estates have monitored local
game abundance in the last two centuries, through numbers of culled animals annually (Whitlock et al., 2003; Aebischer & Baines, 2008). Potts et al. (1984) analysed population fluctuations in the red-grouse (Lagopus lagopus) through the analysis of bag records and Cattadori et al. (2003) calculated the index of their population density. Virgós et al. (2007) used hunting bag data as the source of wild rabbit abundance across years and analysed population trends in order to identify its conservation status in Spain. It is also worthy of mention that Kitson (2004) used the harvest rate of sooty shearwaters (Puffinus griseus) as a tool for monitoring population trends. Using hunting bags as source of information for monitoring programs has numerous advantages compared to other methods, such as (Witmer, 2005; Aebischer & Baines, 2008; Croose et al., 2019):
- Covering a wide span of time and space, providing national scale vision and unique insight into historical trends;
- Covering a great range of species;
- Absence of common limitations like challenging fieldwork, secretive habits of species, high financial and team investment, space and time limitations. The main challenge of working with hunting bags is finding a plausible link between the number of animals culled and trends of game populations. This is particularly challenging if there is missing data, such as spatial and/or temporal gaps in records, hunting efforts or in the absence of a systematic method to record hunting data (Ferreira
et al., 2010). Studies with a large dataset tend to perform well and obtain better
estimates, even in the absence of accurate hunting effort information (Whitlock et al., 2003; Aebischer & Baines, 2008).
15
1.3 Hunting in Portugal
Since pre-historical times, hunting has been part of human’s lifestyle, both as a way to find food and to strengthen social bonds (Gallego, 2010). Small mammals, like the wild rabbit, were a major component of humans’ diet in the Iberian Peninsula since the Palaeolithic, and they still remain a valuable resource nowadays, although less than before due to the domestication of the species (Delibes-Mateos, 2008). Humans have also hunted several other animals since primordial times, namely the deer. Centuries ago, in Europe, big game hunting was restricted to the upper classes, such as the royalty and nobility (Salazar, 2009), but with the passing of times, deer hunting steadily increased in popularity and became a universal sport, under specific regulations and fees (e.g., Ordinance n.º 105/2018, of April 18) To minimise over-hunting, pressure on game species and conflicts between hunting and other ecological and agricultural goals, the implementation of hunting management legislation was crucial. In Portugal, since 1959, is forbidden to hunt endangered species (Salazar, 2009) and from 1986 onwards hunting zones were created to allow adequate management and sustainable hunting of game species, generating additional sources of income mainly in depressed rural areas. After the law nº30/86, of 27 August, it was possible to establish “Zones of Special Hunting Regime” (ZSHR), where game management is allowed, and hunting effort regulated according to availability of game species. The law aimed to reconcile the principle of hunting freedom with the right of game exploitation, resulting in the obligation to negotiate agreements with landowners and the establishment of rules in favour of resident hunters. In addition, management entities were entitled to monetary compensation, based on their contribution to breeding, promotion and conservation of game species, thereby encouraging their protection. ZSHR are created by the Government according to several administrative types: National Hunting Zone (NHZ), Social Hunting Zone (SHZ), Associative Hunting Zone (AHZ) and Touristic Hunting Zone (THZ). There are also hunting zones that belong to the military or to the justice ministry; however, these are very uncommon and will not be discussed in detail. What differs between ZSHR is the management entity, payment options and the modalities of hunting plans and exploitation (Law nº 30/86).
NHZs are established in areas whose physical and biological characteristics allow the formation and preservation of important game resources or when, by public safety reasons, it is justified being the State the only responsible for its management. SHZs aimed to provide all national hunters the possibility to hunt in affordable conditions. In 1999, Municipal Hunting Zone (MHZ) replaced the SHZ (Law nº 173/99, of 21 September). In a similar concept, MHZ favours the local resident hunters and hunting depends on a special permit, obtained by public lottery to ensure equal accessibility. Management of MHZs may be performed by farmers, forestry producers, environmental NGOs, local authorities or other collective entities. AHZs encourage partnership between hunters, with game management done by associations, societies
16
or hunting clubs with intention on carrying out actions towards the sustainability of hunting and game resources. It is the hunter’s association responsibility to elaborate the management and exploration plans and hunting is reserved for its members and their guests. Finally, THZs aim essentially to provide a touristic service by exploring game resources. This may be done by the State, local authorities, tourist companies or societies of landowners. Hunting is offered equally both to national and foreign hunters. The implementation of ZSHRs in Portugal increased steadily until the point where almost all-available land was under a specific management plan (game included) which happened around 2006 (Figure 1). Currently, national authorities consider that the designation of “Zone of Special Hunting Regime” is outdated given the large dissemination (coverage) of the different types of game management across the country. As such, the designation in use is simply Hunting Zone (HZ).
Besides HZs, there are also areas of land under no management plan but where hunting is permitted, according to general limitations by law. These are referred as “unordered hunting lands” (Law nº 173/99, of 21 September).
In 2018 there were 4977 HZs covering around 7 million hectares, corresponding to 79% of national mainland territory (INE, 2018). Portugal is organised in five hunting regions, I - North, II - Centre, III – Lisbon and Tagus Valley (LTV), IV – Alentejo and V – Algarve (Figure 2). Most of HZs are located in Alentejo and AHZ dominate in all regions (over 50% in number and area). MHZs are more abundant in the North where THZs are only vestigial, while in Alentejo and Algarve the opposite occurs. In central Portugal (regions II and III) MHZ and THZ have similar abundance (Lopes, 2015; Santos et al., 2015). Military and justice ministry HZs are scarce and together with NHZs, represent only 0.3% of the total number of HZs (INE, 2016).
Figure 1 - Evolution of the number and area of total HZs in Portugal from 1999 to 2014 (adapted from Lopes, 2015)
Figure 2 - Hunting regions in Portugal: I - North, II - Centre, III - Lisbon and Tagus Valley, IV - Alentejo, V – Algarve (adapted from Lopes, 2015)
17
Since 1989, each HZ needs to report annual game results to the institution in charge (currently, ICNF - Instituto da Conservação da Natureza e das Florestas – Institute for Nature Conservation and Forests). These reports include the number of hunters, hunting days and animals that were culled (Decreto-lei nº 202/2004). ICNF compiles these data, allowing information on the number of animals culled by species in each HZ and hunting season.
Current legislation requires for each HZ the establishment of multi-annual hunting plans. These contain relevant components for the conservation, promotion and exploration of game, such as land use and water resources cartography, game species inventory, qualitative estimation of game populations (e.g., age and sex structure), conservation measures and processes of population estimation. It also defines goals such as to minimize negative impacts for the game fauna, to increase habitat carrying capacity or to enhance maximum sustained productivity, and establishes the actions to reach them, including habitat and population management.
Habitat management measures can be oriented for improving food resources and water availability (e.g., establishing game crops, defining sowing and grazing periods, installing water points), for improving availability of shelter (creating refugee areas) or for improving habitat quality (increasing structure complexity). Population management encompasses restocking, translocations, selective shooting, predator control, population estimation and monitoring and determination of harvesting rates (Bugalho & Carvalho, 2001).
The hunting calendar is another tool for game management, stating the species, processes and periods reserved to hunting activity, taking into consideration reproductive cycles and migration periods of the game species. Currently, this calendar is established every 3 years and applied at national level. The number of culled specimens of each species and the expected number of hunting days are defined in the annual hunting plan, according to the population management measures undertaken.
Hunting effort is also a main factor that influences animal populations and can be measured either by the number of hunters, time spent hunting, area covered by hunters or even hunting methods used (Rist et al., 2008). These parameters influence population age and sex structure and animal behaviour, especially in big game species since hunters tend to prefer trophy animals, turning hunting more selective (Hutchings & Harris, 1995;
Torres-Porras et al., 2008; Braga et al., 2010). However, hunters or landowners seldom measure or are required to supply this information. As such, hunting effort is evaluated trough results of questionnaires and interviews (Brøseth & Pedersen, 2001) and to
economic results on the number of registered hunters. In Portugal, data on the total
number of emitted hunting licences per hunting season depict a decrease between 2000/01 to 2014/15 (from ca. 225 000 to 115 000 emitted licences). It is also known that the majority of current licenced hunters are of old age – in 2014, 69% were above 50 years old and only 3.3% were under 30 years (Santos et al., 2015). This abandonment on hunting activity, linked with the low recruitment of young people and the high rate of
18
old age hunters who simply cease hunting, is expected to continue unless there is an effort to entice young hunters and/or tourists (Paiva et al., 2017). This conjures a problem for the economy and to the management of HZs, due to lack of financial income. Also, over-abundant game populations, such as the wild boar, will increase without the population control from hunting, thus enhancing the negative effects it has on ecosystems.
Concluding, hunting, as a bio-economic activity, is directly related to animal population management, influencing it strongly and conditioning distribution and abundance of game species (Fisher et al., 2013).
This dissertation addresses the three species of wild herbivores previously mentioned: the wild rabbit, the Iberian hare and the red deer. All these herbivores are game species by law in Portugal (e.g. Annex I of Decreto-Lei nº 202/2004, of 18 August 2004, amended by Decreto-Lei nº 201/2005, of 24 November 2004).
1.4 Deer-rabbit/hare interactions
Normally, different feeding niches contribute to ecological segregation and coexistence among herbivores within the same habitat. Herbivores have developed different digestive systems and ways to digest the plant food, and therefore have different diets. The main difference among herbivore digestive systems are polygastric and monogastric, or ruminant and non-ruminant herbivores. These animals also tend to differ largely in body size and behaviour (Duncan et al., 1990), which leads to a resource’s partition through selection of food items with different height above ground level (“feeding-height-separation” hypothesis (Du Toit, 1990; Bugalho, 1995; Sangiuliano et al., 2016). This means that the smaller herbivores can feed on vegetation closer to the ground, while larger herbivores feed higher on vegetation, thus causing segregation between species, or even between males and females of dimorphic species such as deer (Bugalho et al., 2001). However, this hypothesis is not yet completely confirmed (see, for example, Telfer, 1972a, b; Belovsky, 1984; Hulbert & Andersen, 2001).
Increased herbivore population density and dispersion may trigger interspecific competition for resources or cause habitat changes that affect other animal and plant populations (Lecomte et al., 2017). An example is the “overabundance” of ungulates (such as wild boar and red deer) which cause several negative effects on wildlife, vegetation and soil dynamics through over-foraging (Carpio et al., 2014; Lecomte et al., 2016). In this situation, it is hypothesised that deer (large ruminants) and lagomorphs (small non-ruminants), sharing the same food stratum, may compete for food resources. Lagomorphs are expected to have a competitive advantage under large ruminants, since they have a digestive system more tolerant to poor quality foods (Sangiuliano et al., 2016) and the relation between metabolic needs and body size allows them to survive
19
with limited food resources (Illius & Gordon, 1987). However, when food is scarce, both species may prefer to feed on vegetation closer to the ground, since younger plants are more nutritious, empowering interspecific competition (Belovsky, 1984; Hulbert & Andersen, 2001).
Despite lack of information on the subject, some studies report overlapping diets in deer and lagomorphs. Dodds (1960), Telfer (1972a) and Belovsky (1984) found an overlap in the diet of the Moose (Alces alces) and the Snowshoe hare (Lepus
americanus), suggesting competition between them, and Telfer (1972b) also found a
diet overlap between the White-tailed deer (Odocoileus virginianus) and the Snowshoe hare. Hulbert & Andersen (2001) suggest that when coexisting in the same habitat, roe deer (Capreolus capreolus) and the European hare (Lepus europaeus), which are both browser species, preferentially feeding on woody vegetation, compete between themselves, with the hare having a poorer diet. In the Mediterranean climate, Sangiuliano et al. (2016) also reports this situation between the roe deer and European hare, although of minor significance and only during winter.
In the last decades, big game species, such as deer, have increased across their areas of distribution, mainly due to favourable habitat changes (e.g. agricultural abandonment and consequent increase of woody habitat types) and lack of large predators (Lecomte
et al., 2016). Additionally, particularly in Portugal, there were various areas where deer
was reintroduced, mainly for hunting purposes (Salazar, 2009). While previously decreasing, deer populations are now responding positively to these conservation actions (Bugalho et al., 2006; Salazar, 2009; Burbaite & Csányi, 2010). Overabundant deer populations, however, may negatively impact ecosystems and eventually other herbivores due to interspecific competition for food (Carpio et al., 2014).
In the present thesis, within the context of competition and facilitation among different body size herbivores species, we aim to assess, as a preliminary step of future research, if there are significant correlations between density of red deer and wild rabbit/Iberian hare harvest in hunting zones in Portugal.
20
1.5 Objectives
Monitoring distribution and abundance of wild herbivores is crucial for managing their populations. For game management purposes, in particular, it is also important to know how HZ’s characteristics may affect game populations. Given that HZs report the numbers of harvested animals, this data may be useful to inform monitoring and management plans for game species populations.
The main objective of the present dissertation is to explore hunting bag data as a complement of other sources of information on the distribution and abundance of game populations, using wild herbivores as an example. Additionally, it addresses how hunting bags vary with location and administrative type of HZs. Therefore, annual density of wild rabbit, Iberian hare and red deer harvested in HZs of continental Portugal, between 1989-2018, are analysed to (i) generate maps of occurrence/distribution for the analysed species, which is compared with distributional data reported by the Atlas of Mammals of Portugal (Bencatel et al., 2019); (ii) ascertain the influence of HZ’s characteristics on density of hunted animals; (iii) determine the hunting bag trends in the analysed HZs; (iv) investigate potential correlation between hunting bags of red deer and wild rabbit and between red deer and hare.
Specific objectives can be synthesized in the following questions:
(i) Do hunting bags reported for red deer, wild rabbit and hare across the country, support distributional data reported by the Atlas of Mammals of Portugal for these species?
(ii) Are there differences in hunting bag densities among regions, administrative types and years?
(iii) Do trends of hunting bags vary with administrative type and hunting region? (iv) Are there significant correlations, either positive or negative, between
annual density trends of wild rabbits and red deer and between hare and red deer?
Each topic is address as a specific section of the results in chapter 3 of this dissertation. Discussion and main conclusions are presented in chapter 4 and final considerations in chapter 5. The bibliography cited throughout the document are listed in chapter 6. Supplementary information regarding data analyses can be found in annexes I to VI.
21
2. Materials and Methods
2.1 Study area
This study is conducted at the national level, covering the whole territory of Continental Portugal. Biogeographically, Continental Portugal is divided in two Holarctic Regions: Eurosiberian and Mediterranean. The north-west of Portugal belongs to the Eurosiberian Region, characterized by a temperate and rainy climate, strongly influenced by the Atlantic Ocean (Aguiar et al., 2008). Mean annual temperature varies between 19°C in summer and 3°C in winter, while mean annual rainfall is usually over 1,000 mm (IPMA, 2015). North-east, centre and south Portugal belong to the Mediterranean Region, characterized by mild winters and a dry period in summer that lasts at least two months, where temperatures are high and rain is scarce (Aguiar et al., 2008). In the north-east rainfall averages around 1,000-800 mm annually, going below 400 mm in some areas, while mean annual temperatures vary between 20°C in summer and 4°C in winter (Ferreira, 2000; IPMA, 2015). In the central and southern areas of Portugal, most of the territory receives around 500-700 mm of rainfall per year, with some areas in Algarve receiving less than 400 mm (Ferreira, 2000). The exception occurs in mountainous areas were annual rainfall goes above 800 mm in the south and reaches 2800 mm in the Central System (Serra da Estrela) (Ferreira, 2000). In the centre of Portugal average temperature reaches 21°C in summer and 7°C in winter, while in the south it varies between 24°C in summer and 9°C in winter (IPMA, 2015).
The northern and centre areas are the more mountainous regions of Portugal (Aguiar et al., 2009) with four main mountain complexes: the Serras
Galaico-Portuguesas (1,544 m at Serras do Gerês), Serras Galaico-Duriences (1,486 m at Serra de
Montesinho), Serras Beira-Durienses (1,381 m at Serra de Montemuro) and the Central System that includes Serras da Malcata, Gardunha, Açor, Lousã and Estrela, where the highest point of continental Portugal occurs (1,993 m) (Aguiar & Vila-Viçosa, 2016). At the centre-southern Portugal there are some lower mountains, such as Serra de São
Mamede (1,027 m) in the east, and Serras de Aire e Candeeiros (675 m) and Serra de Sintra (528 m) in the west (Rebelo, 1992). Southern Portugal is mainly plain, with
relevant elevations at Serra de Monchique (902 m) and Serra do Caldeirão (577 m) (Ferreira, 2000).
The north-west forest communities are characteristic of the Eurosiberian climate, such as woods dominated by deciduous trees, mainly the European (Quercus robur) and Pyrenean-oak (Quercus pyrenaica), and low scrubs of gorses (Ulex sp.), heathers (Erica sp.) and brooms (Cytisus sp.). Typical of the Mediterranean area are the woods and scrubland composed of sclerophyllus shrubs and trees like the holm-oak (Quercus
rotundifolia), cork-oak (Quercus suber), kermes-oak (Quercus coccifera) and wild olive
tree (Olea europaea). Annual meadows of cistus (Cistus spp.), heathers and gorses are frequent in brushland clearings.
22
The vegetation at the north-east of Portugal consists of mixed woods of cork-oaks, holm-oaks and juniper trees (Juniperus sp.) and a landscape dominated by bushlands of heathers and brooms. The plains of interior Alentejo are dominated by montados of cork and holms oaks, being common in low areas several types of reeds and meadows typical of wet soils. Also, scattered across the territory, it is possible to observe mosaics of these oaks with a diversity of scrubland (e.g. strawberry tree Arbutus unedo, kermes-oak) and low bushes (heathers, cistus). In the littoral areas of center and southern Portugal vegetation is quite complex, with a diversity of oaks and wild olive woods. Near water lines it is common to find ash trees (Fraxinus spp.), willows (Salix spp.), poplars (Populus spp.), elms (Ulmus spp.) and brambles (Rubus spp.). This primitive vegetation is, however, often replaced by crops, meadows or vineyards. It is also possible to find low brushlands and scrublands typical of dunes and coastal cliffs, such as juniper, seagrass and gall-oak (Quercus lusitanica). In Algarve and southern Alentejo, besides the woods previously mentioned, it can also be found carob trees (Ceratonia siliqua) and low brushlands of cistus and thymes (Thymus sp.) (Aguiar et al., 2008).
23
2.2 Hunting bag statistics
The hunting bag data was obtained from ICNF, under a protocol with CEABN (Centro
de Ecologia Aplicada "Professor Baeta Neves" – Centre for Applied Ecology "Professor
Baeta Neves"), School of Agriculture, University of Lisbon. Dataset consists on the number of animals harvested (per hectare) during each hunting season as well as information related to HZ administrative type (associative, touristic, municipal), HZ location (expressed by the administrative hunting region, see Figure 2) and by the centroid coordinates of the HZ area (which were used for projection in ArcGis maps). Hunting bag data covered the period between hunting season of 1989/1990 and 2017/2018. Throughout the text, hunting seasons will be identified by the first year of the season, e.g. 1989/1990 = 1989 or 89. Deer hunting is allowed all year, however a hunting season initiates in June and ends in May of the following year. Rabbit and hare game seasons are open from September to December, although hares may be hunted until February with specific methods (Ordinance n.º 105/2018, of April 18).
This dissertation addresses three species: the wild rabbit, Iberian hare and red deer. A first exploratory analysis revealed that hunting bags for other species, such as roe deer and fallow deer, did not have enough data for national coverage and analysis. Although hunting bag data of red deer are considerably less than of rabbit and hare (see Table 1), this species was kept as a representative of big game, namely to analyse the relationship between this animal and the lagomorphs.
Rabbit, hare and deer data
For rabbit and hare there are 27 years of data, from 1989/90 to 2015/16, while for deer there are two additional years, until 2017/18. All available data with known location of animal harvest were used to describe species distribution, whereas a subset of the data was applied to assess hunting bag trends (Virgós et al., 2007). This latter subset includes HZs with 13 or more years of records for rabbit and hare (corresponding to at least 50% of hunting seasons in the study period) and with 8 or more years of records for red deer.
Table 1 - Number of HZs with record of at least one hunting season in the period 1989-2015(7) in Portugal, specified by game species, hunting region and administrative type.
Region Rabbit Hare Deer Type Rabbit Hare Deer
North 843 484 10 Associative 2760 2551 195 Centre 969 678 121 Municipal 1160 719 40 LTV 688 545 22 National 13 12 3 Alentejo 2283 2516 195 Touristic 1080 1155 150 Algarve 261 243 42 Military 4 3 1 Total 5044 4466 390 Social 24 24 1 Ministry of Justice 3 2 0 Total 5044 4466 390
24
Rabbit hunting data refer to 5044 HZs, of which 1228 HZs have 13 or more registered years. The Military HZ type was removed from analysis on the effect of administrative type, due to the lack of representativeness in the dataset, and only associative, municipal and touristic HZs were considered (1227 HZs).
Data of annual hare bags was reported by 4466 HZs, of which 874 HZs have 13 or more registered years. Given that there is just three MHZs, only AHZs and THZs were considered for evaluating the effect of administrative type on hare trends (871 HZs).
Deer hunting was reported by 390 HZs, of which 74 HZs have 8 or more registered years. There is only one municipal and two national HZs, which is not enough data to take conclusions on these management types, so only AHZs and THZs were considered for evaluating the effect of administrative type on deer trends (71 HZs). Also, since there are no HZs in north region, and only three in LTVregion and four in Algarve, these regions were not included in the analysis for effect of hunting regions (67 HZs).
Table 2 - Number of HZs with 13 or more recorded hunting seasons for rabbit and hare, and with 8 or more recorded hunting seasons of deer, between 1989-2015(7) in Portugal, specified by game species, hunting region and administrative type.
Region Rabbit Hare Deer Type Rabbit Hare Deer
North 198 97 0 Associative 959 636 28 Centre 238 140 28 Municipal 28 3 1 LTV 288 102 3 National 0 0 2 Alentejo 443 493 39 Touristic 240 235 43 Algarve 61 42 4 Military 1 0 0 Total 1228 874 74 Total 1228 874 74
25
2.3 Methods
2.3.1 Comparison between hunting bag locations and species distribution reported in Atlas of Mammals of Portugal (2019)
Systematic surveys of species covering all national territory are challenging, time-consuming and imply considerable investment of financial resources. The Atlas of Mammals of Portugal (Bencatel et al., 2019) resulted from an exhaustive compilation of bibliographic sources, complemented with direct personal records from individuals, associations and companies, news, naturalistic photographs, public databases and various information available online. Works of this nature, similar to that of most mammal Atlas in other countries (Palomo et al., 2007), are essential for mapping and analysing general patterns of the known distribution of species at the national scale, being an important starting point for further investigation. For the purposes of this dissertation, the Atlas of Mammals of Portugal (hereafter mention as Atlas)was considered the most complete work on the distribution of mammals in Portugal. Additional sources of information, however, may contribute to improve and complement large scale distribution maps (Bencatel et al., 2019). Such is the case of information regarding species hunting bags.
In the Atlas, distribution maps were constructed by converting the records of species presence to the respective square of the UTM-29 (Universal Transverse Mercator) 10x10km2 grid, in national territory (Bencatel et al., 2019). Similarly, for
comparing hunting bag locations with Atlas species distribution data, the centroid of each HZ was projected in ArcMap (from ESRI ArcGIS 10.6.1) and the UTM-29 10x10km2
grid was applied to the map of continental Portugal, with the difference that the Atlas used R software for projection. With the purpose of displaying hunting occurrence of each species in a given period, thus representing species presence in mainland Portugal, all HZs were considered in this analysis.
A filled-in grid square means that a species was detected and harvested at least once in that area, during the period considered. In the Atlas, areas with no indication whether the species is present or not are identified as “No data” (Bencatel et al., 2019). In the maps constructed in this dissertation, it corresponds to areas where there are no records of HZs. The Atlas distinguishes “Old” records from “Recent”, considering old data from 1990 - 1999 and recent from 2000 – 2018, so this legend was used was well in this dissertation’s maps. There is also unconfirmed data in the Atlas’ maps, corresponding to records of occurrence from vocalizations, records of indirect signs of presence not confirmed genetically or records with no indication of how they were obtained (Bencatel et al., 2019). The maps constructed from the hunting bags comprise only confirmed records, since each corresponds to a culled animal.
To compare Atlas distribution maps with hunting bag locations, the number and percentage of grid squares common to both sources of information were assessed and their frequencies compared.
26
2.3.2 Differences in species hunting bags among regions, hunting zone types and across years
The effect of hunting region, administrative type and year on the harvest density of each study species was analysed with ANOVA on transformed data (see below). A three-way ANOVA with hunting region, administrative type and year as independent factors and hunting bags density as dependent variable, was performed. Tukey post-hoc
HSD test were used to assess the differences between groups (see section 2.2 Hunting statistics).
Kolmogorov-Smirnov test showed that the original density values of rabbit, hare and deer do not follow a normal distribution neither in regions, types nor years and histograms and normal Q-Q plots displayed a right-skewed distribution (see Annex I). Hence a logarithmic (log10) transformation was performed (the most suitable
transformation for right-skewed distributions, see Kirchner, 2001; McDonald, 2008) to reach normality and homoscedasticity. Log transformed data distribution was shown to be very close to normal and therefore parametric analysis were used as this approach is more robust to slight violations of their assumptions (Blanca et al., 2017) and can perform well with non-normal data if sample size is satisfied (Frost, 2015).
The density logarithmic values are not very informative so it would not be wise to report means in transformed units (McDonald, 2008). The marginal means of hunting bags density (m) for each level of each factor, as well as the lower and upper bounds of 95% confidence interval (CI), of the log-transformed values were back-transformed and displayed in graphics.
Non-parametric Kruskal-Wallis tests were performed on the original data and are available in Annex III, as well as statistical information of the original data (Annex II).
The level of statistical significance considered for all analysis was at p-value < 0.05. Data were analysed using the SPSS software (IBM SPSS Statistics version 25) and graphics were constructed in Microsoft Excel.
2.3.3 Trends in density of hunting bags across regions and hunting zone types
To assess the trend in density of bagged species across the period of study period, each HZ was classified according to annual changes in the density of harvested animals using adapted criteria from other studies (e.g., Pannekoek & van Strien, 2005; PECBMS, 2012; Dias, 2016). A general linear model for bag density with year as explaining variable was used to determine slope values and R2 significance. R2 significance was calculated
through variance analysis, considering a 0.05 (p) significance level. Annual relative variation (k) was determined by dividing slope value obtained with the model, by the
27
mean of annual values. Hence, each population tendency in each HZ was categorized from k and p values (Table 3).
Table 3 - Tendency categories criteria. Adapted from other European studies on population status evaluation (e.g.
Dias, 2016)
Annual relative variation (k) Significance (p)
p < 0.05 p ≥ 0.05
k ≥ 0.05 SG - Significant growth UG - Unstable growth 0.00 < k < 0.05 G - Growth (moderate)
U – Unstable -0.05 < k < 0.00 D - Decline (moderate)
k ≤ -0.05 SD - Significant decline UD - Unstable decline
Contingency tables were performed for each one of the three species in study, one with the variables region/tendency and other with type/tendency. A contingency table displays the frequency distribution of two categorical variables as well as the proportion of a variable within the other, providing a general picture of the relation between them. Furthermore, a chi-square test was conducted as it determines whether there is a relationship between categorical variables (if they are dependent or not) (Van Den Berg, 2014).
Adjustments on the criteria for population tendency categories were performed after first analysis so that no cells on the contingency table had zero counts (Weaver, 2013). Original categories SG/G were merged as G (growth), categories SD/D were merged as D (decline) (Table 4). The results for rabbit populations considering these five tendency categories are available in Annex IV.
Table 4 - Adjusted tendency categories
Annual relative variation (k) Significance (p)
p < 0.05 p ≥ 0.05
k ≥ 0.05
G - Growth UG - Unstable growth 0.00 < k < 0.05
U – Unstable -0.05 < k < 0.00
D - Decline
k ≤ -0.05 UD - Unstable decline
A second adjustment was performed since hare and deer contingency tables still displayed cells with zero counts. Original categories UG/U/UD were merged as U (unstable) (Table 5).