Universidade de Aveiro 2017
Departamento de Química
Ricardo Miguel Moura
Ferreira
Adaptação de Saccharomyces cerevisiae a alta
pressão
Adaptation of Saccharomyces cerevisiae to high
pressure
Universidade de Aveiro 2017
Departamento de Química
Ricardo Miguel Moura
Ferreira
Adaptação de Saccharomyces cerevisiae a alta
pressão
Adaptation of Saccharomyces cerevisiae to high
pressure
Dissertação apresentada à Universidade de Aveiro para cumprimento dos requisitos necessários à obtenção do grau de Mestre em Biotecnologia, ramo de Biotecnologia Alimentar, realizada sob a orientação do Doutor Jorge Manuel Alexandre Saraiva, Investigador Auxiliar e da Doutora Ivonne Delgadillo Giraldo, Professora Associada com agregação ao Departamento de Química da Universidade de Aveiro.
o júri
Presidente Professor Doutor João Manuel Costa Araújo Pereira Coutinho Professor Catedrático do Departamento de Química da Universidade de Aveiro
Vogais Doutora Ana Maria Pereira Gomes
Professora auxiliar na Escola Superior de Biotecnologia da Universidade Católica Portuguesa
Doutor Jorge Manuel Alexandre Saraiva (orientador)
agradecimentos Agradeço, em primeiro lugar, a todos que, de uma forma geral, contribuíram de forma direta ou indireta para a realização desta tese.
Ao Doutor Jorge Manuel Alexandre Saraiva, por me ter aceitado no grupo e no laboratório, pela orientação e paciência, por ter acreditado em mim e ter investido no meu trabalho e por toda a ajuda fornecida ao longo deste ano. À professora Ivonne Delgadilho, pela coorientação, pela sua simpatia e por todos os conhecimentos que me forneceu ao longo do primeiro ano do mestrado que de certo modo ajudaram na realização desta tese.
A todos os meus colegas do Innovate Group, em especial à Maria João e à Rita por tudo aquilo fizeram por mim ao longo deste ano, por toda a orientação dada, por toda a ajuda no laboratório e na escrita da tese e por todos os momentos de diversão que se foram proporcionando.
À Professora Ana Gomes, por ter disponibilizado alguns dos equipamentos que permitiram de certa forma a realização desta tese.
Ao Sérgio Sousa, pela disponibilidade em me receber e em me ajudar com a análise dos meus resultados.
Ao meu colega de laboratório e amigo Carlos Pinto, por toda a ajuda que me deu ao longo dos meus dois anos em Aveiro e por todos os momentos de convívio e entreajuda que me acompanharam ao longo deste desafio. Ao Fernando Sá, por ser uma das fundações da minha vida e ter estado presente todos os dias do ano que passou.
A todos os meus amigos, especialmente, à Catarina Cunha, ao João Palhau, à Andreia Silva e à Celina São José que me apoiam, alguns deles desde sempre e que perdendo o seu tempo comigo fizeram este ano melhor e mais fácil.
Por ultimo, mas não menos importante quero agradecer à minha família, mãe e pai, pelo apoio incondicional, por terem acreditado em mim desde sempre, por saberem que seria capaz de superar todos os desafios, por me terem dado tudo o que lhes foi possível, e por fazerem de mim a pessoa que sou hoje.
palavras-chave Saccharomyces cerevisiae, fermentação, bioetanol, pressão e adaptação.
resumo O objetivo do presente trabalho passou pelo estudo da adaptação de S. cerevisiae à pressão, usando ciclos consecutivos de fermentação sob pressão em níveis sub-letais. Assim, este trabalho foi divido em duas partes: numa primeira parte, foram aplicadas pressões sub-letais (entre 15-50 MPa) durante o processo fermentativo para determinar as pressões a serem utilizadas na fase posterior; na segunda parte, as culturas de S. cerevisiae realizaram fermentação sob pressão ao longo de quatro ciclos consecutivos de fermentação de modo a desencadear um mecanismo de adaptação à pressão. Neste contexto, foram testadas três pressões (15 MPa, 25 MPa e 35 MPa) e duas temperaturas (30 ºC e temperatura ambiente). De modo a monitorizar os processos, foram determinadas as concentrações de açúcares (glucose, frutose e maltose), etanol e ácidos orgânicos (cítrico, málico, succínico e acético). Para além disso, foram realizadas análises microbiológicas para determinar a viabilidade celular e concentração de biomassa. Após cada ciclo a 15 e 25 MPa, tanto o crescimento celular como a produção de etanol mostraram tendência para aumentar, sugerindo a adaptação da S. cerevisiae a estes níveis de pressão. Na verdade, no final do 4º ciclo sob ambas as pressões, a produção de etanol foi superior à observada à pressão atmosférica (8.75 g.L-1 e 10.69 g.L-1 a 15 e 25 MPa,
respetivamente, comparando com 8.02 g.L-1 à pressão atmosférica). No entanto,
quando a pressão aumenta para 35 MPa, o crescimento celular e a produção de bioetanol diminuíram, sendo mínimas após os 4 ciclos de fermentação consecutivos. De um modo geral, estes resultados sugerem que a adaptação a condições sub-letais de pressão (15 e 25 MPa) pode melhorar a produção de bioetanol pela S. cerevisiae, podendo esta técnica ser utilizada para aumentar rendimentos e produtividades da fermentação alcoólica.
keywords Saccharomyces cerevisiae, fermentation, bioethanol, pressure and adptation.
abstract The objective of the present work was to study the adaptation of S. cerevisiae to the pressure, using consecutive cycles of fermentation under pressure at sublethal levels. Thus, this work was divided in two parts: in the first part, sub-lethal pressures (between 15-50 MPa) were applied during the fermentation process to determine the pressures to be used in the later phase; in the second part, S. cerevisiae cultures underwent fermentation under pressure over four consecutive fermentation cycles to trigger a pressure adaptation mechanism. In this context, three pressures (15 MPa, 25 MPa and 35 MPa) and two temperatures (30 ° C and ambient temperature) were tested. In order to monitor the processes, the concentrations of sugars (glucose, fructose and maltose), ethanol and organic acids (citric, malic, succinic and acetic) were determined. In addition, microbiological analyses were performed to determine cell viability and biomass concentration. After each cycle at 15 and 25 MPa, both cell growth and ethanol production showed a tendency to increase, suggesting the adaptation of S. cerevisiae to these pressure levels. In fact, at the end of the 4th cycle under both pressures, the ethanol production was higher than that observed at atmospheric pressure (8.75 g.L-1 and 10.69 g.L-1 at 15 and 25 MPa, respectively,
comparing with 8.02 g.L-1 at pressure atmospheric). However, when the pressure
increases to 35 MPa, cell growth and bioethanol production decreased, being minimal after the 4 consecutive fermentation cycles. In general, these results suggest that adaptation to sublethal pressure conditions (15 and 25 MPa) can improve bioethanol production by S. cerevisiae, and this technique can be used to increase yields and yields of alcoholic fermentation.
Index
1 Introduction ... 1
1.1. Yeasts – General overview and the particular case of Saccharomyces cerevisiae ... 1
1.2. Yeasts Metabolism ... 2
1.3 Fermentation processes ... 5
1.3.1 Bioethanol production ... 7
1.3.1.1 Bioethanol production by Saccharomyces cerevisiae ... 8
1.4 Stress and adaptation ... 9
1.4.1 Production of heat shock proteins ... 11
1.4.2 Other stress during fermentation ... 11
1.4.3 Fermentation using non-conventional conditions ... 14
1.5 High pressure (HP) technology ... 15
1.5.1 Effects of HP on microorganisms ... 16
1.5.1.1 Effects on DNA ... 17
1.5.1.2 Effects on membranes ... 17
1.5.1.3 Effects on proteins ... 18
1.5.2 High pressure adaptation ... 19
1.5.2.1 Saccharomyces cerevisiae under High pressure... 20
2. Objectives of the work……….25
3 Materials and Methods ... 26
3.1. Microorganism ... 26
3.2. Inoculum preparation………...………26
3.3. Fermentation under high pressure………...………26
3.4. Consecutive cycles of fermentation under high pressure ... 27
3.5. Biomass concentration ... 28
3.6. Microbial cell enumeration ... 28
3.7. Physicochemical characterization………28
3.8. Kinetic parameters………..………28
4. Results and discussion……….30
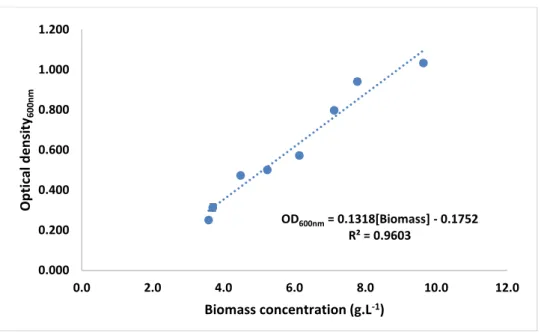
4.1. Determination of the growth calibration curve ... 30
4.2. Fermentation under HP and selection of the most suitable conditions ... 30
4.2.1 Glucose consumption………..31
4.2.2 Production of bioetanol ... 32
4.2.3. Consumption of different sugars………...………33
4.2.5. Production of organic acids……….………..34
4.2.5.2 Acetic acid………..35
4.2.6. Biomass concentration ... 36
4.3. Consecutive cycles of fermentation under high pressure at 30 ºC ... 38
4.3.1. Substrate consumption ... 38
4.3.2. Production of bioethanol ... 40
4.3.3. Production of organic acids ... 42
4.3.3.1 Formic acid……….….…………..42
4.2.4.2 Acetic acid.………..…………...………...44
4.3.4. Biomass concentration ... 47
4.3.5. Microbial load evolution at 30 ºC ... 48
4.3.6 Kinetic parameters……….………..48
4.3.6.1 Yield of bioethanol production……….……….………..50
4.3.6.2 Yield of formic acid production……….……….………….52
4.3.6.3 Yield of acetic acid production……….………52
4.3.6.4 Yield of biomass production………...……….53
4.3.6.5 Productivity and specific productivity of bioethanol………..….54
4.3.6.5.1 Bioethanol productivity………..…………..54
4.3.6.5.2 Specific bioethanol productivity……….….55
4.3.6.6 Ratio of bioethanol: by-products of fermentation………...…56
4.4. Consecutive cycles of fermentation under high pressure at room temperature ... 56
4.4.1. Substrate consumption……….……….57
4.4.2. Production of bioethanol………...………...58
4.4.3. Production of organic acids………...…...60
4.4.3.1 Formic acid………..……….60
4.4.3.2 Acetic acid……….………..62
4.4.4. Biomass concentration ... 63
4.4.5. Microbial load ... 65
4.4.6 Kinetic parameters at room temperature………..66
4.3.6.1 Yield of bioethanol production………...…..66
4.3.6.2 Yield of formic acid production……….……….…….68
4.3.6.3 Yield of acetic acid production……….……...69
4.3.6.4 Yield of biomass production………..….…….70
4.3.6.5 Productivity and specific productivity of bioethanol……….….…….71
4.3.6.5.1 Bioethanol productivity……….……….……..71
4.3.6.5.2 Specific bioethanol productivity……...……….……….…….72
5 Conclusions ... 73 6 Future prospects ... 75 7 References ... 76
Index of Illustrations
Figure 1 Diversity of channels involving yeasts biotechnology (Walker, 1998a) ___________________ 2 Figure 2 General overview of yeasts carbon metabolism (Walker, 1998b) _______________________ 3 Figure 3 Metabolic pathway of ethanol fermentation in S. cerevisiae. Abbreviations: HK: hexokinase, PGI: phosphoglucoisomerase, PFK: phosphofructokinase, FBPA: fructose bisphosphate aldolase, TPI: triose phosphate isomerase, GAPDH: glyceraldehydes-3-phosphate dehydrogenase, PGK: phosphoglycerate kinase, PGM: phosphoglyceromutase, ENO: enolase, PYK: pyruvate kinase, PDC: pyruvate decarboxylase, ADH: alcohol dehydrogenase (Bai, Anderson, & Moo-Young, 2008) ________ 4 Figure 4 Different examples of fermentations that occur in industry ___________________________ 6 Figure 5 Flow diagram of the sugar-ethanol and electricity industrial production model used in Brazil. Adapted from (Cortez & Baldassin, 2016) _________________________________________________ 9 Figure 6 Main signalling pathways controlling the yeasts adaption response to food-relevant stresses. The cross walk between stress responses was not considered (Rantsiou et al., 2012)_______________ 10 Figure 7 Potential environmental stresses on S. cerevisiae during ethanol fermentation. (Adapted from
Bai et al., 2008) _____________________________________________________________________ 12
Figure 8 Examples of the effects of high hydrostatic pressure on cells and cellular components. A: lipids in membranes; B: multimeric protein assemblages, C: protein structure; D: cellular motility; E: protein translation by ribosomes (Oger & Jebbar, 2010a). ___________________________________ 16 Figure 9 Effect of culture pressure on the proportion of the major fatty acid species in the deep-sea bacterium Photobacterium profundum strain SS9 (Bartlett, 2002a). ___________________________ 18 Figure 10 Global gene expression profile in functional categories. Black bars and white bars represent the percentage of induced and repressed genes, respectively (Fernandes et al., 2004). _____________ 21 Figure 11 Kinetics of ethanol production as a function of pressure to 100 MPa (Picard et al., 2007) _ 22 Figure 12 Ethanol production (in percent) after pressure treatment. S. cerevisiae cells submitted to a hydrostatic pressure of 50 MPa for 30 min (empty bars) and 50 MPa for 30 min and then incubated at room pressure (0.1 MPa) for 15 min (filled bars), and after that, the fermentative efficiency of this strain was evaluated. A non-pressurised sample was used as a control (striped bars) (Error bars represent the SD of three measurements) (Bravim et al., 2013) _______________________________ 23 Figure 13 Effects of temperature on the induction of thermotolerance and piezotolerance. Logarithmic phase cells were suspended in fresh YM medium and incubated for 30 rain at various temperatures. Thermotolerance and piezotolerance are shown as % CFU of the untreated control. Symbols: o, incubated for 10 min at 51°C (thermotolerance); ●, incubated for 60 min at 150 MPa (piezotolerance)
(Iwahashi and Kaul, 1991). ____________________________________________________________ 23
Figure 14 Effects of hydrostatic pressure on cells. Heat-shocked (43 oC, 30 min) and control (30 oC, 30
min) cell suspensions in distilled water were subjected to increased pressure for 60 min. Piezotolerance is expressed as % CFU. Symbols: ●, heat-shocked; ▲, control (Iwahashi and Kaul, 1991) _________ 24 Figure 15 Representation of the four consequitive cycles of fermentaion under pressure __________ 27 Figure 16 - Calibration curve between OD600 nm and biomass concentration of S. cerevisiae _________ 30
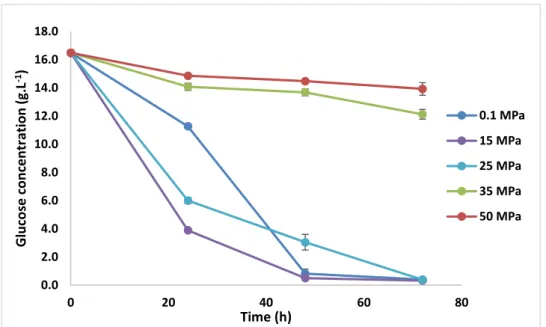
Figure 17. Glucose consumption over time, for fermentation by S. cerevisiae under different pressure conditions and at 30 ºC _______________________________________________________________ 31 Figure 18 Production of bioethanol over the fermentation time by S. cerevisiae under different pressure conditions and at 30 ºC _______________________________________________________ 33 Figure 19 Production of formic acid through the fermentation time by S. cerevisiae under different pressure conditions and at 30 oC _______________________________________________________ 34
Figure 20 Production of acetic acid through the fermentation time by S. cerevisiae under different pressure conditions and at 30 oC _______________________________________________________ 36
Figure 21 Biomass concentration through the fermentation time by S. cerevisiae under different pressure conditions and at 30 oC _______________________________________________________ 37
Figure 22 Final concentration of bioethanol after each of the four cycles of pressure and the four cycles at 0.1 MPa, at 30 ºC ____________________________________________________________ 41
Figure 23 Final concentration of formic acid after each of the four cycles of pressure and the four cycles at 0.1 MPa, at 30 ºC ____________________________________________________________ 43 Figure 24 Final concentration of acetic acid after each of the four cycles of pressure and the four cycles at 0.1 MPa, at 30 ºC ____________________________________________________________ 44 Figure 25 Final biomass concentration after each of the four cycles of pressure and the four cycles at 0.1 MPa, at 30 ºC ___________________________________________________________________ 46 Figure 26 Microbial load after each of the four cycles of pressure and the four cycles at 0.1 MPa, at 30ºC ______________________________________________________________________________ 47 Figure 27 Final concentration of bioethanol after each of the four cycles of pressure and the four cycles at 0.1 MPa, at room temperature __________________________________________________ 59 Figure 28 Final concentration of formic acid after each of the four cycles of pressure and the four cycles at 0.1 MPa, room temperature ____________________________________________________ 60 Figure 29 Final concentration of acetic acid after each of the four cycles of pressure and the four cycles at 0.1 MPa, at room temperature __________________________________________________ 62 Figure 30 Final biomass concentration after each of the four cycles of pressure and the four cycles at 0.1 MPa, at room temperature _________________________________________________________ 63 Figure 31 Microbial load after each of the four cycles of pressure and the four cycles at 0.1 MPa, at room temperature ___________________________________________________________________ 65
1. Introduction
1.1.Yeasts – General overview and the particular case of Saccharomyces
cerevisiae
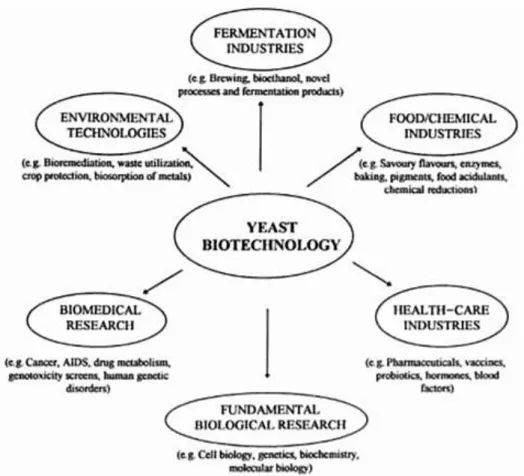
Yeasts are eukaryotic, unicellular microorganisms classified as members of the fungus kingdom. Although the meaning of the word ‘yeasts’ is not straightforwardly defined, yeasts are usually recognized as being unicellular fungi. More specifically, yeasts are ascomycetous or basidiomycetous fungi that reproduce vegetatively by budding or fission, resulting in sexual states that lead to different matte types (Pompon, 1999). Yeasts are of major economic, social and health significance in human culture. They have often been described as mankind’s oldest ‘domesticated’ organisms, having been used to produce alcoholic beverages and ferment bread dough for millennia. Nowadays, yeasts have found numerous other roles besides traditional food fermentations, being some examples represented in (Figure 1). In particular, genetically manipulated yeasts can now be exploited to produce many different biopharmaceutical agents for preventing and treating human diseases (Atkinson & Sherwood, 2014; Fox, Bellini, & Pellegrini, 2014; Pompon, 1999)
One particular genus of yeasts, named Saccharomyces, has played a central role in the commercial exploitation of fungi by mankind. These facultative aerobes utilize the Embden-Meyerhof pathway to convert sugars to pyruvate, which results in the production of two molecules of pyruvate. Each of these molecules are then reductively decarboxylated by the enzymes pyruvate decarboxylase and alcohol dehydrogenase to give rise to one molecule of ethanol and carbon dioxide. Therefore, the foundation for two of our major food industries, brewing and baking, was provided by this simple and efficient way of fermenting glucose into ethanol and carbon dioxide (Atkinson & Sherwood, 2014; Molitoris, 1995).
Figure 1 Diversity of channels involving yeasts biotechnology (Walker, 1998a)
1.2.Yeasts Metabolism
Yeasts metabolism refers to the biochemical assimilation and dissimilation of nutrients by yeasts cells. In nutrient assimilation, anabolic pathways involved in the nutrient assimilation are energy-consuming and reductive processes, which lead to the biosynthesis of new cellular material, such as proteins. On the other hand, catabolic pathways are oxidative processes, which remove electrons from intermediates and use them to generate energy, e.g. ATP. These reductive and oxidative processes are mediated by dehydrogenase enzymes which predominantly use NADP and NAD, respectively, as redox cofactors. These two processes cannot be independent, having some common compounds between both pathways. Figure 2 shows a general draft of the yeasts carbon metabolism (Walker, 1998b).
Figure 2 General overview of yeasts carbon metabolism (Walker, 1998b)
Yeasts are chemoorganotrophic microorganisms which derive their chemical energy from the breakdown of organic compounds, in the form of ATP. Despite the similarities between almost every metabolic pathway, there is some diversity in the way which yeasts generate and consume energy from carbon substrates. Depending on the strain, the primary carbon source can be different, since some yeasts use glucose, while others use glycerol, or many other different carbon sources (Walker, 1998b).
In the case of Saccharomyces cerevisiae, glucose is metabolized using the glycolysis pathway producing pyruvate as the first product. Pyruvate is then converted into acetaldehyde via enzymatic reaction by pyruvate decarboxylase and this reaction also leads to the re-oxidation of NADH to NAD+. Finally, the acetaldehyde produced is converted into ethanol via enzymatic catalysis by alcohol dehydrogenase (ADH).
The key regulatory enzymes in the glycolysis pathway, as represented in Figure 3, are phosphofructokinase and pyruvate decarboxylase, whose activity is influenced by numerous effectors, including ATP. The function of these two enzymes is, on one hand, to convert fructose 6-phosfate to fructose 1,6-biphosfate using a molecule of ATP, and,
on the other hand, to catalyse the decarboxylation of pyruvate into acetaldehyde and carbon dioxide, respectively (Walker, 1998b).
Figure 3 Metabolic pathway of ethanol fermentation in S. cerevisiae. Abbreviations: HK: hexokinase, PGI: phosphoglucoisomerase, PFK: phosphofructokinase, FBPA: fructose bisphosphate aldolase, TPI: triose phosphate isomerase, GAPDH: glyceraldehydes-3-phosphate dehydrogenase, PGK: phosphoglycerate kinase, PGM: phosphoglyceromutase, ENO: enolase, PYK: pyruvate kinase, PDC: pyruvate decarboxylase, ADH: alcohol dehydrogenase (Bai, Anderson, & Moo-Young, 2008)
In addition, the strains of yeasts are able to transfer pyruvate to the mitochondrial matrix, where is oxidatively decarboxylated into acetyl-coA using pyruvate dehydrogenase. After this, the acetyl-coA can enter on the Krebs cycle and produce a high amount of ATP via aerobic respiration.
1.3. Fermentation processes
The term fermentation is derived from the Latin verb fervere, which means “to boil”. This boiling appearance is the result of carbon dioxide release, resulting from the anaerobic metabolism of the microorganisms. This process has different meanings to biochemists and to industrial microbiologists: while for the first it means the use of organic compounds to produce energy, for the latter it has a much broader meaning, representing all the respiratory processes performed by cells (Stanbury, Whitaker, & Hall, 2013).
In general, fermentation is the process where substrates are converted into products, as a result of the growth and/or metabolic activities of microorganisms. There is a vast variety of fermentation processes used in food industry and microorganisms responsible for those processes, including bacteria, yeasts, and fungi.
During food fermentation, the growth of some pathogenic and/or spoilage microorganisms is inhibited by the metabolites generated by the fermenting organisms, which consequently extend the shelf life of perishable products. For example, during lactic acid fermentation, lactic acid bacteria may produce several of these metabolites, such as lactic acid, acetic acid, carbon dioxide, ethanol, hydrogen peroxide, bacteriocins, or antimicrobial peptides (Caplice & Fitzgerald, 1999; Di Cagno, Coda, De Angelis, & Gobbetti, 2013). These compounds synergistically suppress the survival and growth of pathogenic and spoilage microorganisms, extending the shelf-life of the fermented dairy products and allowing its preservation (Stanbury et al., 2013; Terefe & Food, 2016). In fact, this was the primary purpose of food fermentation in the past, when the utilization of processing technologies was poorly developed, but nowadays these processes are widely used due to the production of unique flavours, aromas and textures, corresponding to attributes appreciated by the consumer (Caplice & Fitzgerald, 1999).
Fermentation processes are sometimes simple, involving only one substrate component (e.g. lactose present in the milk) and one microorganism (e.g. Lactococcus
lactis), but sometimes these processes can involve a more complex mixture of substrates
and a number of microorganisms. For example, kefir, that possesses a wide diversity of microorganisms, namely: several yeasts, lactic acid (LAB), and acetic acid bacteria (Dimitrellou, Kandylis, Kourkoutas, Koutinas, & Kanellaki, 2015). Figure 4 is a general overview of the fermentation processes that are the most used in industry. Lactic acid
fermentation, above mentioned, uses lactic bacteria, Lactococcus lactis and Lactobacillus
lactis and produces most of our dairy products. On the other hand the acetic fermentation
uses some bacteria of the genera Acetobacter (Acetobacter oeni, Acetobacter
pasteurianus) or Escherichia coli to produce vinegar from wine, for example (Gullo &
Giudici, 2008; Wu, Ma, Zhang, & Chen, 2012). Propionic fermentation, used to propionic acid production, an important component in Swiss cheese, uses
Propionibacterium freudenreichii ssp. freudenreichii and Propionibacterium freudenreichii ssp. Shermanii, as the microorganisms responsible for the process
(O’Sullivan, McSweeney, Cotter, Giblin, & Sheehan, 2016; Salek, Černíková, Maděrová, Lapčík, & Buňka, 2016). Acetone–butanol–ethanol (ABE) fermentation is the process that uses bacterial fermentation to produce acetone, n-butanol, and ethanol from carbohydrates, using bacteria from the genera Clostridium (Clostridium acetobutylicum and Clostridium beijerinckii) (Cai et al., 2016). One other example of a fermentation process is alcoholic fermentation. This process uses some microorganisms, for example
S. cerevisiae, and sugar to produce ethanol. Ethanol has many uses, being used in food
industry to produce alcoholic beverages during alcoholic fermentation, in the medical industry as a disinfectant and it can also be used as bioethanol and produce fuel to be used in automobiles (Bajpai, 2013b; Dussap & Poughon, 2016)
1.3.1. Bioethanol production
Crude oil has been the major resource to meet the increased world energy demand, but it is not a renewable resource and is related to many environmental issues. However, during ethanol production, huge amount of with very high biological oxygen demand (BOD) and chemical oxygen demand (COD) is produced, which is discharged into the environment without proper treatment. So, the ethanol production using current distilleries is a potential source of environmental pollution and because of this, ethanol production process needs to be improved and optimized for an environment friendly, fast and cheap ethanol production (Arshad, Hussain, Iqbal, & Abbas, 2017). To reduce the dependence of crude oil, the use of bioethanol as an alternative fuel has been steadily increasing around the world (Bajpai, 2013a). Bioethanol is a clean, renewable and sustainable alternative fuel with several advantages and disadvantages when comparing to crude oil, presented in Table 1 (Bajpai, 2013b; Deesuth, Laopaiboon, Klanrit, & Laopaiboon, 2015; Deesuth, Laopaiboon, & Laopaiboon, 2016).
Chemical industry and chemical synthesis was until a few year ago the most common way to produce some compounds, including ethanol, but this industry has many safety and environmental problems. Recently, the chemical industry has been subjected to close scrutiny owing to concerns about its reliance on fossil resources; environmentally damaging production processes that can be unsafe and produce toxic products and waste; products that are not readily recyclable and degradable after their useful life; and excessive regional concentration of production so that social benefits of production are less widely available (Davies & Ni, 2006; Wansink & Kim, 2000). Because of this, the industry has been under increasing pressure to change current working practices in favour of greener alternatives (Davies & Ni, 2006; Hatti-Kaul, Törnvall, Gustafsson, & Börjesson, 2007; Miller & Nagarajan, 2000). One example is green chemistry that is focused on the designing of products and processes that minimize the use and generation of hazardous substances. One example is the utilization of biotechnological processes.
Bioethanol is one of the products that is being produced by industrial biotechnology (OECD, 2001). This product can be produced by biotechnological processes using an enormous variety of raw materials that include not only plants. Initially, the most used substrate was sugarcane and corn, producing the so called first generation bioethanol. However, despite the high bioethanol yield obtained with these
substrates, their use started to be a concern due to the used of arable soil to produce bioethanol (ActionAid, 2010; Berlin (AFP) Staff writers, 2008; Wansink & Kim, 2000). Nowadays, sweet sorghum and waste water have been increasingly used to produce bioethanol (Bai et al., 2008; Deesuth et al., 2015, 2016; El-Dalatony et al., 2016; Tantipaibulvut et al., 2015). Additionally, agricultural, forestry and municipal solid waste can also be used for bioethanol production.
1.3.1.1. Bioethanol production by Saccharomyces cerevisiae
S. cerevisiae is by far the most commonly used microbial species for industrial
production of ethanol from sugar- and starch-based raw materials, tolerating a wide spectrum of inhibitors and elevated osmotic pressure. Regarding to ethanol production, it occurs with high yields (Bajpai, 2013b; Martín, Galbe, Wahlbom, Hahn-Hägerdal, & Jönsson, 2002). In that way, S. cerevisiae is an efficient microorganism for producing ethanol from hexose sugars. However, during the fermentation process, yeasts cells are exposed to numerous environmental stresses, leading to countless intracellular changes that affect biomass production, fermentation efficiency and cell viability (Teixeira, Mira, & Sá-Correia, 2011). In fact, yeasts undergoing fermentation are challenged with osmotic stress, high temperature and high ethanol concentration (Pataro et al., 2000).
For instance, the initial sugar concentrations typically used in fuel ethanol industry are under normal gravity (NG, i.e. less than 180 g.L−1 of total sugar) or high gravity (HG,
i.e. 180–220 g.L−1 of total sugar) conditions. But, in order to increase the ethanol fermentation efficiency, very high gravity (VHG) technology may be used, resulting in the improvement of ethanol productivity and consequently increase the cost effectiveness. This VHG ethanol fermentation uses medium containing sugar in excess of 250 g.L−1 to achieve over 15% (v) ethanol (Bai et al., 2008). However, the fermentation under high sugar content or VHG conditions may cause adverse effects on yeasts metabolism because of the high osmotic pressure and high ethanol concentrations produced (Pratt, Bryce, & Stewart, 2003).
Figure 5 shows a model flow diagram of a Brasilian sugarcane-ethano producer. In this model sugercane is firstly used to produce sugar and then the sugarcane residues molasses are used to produce ethanol in a integrated manner. This way of obtaing ethanol
energy is used, the quality of the products is better, and the yields attained are greater (stoichiometric ethanol yield of 91%), with lower costs (about US$0.20/liter ethanol). Futhermore, this enables the waste reduction of both industries, ethanol and sugar industries (Cortez & Baldassin, 2016; Monteiro Salles-Filho, 2016).
Figure 5 Flow diagram of the sugar-ethanol and electricity industrial production model used in Brazil. Adapted from (Cortez & Baldassin, 2016)
1.4.Stress and adaptation
Stress factors and responses are mechanisms that can reduce or improve the cell viability, respectively. When exposed to stressful conditions microorganisms may produce different reactions. Some are unable to withstand and adapt to these conditions and die; while others are able to survive when less extreme conditions are applied (sub-lethal levels) due to the activation of specific mechanisms of stress response and consequently adaptation to the new conditions (H. Huang, Lung, Yang, & Wang, 2014; Lado & Yousef, 2002).
In this section, some of the most common stress factors that influence cell viability and growth will be discussed, including temperature, pH, water activity, pressure and exposure to toxic substances like antibiotics (Bereksi, Gavini, Bénézech, & Faille, 2002; Imlay & Linn, 1987; Jydegaard-Axelsen, Aaes-Jørgensen, Granly Koch, Stoumann
Jensen, & Knøchel, 2005). In addition, some of the stress responses used by cell to improve their resistance to these stress factors will be also mentioned, including production of heat shock proteins (HSP), modification of fatty acids and modulation of genes.
In general, microorganisms develop different defences to withstand these adverse conditions, increasing their resistance to harsh conditions and sudden environmental changes. Therefore, when bacteria and yeasts are exposed to moderate levels of stress, particular stress responses are triggered, which may involve genetic or physiological changes that allow the increased tolerance when they are subsequently submitted to higher levels of the same stress or even another stresses, like cross-protection and general stress response (GSR). There are many physiological modifications that allow bacteria and yeast to adapt to adverse conditions, such as the modification of membrane fatty acid composition or the production of specific proteins, such as the HSP (Malone, Shellhammer, & Courtney, 2002).
Figure 6 shows some of the most common pathways of stress responses. For each stressful condition, there are activation or deactivation of sets of genes, which makes the yeasts stress response a complex genetic response and not only a physiological response (Rantsiou et al., 2012).
Figure 6 Main signalling pathways controlling the yeasts adaption response to food-relevant stresses. The cross walk between stress responses was not considered (Rantsiou et al., 2012)
1.4.1. Production of heat shock proteins
A wide variety of stresses, such as high temperature, starvation, high pressure, water activity and pH, are conditions that usually repress the synthesis of the most cellular proteins, and in some cases may induce the production of heat shock proteins (HSPs).
Therefore, several of these HSPs play vital roles in cell growth under these conditions as well as in stress tolerance. Despite their diversity in structure, these proteins have a similar functionality: in general, HSPs promote the folding and unfolding of other proteins, the assembly and disassembly of proteins in oligomeric structures, and the degradation of proteins that are improperly assembled or denatured (Aertsen et al., 2004). Regarding HP adaption, many in vitro studies with purified proteins and membrane vesicles have indicated protein denaturation may occur due to pressure increase, affecting the membrane fluidity (Balny, Masson, & Heremans, 2002; Heremans & Smeller, 1998).
In a study made by Aertsen and his collaborators (Aertsen et al., 2004), the induction of several heat shock genes after exposure to sub-lethal pressures was demonstrated, which were therefore responsible for the production of HSPs.
1.4.2. Other stresses during fermentation
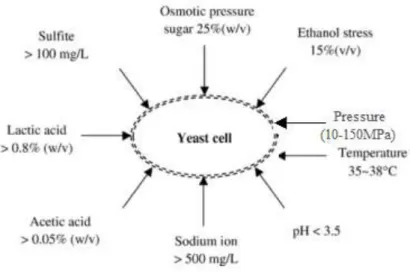
During fermentation, bacteria and yeasts cells must respond to fluctuations in dissolved oxygen concentration, pH, osmolarity, ethanol concentration, nutrient supply and temperature. Thus the capacity to survive is dependent on their ability to adapt to these changes (Gibson, Lawrence, Leclaire, Powell, & Smart, 2007). In Figure 7, some of the stress factors that yeasts cells are subjected during fermentation are summarized.
Figure 7 Potential environmental stresses on S. cerevisiae during ethanol fermentation. (Adapted from Bai et al., 2008)
Throughout fermentation, S. cerevisiae is exposed to stressful conditions and produces a temporary response by reprogramming the cellular activities to ensure its survival in these conditions, protecting the essential cell components and allowing the continuation of the ‘normal’ cellular activities during its recovery. These responses to environmental stress are complex, involving various aspects: i) cell identification; ii) signal transduction; iii) transcriptional and posttranscriptional control; iv) protein-targeting; v) accumulation of protectants; and vi) increased activity of repair functions (Mager & Ferreira, 1993). These responses are essentially produced by two major stress response pathways. One of those is the production of heat shock response, mediated by the so-called heat shock transcription factor, which is activated essentially by sublethal heat stress but also by different kinds of stresses such as pressure and ethanol stress. The other is the general (or global) stress response which is activated by a number of environmental stresses including oxidative, pH, heat, pressure and osmotic stresses, as well as nitrogen starvation (Chatterjee, Khalawan, & Curran, 2000).
Ethanol is one of the products of the alcoholic fermentation and represents one stress factor for the yeasts cells, affecting the cell viability and growth, cell metabolism and cell structure and membrane function. In Table 1, some of these effects on yeasts physiology are described.
Table 1
Some effects of ethanol on yeasts physiology (Adapeted from Stanley, Bandara, Fraser, Chambers, &
Stanley, 2010)
Cell viability and growth
Inhibition of growth, cell division and cell viability;
Decrease in cell volume;
Metabolism
Lowered mRNA and protein levels;
Protein denaturation and reduced glycolytic enzyme activity;
Induction of heat shock proteins and other stress response proteins;
Intracellular trehalose accumulation ;
Cell structure and membrane function Altered vacuole morphology;
Inhibition of endocytosis;
Increased unsaturated ⁄saturated fatty acid ratio in membranes;
Increase in ergosterol content of membranes
Loss of electrochemical gradients and proton-motive force
Inhibition of transport processes
Inhibition of H+-ATPase activity
Increased membrane fluidity
When exposed to ethanol, yeasts cells synthesize a large range of HSPs, which include Hsp104 and Hsp12. These HSPs have been shown to physiologically influence yeasts tolerance to ethanol. Hsp104 acts as a remodelling agent in the disaggregation of denaturated proteins while Hsp12 is a membrane-associated protein that can protect liposomal membrane integrity against desiccation and ethanol. However, there are other studies that report other genes that are highly activated during ethanol stress. (Stanley et al., 2010).
Temperature and pressure are other possible stresses, being some of the effects on cells similar to the ethanol stress ones mentioned above, thus the mechanisms of response are also similar (Gibson et al., 2007).
High osmotic pressure is another stressful condition that results from fermentation causing the decrease of fermentation rate and yield (Casey, Magnus, & Ingledew, 1984).
Osmotic pressure is the force between two solutes of differing concentration separated by a semi-permeable membrane, being higher with the higher difference in the solute concentrations. Yeasts respond to the effects of osmotic pressure in the growth medium in many ways. One of the ways to respond is to alter the cell volume, i.e. decreasing volume in response to hypertonic stress and increasing volume in the presence of hypotonic stresses. In S. cerevisiae, the membranes are relatively elastic and weakly shielded against water loss and, therefore, it is expected differences in cytoplasmic volume under external osmotic pressures (Pratt et al., 2003; Rantsiou et al., 2012; Teixeira et al., 2011). When subjected to high osmotic pressure, yeasts cells use the HOG (High Osmolarity Glycerol) pathway in order to preserve its internal volume constant (Teixeira et al., 2011). This pathway mediates the most significant part of the response of yeasts cells to a hyperosmotic shock. For it to work, it is required the stimulated expression of more than 100 genes that include GPD1 and GPP2, which encode enzymes involved in the production of glycerol, the main osmolyte accumulated by yeasts cells (Tamás, Rep, Thevelein, & Hohmann, 2000).
1.4.3. Fermentation using non-conventional conditions
Besides the normal stresses that occur during fermentation some other stresses can be produced depending of the conditions. Those stresses can be produced during fermentation using non-conventional conditions.
Recently, several non-conventional conditions are being tested for the improvement of microbial fermentations and positive results were achieved in the stimulation of microbial growth and fermentation despite the fact that stressful conditions are being used (Chisti, 2003; Mattar et al., 2015; Mota, Lopes, Delgadillo, & Saraiva, 2013; Shikha Ojha, Mason, O’Donnell, Kerry, & Tiwari, 2016). This concept emerged from the need to improve the yield and productivity values of relevant microbial fermentations. Therefore, several emerging technologies are being tested for the improvement of microbial fermentations. The non-conventional conditions already used implicate technologies commonly applied for food pasteurization, including high Pressure (HP), pulsed electric fields (PEF), moderate electric fields (MEF) and ultrasound (US). However, these technologies should be applied at sub-lethal levels, in order to affect the behaviour of microbial strains involved in fermentation, but not causing their destruction (Mattar et al., 2015).
Using these sub-lethal conditions, it is possible the development of specific genetic, physiologic and metabolic stress responses by microbial strains, opening the possibility to obtain fermentation products and processes with different characteristics (H.-W. Huang, Lung, Yang, & Wang, 2014; Mills, Stanton, Fitzgerald, & Ross, 2011). In some cases, these modifications can represent significant improvements, such as increased yields, productivities, and fermentation rates, lower accumulation of by-products and/or production of different compounds (Serrazanetti, Guerzoni, Corsetti, & Vogel, 2009; Shikha Ojha et al., 2016). Therefore, those results are not only relevant for food fermentations (e.g. for the production of dairy products, alcoholic beverages, and others), but also may be valuable to industry for production of commodity bio-chemicals (such as acetic acid, citric acid, and ethanol) and high-value bio-products (such as vitamins, antibiotics, and biopolymers (Mattar et al., 2015; Ojha, Mason, O’Donnell, Kerry, & Tiwari, 2017; Puértolas, López, Condón, Álvarez, & Raso, 2010; Sinisterra, 1992).
Some studies reported on the literature about this approach are summarized below, including details about the fermentative process, the applied technology and the results obtained in each case. The technology of High Pressure will be discussed in a specific chapter of this work, since is the basis of this thesis.
1.5.High pressure (HP) technology
Pressure, like temperature, is an important thermodynamic parameter that affects molecular systems. According to the Le Chatelier and Braun principle, pressure affects biological and chemical systems towards a volume reduction. Therefore, the reaction equilibriums are shifted towards the most compact state. As a fundamental principle, any change in a biochemical reaction involves a change in free energy. This change in Gibbs energy is a function of pressure and temperature, and is governed by the change in volume and entropy. Since the temperature is assumed to be constant during pressure processing, the pressure dependence of the Gibbs energy is given by the volume change (Bolumar, Georget, & Mathys, 2015; Yaldagard, Mortazavi, & Tabatabaie, 2008).
In this process, all pressure effects arise from a single influence, namely the change in system volume that occur in the environment and that is accompanied by a physiological or biochemical alteration of living cells. High pressure exerts many effects on living organisms, making it difficult to pinpoint the pressure-points in cell growth and
viability. Most in vivo observations on living cells exposed to HP can be linked to these two effects: inhibition of key enzymes, and inactivation of cellular structures and processes, including transcription, ribosomes structure, microtubules and membrane proteins, and structural and functional disruption of cell membrane (Considine, Kelly, Fitzgerald, Hill, & Sleator, 2008; Rendueles et al., 2011). Remarkable differences exist in the pressure sensitivity among bacterial species, and several groups have reported the isolation of mutants with acquired HP resistance (Bartlett, 2002a).
1.5.1. Effects of HP on microorganisms
Cell membranes are the primary sites of pressure-induced damage, with consequent alterations of cell permeability, transport systems, loss of osmotic responsiveness, organelle disruption and inability to maintain intracellular pH (Malone et al., 2002; Rendueles et al., 2011).
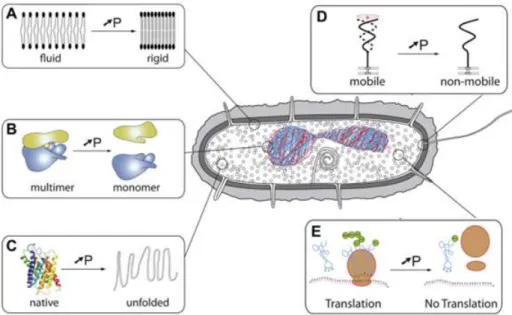
Together with the alteration of the membrane, protein denaturation and changes in the active centres have also been observed after HP treatments together with changes in enzyme-mediated genetic mechanisms, such as replication and transcription. In Figure 8, some of the effects of HP on cells and cellular components are described.
Figure 8 Examples of the effects of high hydrostatic pressure on cells and cellular components. A: lipids in membranes; B: multimeric protein assemblages, C: protein structure; D: cellular motility;
1.5.1.1. Effects on DNA
Certain levels of HP affect relevant cellular processes, mostly due to changes in DNA structure. For instance, HP stabilizes the DNA hydrogen bonds and assembling interactions. Those “new” and more stable hydrogen bonds increase the duplex to single-strand transition temperature, e.g. the melting temperature. As a consequence, DNA is stabilized by increasing the pressure so, the double- to single-strand transition necessary for replication/transcription/translation processes may become more difficult, hindering the development of new molecules and cells (Macgregor, 2002). Moreover, the functionality of genetic materials in microorganisms such as DNA replication and gene transcription is also negatively affected because the activity of the DNA replication and transcription enzymes is reduced. In addition, the chromosomal DNA produced through excision of DNA and nucleic acid enzymes is degraded by pressure as a result of the condensation of the genetic material (H.-W. Huang et al., 2014).
1.5.1.2. Effects on membranes
In membranes, lipids are particularly sensitive to pressure effects because they are compressed more easily than membrane proteins. Therefore, when the pressure increases bacterial membranes compress causing a reduction in the intermolecular distance between acyl chains and membrane lipids. This process causes a leak in the membrane, leading to eventual cell death. Additionally, pressure increases the cell wall hydrolase activity in some microorganisms, leading to an increased permeability that can also lead to cell death (Malone et al., 2002). Besides that, increasing the pressure enhances the order of hydrocarbon chains, raises the temperature of membrane phase transition from the gel state to the liquid crystalline state and increases bilayer toughness by reducing the curvature of acyl chains(Bartlett, 2002a).
Furthermore, several studies have shown that HP changes the membrane fatty acids composition. For example, the increase in pressure in Photobacterium profundum strain SS9 increases the proportion of both monounsaturated fatty acid 18:1, cis-vaccenic acid, and polyunsaturated fatty acid 20:5, eicosapentaenoic acid (Figure 9).
Figure 9 Effect of culture pressure on the proportion of the major fatty acid species in the deep-sea bacterium
Photobacterium profundum strain SS9 (Bartlett, 2002a).
In addition to membrane lipids, membrane proteins have frequently been implicated as playing an important role in the growth under pressure. ATPase and tryptophan permease were subject to some works that suggested that these membrane protein have a limited the growth in some microorganisms when subject to pressure (Bartlett, 2002b).
At a pressure of 100 MPa, lipid bilayer loses fluidity and occurs a reversible conformational change in transmembrane proteins that leads to functional disorder of membrane bound enzymes. A reversible phase transition in parts of the lipid bilayer (which passed from the liquid crystalline to gel phase) was observed at pressures of 100– 220 MPa, as well as dissociation and/or conformational changes in the protein subunits. This could cause the separation of protein subunits and gaps between protein and lipid bilayer, creating transmembrane tunnels. When pressures higher than 200 MPa were applied, an irreversible destruction and fragmentation of the membrane structure occurred due to protein unfolding and interface separation (Campus, 2010).
1.5.1.3. Effects on proteins
HP does not affect the primary structure of proteins (sequence of amino acids) because the ranges of pressure usually applied does not change the energy of covalent bonds. Pressure acts predominantly on the conformation and supramolecular structures of biomolecular systems, and thus, on their functionality in the cells (Oger & Jebbar, 2010b). However, some modifications may occur in the sulphydryl groups and thiol-disulphide interchange reactions (Funtenberger, Dumay, & Cheftel, 1997), and thus, secondary, tertiary and quaternary structures were affected, which have effect on the
protein unfolding and eventually cause denaturation (Campus, 2010; Moreirinha, Almeida, Saraiva, & Delgadillo, 2016).
Studies have shown that HP stabilizes hydrogen bonds and enhances the breaking of salts, which leads to a decrease in volume (Campus, 2010; Norton & Sun, 2008). Also, modifications of the electrostatic and hydrophobic interactions, that are the major forces maintaining the tertiary structure, are accompanied by large hydration changes. This is assumed to be the primary source of the decrease in volume associated with denaturation of proteins (Moreirinha et al., 2016; Norton & Sun, 2008).
There are also some studies that report the possibility of HP activate or inactivate enzymes, depending on the enzyme’s inherent ability to withstand pressure stress. The enzymes responsible for the synthesis of ATP, after being deactivated, collapse from the cell membrane, reducing ATP synthesis. In addition, HP can also denature functional proteins and lead to a limited proton flow, reducing the intracellular pH (H.-W. Huang et al., 2014; Tholozan, Ritz, Jugiau, Federighi, & Tissier, 2000).
1.5.2. High pressure adaptation
When the subject is pressure resistance and sensitivity, there are essentially two types of microorganisms. Ones that live in the surface, such as E. coli and S. cerevisiae, that cannot normally grow at pressures higher than atmospherical pressure, and the others, the piezophiles, which live in HP environments, including the deep ocean, hydrothermal vents, the sub-seafloor and the continental underground, and have optimal growth rates at pressures greater than 0.1 MPa (Oger & Jebbar, 2010b). The ability of piezophiles to grow under these pressure levels (inhibitory to surface organisms), and the inability of obligate piezophiles of growing at atmospheric pressure can be a proof that piezophiles have adapted to HP in the course of their evolution. To explain their ability to grow under HP, three main mechanisms have been proposed: i) fine tuning of overall gene expression to compensate for loss of biological activity; ii) expressing of HP-specific genes; iii) adaptation of the structure of biomolecules to withstand HP (Campanaro et al., 2005; Chilukuri & Bartlett, 1997; Kato & Qureshi, 1999).
Mesophilic microorganisms, such as S. cerevisiae, cannot normally grow under pressure due to its sensitivity. However, in some cases these microorganisms are able to grow under these stress conditions due to the development of mechanisms to improve
pressure resistance. Some of these mechanisms are very similar to those used by piezophiles, however without having the same efficiency (Oger & Jebbar, 2010a).
1.5.3. Saccharomyces cerevisiae under HP
HP can exert a broad range of effects on microorganisms with similar characteristics to those of other environmental stresses, such as high temperature, ethanol and oxidative stresses. The HP response of wild S. cerevisiae shows high correlation with that resulting from increased ethanol concentration or high-temperature stresses (Bravim et al., 2013). For instance, Iwahashi et al (1991) demonstrated that a mild heat shock pre-treatment (43 °C for 30 min) increased the resistance to HP, leading to an increase in cell viability of S. cerevisiae at 150 MPa. In addition to prior heat shock treatment, the addition of cryoprotectants (dimethylsulfoxide, Me2SO) and deuterium oxide may also
provide protection for pressure damage. These findings imply that the damage by HP may be similar to that of high temperature (Iwahashi & Kaul, 1991).
Additionally, S. cerevisiae cells were submitted to a mild sub-lethal pressure treatment (50 MPa for 30 min) followed by a short recovery at atmospheric pressure (0.1 MPa) and an increase in the tolerance to heat, ultra-cold shock and high-pressure treatments was observed (Palhano, Gomes, Orlando, Kurtenbach, & Fernandes, 2004). After HP treatment (200 MPa for 30 min) S. cerevisiae gene expression was profiled, showing that most of the upregulated genes were involved in stress defence and carbohydrate metabolism, while most of the repressed genes were involved in cell cycle progression and protein synthesis. This indicates that pressure application causes a reduction in yeasts cell cycle progression and protein synthesis, causing a loss of cell viability. Still, Miura et al. (2006) demonstrated that upregulated genes are not always responsible for the piezotolerance, which shows the great complexity of this subject (Miura, Minegishi, Usami, & Abe, 2006). One mechanism developed by S. cerevisiae is the adjustment of its genomic expression pattern under HP. This effect was studied by Fernandes et al., 2004 using whole genome microarray hybridization and some of the results can be observed in Figure 10. As it can be seen, most of the genes that are overexpressed under pressure are still unknown, however the genes that are repressed are, for example, related to protein synthesis and cell cycle.
Figure 10 Global gene expression profile in functional categories. Black bars and white bars represent the percentage of induced and repressed genes, respectively (Fernandes et al., 2004).
In another work, fermentation was carried out using a wild-type yeast isolate and the measurement of ethanol production was performed before and after the pressure treatment (50 MPa for 30 min at room temperature), followed by incubation for 5, 10 and 15 min at atmospheric pressure. The HP treatment led to an increase in ethanol content upon fermentation. In parallel, a global transcriptional analysis was conducted to identify genes induced by HP. In this study it was demonstrated that the production of ethanol was enhanced for the wild-type yeasts strain, most likely due to the over-expression of some genes that are responsible for tolerance to stress (Bravim et al., 2013).
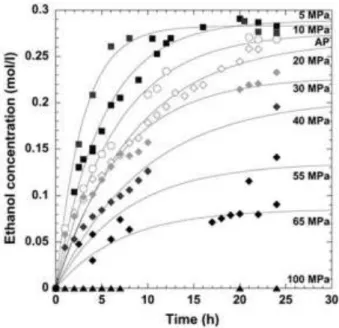
In other work, Picard et al. (2007) monitored alcoholic fermentation performed by
S. cerevisiae under HP in the range of 0.1 and 100 MPa. In all experiments, the stationary
phase was reached (Figure 11) and apparently an increasing amount of glucose was being used for cell maintenance and thus less glucose was available for fermentation. Regarding ethanol production over fermentation time, the authors observed that the reaction rate increased significantly as pressure increased up to 10 MPa, with fermentation occurring faster at 5 and 10 MPa than at atmospheric pressure and the ethanol production being slightly enhanced (3–4%). While the estimated final concentration of ethanol produced at atmospheric pressure was 90% of the theoretical maximum, at 5 MPa the fermentation yield was enhanced by 6%, corresponding to the maximal ethanol production. On the other hand, above 20 MPa the process was slowed down with the increasing pressure, and it was estimated that at 87 ± 7 MPa the alcoholic fermentation was interrupted. The
authors suggested that the activity of one or more enzymes involved in the glycolytic pathway may be enhanced at HP up to 10 MPa, becoming progressively repressed with the increasing pressure, until its complete loss of activity. Since phosphofructokinase (a key enzyme in glycolytic pathway) is inhibited due to the pressure induced acidification at ≈50 MPa, some authors predicted that the fermentation would stop at this range of pressures (Abe & Horikoshi, 1995). However, the above discussed study of Picard and collaborators revealed that the alcoholic fermentation is only interrupted at pressures as high as 87 MPa (Picard, Daniel, Montagnac, & Oger, 2007).
.
Figure 11 Kinetics of ethanol production as a function of pressure to 100 MPa (Picard et al., 2007)
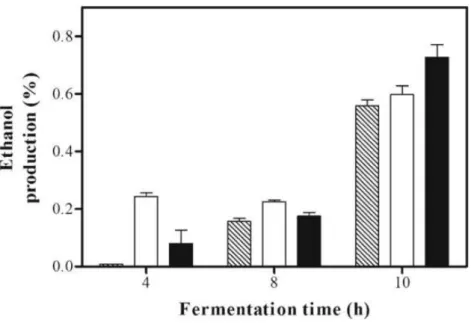
Another study used a pressure of 50 MPa on alcoholical fermentation to evaluate the prodution of ethanol in these conditions (Bravim et al., 2013). Two different treatments were tested: one of them 50 MPa for 30 min and the other was subjected to the same treatment but then incubated at atmospheric pressure for 15 min (50+0.1 MPa). As a control sample, a non-pressurised sample (0.1 MPa) was used (Bravim et al., 2013). In this work, it was demonstrated that putting the culture medium over 0.1 MPa, after the fermentation and after initial treatment at 50 MPa, enhanced the quantity of ethanol produced. For the short fermentation times (4 and 8 h) that was not verified, obtaining a higher concentration of ethanol in the treatment using only the HP treatment, as shown in
Figure 12 Ethanol production (in percent) after pressure treatment. S. cerevisiae cells submitted to a hydrostatic pressure of 50 MPa for 30 min (empty bars) and 50 MPa for 30 min and then incubated at room pressure (0.1 MPa) for 15 min (filled bars), and after that, the fermentative efficiency of this strain was evaluated. A non-pressurised sample was used as a control (striped bars) (Error bars represent the SD of three measurements) (Bravim et al., 2013)
Another study on this subject tested the adaptation of cells to pressures of 150 MPa for 60 min, after a temperature shock using temperatures from 30ºC to 51ºC. Figure 13 shows the effect of the heat shock temperature on the induction of thermotolerance and piezotolerance. Tolerance was greatly increased when the treatment at 40-43°C was applied, with the most effective temperature being 43 °C, in both cases.
Figure 13 Effects of temperature on the induction of thermotolerance and piezotolerance. Logarithmic phase cells were suspended in fresh YM medium and incubated for 30 rain at various temperatures. Thermotolerance and piezotolerance are shown as % CFU of the untreated control. Symbols: o, incubated for 10 min at 51°C (thermotolerance); ●, incubated for 60 min at 150 MPa (piezotolerance) (Iwahashi and Kaul, 1991).
The results of this study suggest that, when subjected to temperature shocks of 40-43ºC prior to the pressure test, cells exhibit an enhanced piezotolerance, with a more considerable effect at 43ºC (Iwahashi & Kaul, 1991). Those results are confirmed in Figure 14, where a significant increase in the survival of cells was observed when the cells are incubated under HP (100-200 MPa) after the pre-incubation at 43°C for 60 min. The results show that the prior heat shock treatment induces the piezotolerance of the thermally-treated strains, compared to the control ones. This suggests that high pressure and high temperature have similar physiological effects on yeasts and share some of the stress response mechanisms.
Figure 14 Effects of hydrostatic pressure on cells. Heat-shocked (43 oC, 30 min) and control (30 oC,
30 min) cell suspensions in distilled water were subjected to increased pressure for 60 min. Piezotolerance is expressed as % CFU. Symbols: ●, heat-shocked; ▲, control (Iwahashi and Kaul, 1991)
2. Objectives of the work
Considering the potential of HP to improve alcoholic fermentation, the main goal of the present work was to study the adaptation of S. cerevisiae to HP and to understand how pressure will affect both cell viability and fermentation. We intended to acquire pressure adaptation using consecutive cycles of fermentation under sub-lethal pressure. In this work, S. cerevisiae cultures performed fermentation under pressure and after that first cycle, viable cells were isolated and used as inoculum to carry out other fermentation cycle at the same conditions. As reported in literature, these consecutive cycles of fermentation under HP will be responsible for the development of adaptation mechanisms. For now, the information available in literature about this topic is still very limited and unspecific about the mechanisms of adaptation and the enhanced productivity of bioethanol during the fermentation. Although some studies have already been performed, the objective of this work is not exactly the same, making this a novel topic of study because its objective is not to enhance the fermentation yield in one pressure cycle the others previous projects but is to promote the adaptation of the S. cerevisiae to those conditions.
S. cerevisiae was chosen for this study due to its great importance in many industries,
including food and fuels industry. In addition, this yeast is one of the most studied microorganism and because of that it can be used as a model of the influence of HP on biotechnological processes relevant to industry.
During this work, only sub-lethal pressures (between 15-50 MPa) were applied to study the effects on growth, adaptation and production of bioethanol without compromising the cell viability. For that, several physical-chemical and microbiological analyses were performed to determine the concentration of cells and monitoring the fermentation, including the measurement of optical density, cell dry weight, and concentrations of sugars (glucose, fructose and maltose), ethanol, acetic acid and formic acid. With the obtained results, different kinetic parameters were determined, including glucose consumption (%), Yield of bioethanol, formic acid, acetic acid and biomass production, in order to better understand and quantify the effects of HP on this fermentation process.
3. Materials and Methods
3.1.Microorganism
S. cerevisiae DSMZ 70468 was chosen due to its highly efficient ethanol production
capabilities. A lyophilized culture was bought from DSMZ – a German collection of microorganisms and cell cultures. This strain was cultured according to the manufacturer’s instructions, and sub-cultured on Yeast Malt agar plates, subsequently incubated at 30 ºC for 48 h.
3.2.Inoculum preparation
A seed culture was prepared by inoculating a single colony in 100 mL of sterile culture medium (Yeast malt broth) containing 5.00 g/L of peptic digest of animal tissue (peptone), 3.00 g/L of yeast extract, 3.00 g/L of malt extract and 10.00 g/L of dextrose. The culture was incubated at 30 oC and 150 rpm for 18 h. The inoculum was ready to use when the optical density of the solution was 0.8 at 600nm.
3.3.Fermentation under high pressure
The inoculated medium was homogenized and then transferred to a heat sealed plastic bag (11 cm x 3.5 cm), designed to withstand HP conditions. All these steps were performed in an aseptic environment, within a laminar flow cabinet, to avoid sample contamination. Fermentation only occurs under oxygen limiting conditions, since S.
cerevisiae is a facultative anaerobe, which can produce energy in the presence of oxygen,
being this the preferable pathway over the conventional respiration. Because of this the samples to be used will be sealed with the minimum level of oxygen possible promoting fermentation over aerobic respiration.
Fermentations were then performed at 15, 35 and 50 MPa, at 30 ºC, for 24h or 48h. These experiments were conducted using the HP equipment with a capacity of 2 L and the other in High Pressure System U33, Unipress Equipment, Poland, own by the Chemistry Department of University of Aveiro. This equipment has a pressure vessel of 35 mm diameter and 100 mm height surrounded by an external jacket, connected to a thermostatic bath to control the temperature, using a mixture of propylene glycol and
water as pressurizing fluid and to control the temperature in the external jacket. As a control, fermentation was also performed at 0.1 MPa (atmospheric pressure), keeping all conditions equal to the conditions for fermentation under HP. Samples were collected throughout the fermentation time, and each experiment was run in duplicate.
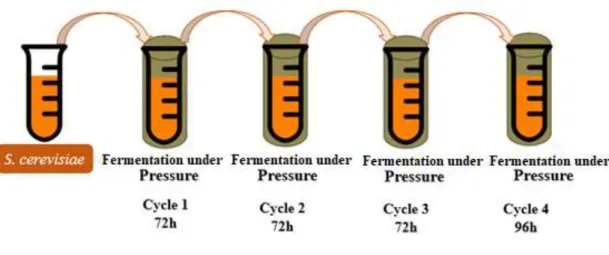
3.4.Consecutive cycles of fermentation under high pressure
Fermentations were performed during four consecutive high pressure cycles (figure 15). The first three pressure cycles had a fermentation time of 72 h and the last one was 24 h longer than the rest, corresponding to a fermentation time of 96 h. These experiments were conducted using 3 different HP equipment’s. One with the capacity of 100 mL (System U33, Unipress Equipment, Warsaw, Poland), the other with a capacity of 2 L and the last one with no temperature control for the second experiments SFP FPG13900 (Stansted Fluid Power Ltd, Essex, UK). This equipment consists of 3 vessels, each pressure vessel 37 mm in diameter and 52 cm in height, using as a pressurizing fluid a mixture of propylene glycol and water (40:60). Furthermore, the experiments were performed at different pressure conditions (15, 35 and 50 MPa) and different temperature conditions (at controlled temperature of 30 ºC, and at naturally variable room temperature). As a control, fermentation was also performed at 0.1 MPa (atmospheric pressure), keeping all conditions equal to the conditions for fermentation under HP.