This article was published in Computers in Biology and Medicine, 67, 104-115, 2015 http://dx.doi.org/10.1016/j.compbiomed.2015.09.020
Development of an automatic identification algorithm for
antibiogram analysis
Luan F.R. Costa a, Eduardo S. da Silva b, Victor T. Noronha b, Ivone Vaz-Moreira b,c, Olga C. Nunes b, Marcelino M. de Andrade a
a LIPIS – Laboratory of Instrumentation, Image and Signal Processing, Gama
Campus, University of Brasília, Brazil
b LEPABE – Laboratory for Process Engineering, Environment, Biotechnology
and Energy, Faculty of Engineering, University of Porto, Portugal
c CBQF – Centro de Biotecnologia e Química Fina – Laboratório Associado,
Escola Superior de Biotecnologia, Universidade Católica Portuguesa, Portugal
Abstract
Routinely, diagnostic and microbiology laboratories perform antibiogram analysis which can present some difficulties leading to misreadings and intra and inter-reader deviations. An Automatic Identification Algorithm (AIA) has been proposed as a solution to overcome some issues associated with the disc diffusion method, which is the main goal of this work. AIA allows automatic scanning of inhibition zones obtained by antibiograms. More than 60 environmental isolates were tested using susceptibility tests which were performed for 12 different antibiotics for a total of 756 readings. Plate images were acquired and classified as standard or oddity. The inhibition zones were measured using the AIA and results were compared with reference method (human reading), using weighted kappa index and statistical analysis to evaluate, respectively, inter-reader agreement and correlation between AIA-based and human-based reading. Agreements were observed in 88% cases and 89% of the tests showed no difference or a o4 mm difference between AIA and human analysis, exhibiting a correlation index of 0.85 for all images, 0.90 for standards and 0.80 for oddities with no significant difference between automatic and manual method. AIA resolved some reading problems such as overlapping inhibition zones, imperfect microorganism seeding, non-homogeneity of the circumference, partial action of the antimicrobial, and formation of a second halo of inhibition. Furthermore, AIA proved to overcome some of the limitations observed in other automatic methods. Therefore, AIA may be a practical tool for automated reading of antibiograms in diagnostic and microbiology laboratories.
1.
Introduction
Microbiologists play an important role in identifying the drugs that will be most effective in the treatment of clinical infections, as well as in defining the antibiotic resistance profiles of microorganisms found in the environment. Such environmental microorganisms have been established as antibiotic resistance disseminators [1–5]. Therefore, it is necessary to evaluate the sensitivity of microorganisms to antimicrobial agents as quickly as possible once isolated. Similarly, clinical determinations of the antibiotic resistance profile of a pathogen are critical for correct treatment.
There are different types of susceptibility tests available, including disc diffusion and broth micro-dilution methods, as well as commercial tests for the determination of the minimal inhibitory concentration (MIC). The disc diffusion method is the most commonly used method worldwide [6], mainly owing to its low cost and simplicity. In this method, each disc containing an antimicrobial agent will form an inhibition zone where the micro- organism is not able to grow. The size (diameter) of the inhibition zone is used to classify the strains as resistant (R), intermediate (I), or sensitive (S) [7].
Several organizations are responsible for regulating the standardization of susceptibility tests, procedures, and interpretation criteria: the United States Food and Drug Administration (FDA), the Clinical and Laboratory Standards Institute (CLSI), the National Committee for Clinical Laboratory Standards (NCCLS), and the French Society for Microbiology (SFM) [7]. These standards help to define the threshold diameters defining the antibiotic resistance phenotype (R, I, and S), tables for MIC interpretative criteria, as well as the optimal method for the preparation of the inoculums and the indication of which antimicrobials should be tested for each micro- organism [6,7]. The spatial arrangement of antimicrobial discs on the plates is not always standardized and is usually defined by the professional in charge. However, strategies such as the use of a disc dispenser can help to standardize this procedure and simplify the task, mainly to standardize the discs in the same position when there is the need for numerous antibiograms. Nonetheless, a critical aspect of this procedure is the antibiogram reading step, after all while the manual zone measurement is reliable, the use of automated approach can reduce the number of errors and improve the accuracy of susceptibility test [8].
The measurement of the inhibition zone diameter is usually performed manually by specialists using a millimeter-scale ruler (Fig. 1A). Although seemingly trivial, this task may present several challenges such as overlapping of inhibition zones [9-12] (Fig. 1B), problems related with the seeding of the organism [13] (Fig. 1C), non-homogeneity of the circumference (Fig. 1D), partial action of the antimicrobial (Fig. 1E), and formation of a second inhibition halo [14,15] (Fig. 1F). When faced with any one of these challenges, accurate interpretation of the results is dependent on the experience of the professional. In addition, the manual measurement of inhibition zones can take a considerable amount of time, making the method impractical for some diagnostic laboratories, mainly those in hospitals that must run through several samples in a timely
manner. One potential solution proposed thus far is to focus effort on developing new methods for the automatic interpretation of susceptibility tests.
An earlier approach [16] presented a solution for automatic identification of inhibition zones; however, this solution did not provide strategies to avoid problems such as overlapping and non- homogeneity of the inhibition zones. Another report [17] approached this challenge through the detection of edges with respect to their texture; meanwhile, this method is based only on the saturation of pixels for locating the discs. Another proposed approach for automatic identification of inhibition zones [13] relies on the assumption that only the regions of inhibition are homogeneous, which is not always true. Furthermore, Legrand et al. [18] presented an automatic method but did not describe the image processing techniques there used. The Oxoid Aura Image System [19] shows promising results; nevertheless, the techniques used are also not fully disclosed, which prevents the reproduction and application of the algorithm. Nevertheless, the main goal of these methods is to simplify and accelerate the processing of antibiograms, as well as their reading and interpretation, and to avoid variations in intra- and inter-observer readings when manually measured [13–18].
Toward this end, the aim of the present study was to develop and detail an automated method for the detection of inhibition zones that can overcome the challenges described above to allow for simple readings of antibiograms obtained through the disc diffusion method. The measurements provided by an image-processing Automatic Identification Algorithm (AIA) were compared with those obtained by simultaneous manual measurements of the inhibition zones, performed by a professional using a ruler. A set of 63 environmental strains was used for this comparison.
2.
Material and methods
2.1. Bacterial isolates and antibiotics
In this study, a set of 63 environmental isolates, recovered from different aquatic habitats, were analyzed for susceptibility to antibiotics by a routine process described by Ferreira da Silva et al. [20], using Mueller–Hinton agar (Oxoid Limited; Hampshire, UK) in 90 x 15-mm Petri dishes. For each isolate, the susceptibility tests were performed for 12 different antibiotics: amoxicillin (25 μg), gentamicin (10 μg), ciprofloxacin (5 μg), sulfamethoxazole/trimethoprim (23.75/1.25 μg), tetracycline (30 μg), cephalothin (30 μg), meropenem (10 μg), ceftazidime (30 μg), ticarcillin (75 μg), colistin sulfate (50 μg), sulfamethoxazole (25 μg), and streptomycin (10 μg). In each plate, six discs were manually applied with a disc dispenser (Thermo Scientific™ Oxoid™ Anti- microbial Susceptibility Disk Dispenser, ST6090, Waltham, MA, EUA). Some of the
antibiograms were performed more than once in order to evaluate the reproducibility of the method, and a total of 756 readings (126 images) were performed because some image plates have not had enough quality for human readers distinguish the halos.
2.2. Susceptibility characterization
The breakpoints recommended for non-enterobacteria by the CLSI [7] were used as susceptibility thresholds, allowing for the classification of the isolates into three categories for each anti- biotic tested: S, I, and R. The results obtained with the AIA were compared to the reference method (manual reading) and expressed in terms of agreement and disagreement. Identical characterization in both methods was defined as agreement; categorization of I with one method and
R or S with another method was defined as minor disagreement; categorization
of S in the reference method and R in the test method (AIA) were defined as major disagreement; categorization of R in the reference method and S in test method were defined as very major disagreement [16].
2.3. Manual readings
Each plate was visually examined (naked eye) by three independent human readers (R1, R2, and R3), using a ruler to measure the diameter corresponding to each inhibition zone. The average of the two measurements obtained by the first two human readers (R1 and R2) was defined as the reference diameter (RD) value when the difference between these measurements was less than 4 mm [16]. If the difference was larger than 4 mm, the RD value was defined as the estimate obtained by a third human reader (R3). This approach was used in order to evaluate the influence that the lack of expertise/practice may have in the manual reading results. To enhance the reliability of this third reading (R3), that was performed by a senior member of research staff.
2.4. Image acquisition
Image acquisition was performed using the transiluminator ChemiDocTM MP System (Bio-Rad Life Science; Hercules, CA, USA). Images were captured with Image Lab software (Bio-Rad Life Science; Hercules, CA, USA), using Epi white-illumination mode. The system was configured to obtain images with a size of 1392 x 1040 pixels, at a resolution of 254 dpi.
2.5. Image classification
The 126 images were manually classified as standard or oddity. The standard images correspond to plates with a maximum of two overlapping and without the presence of the challenges described in Fig. 1 (Overlapping of inhibition zones;
Problems related with the seeding of the organism; Non-homogeneous circumference; Partial action of the antimicrobial; Second inhibition halo). The other images were classified as oddity. Each group was composed by 63 images (378 readings).
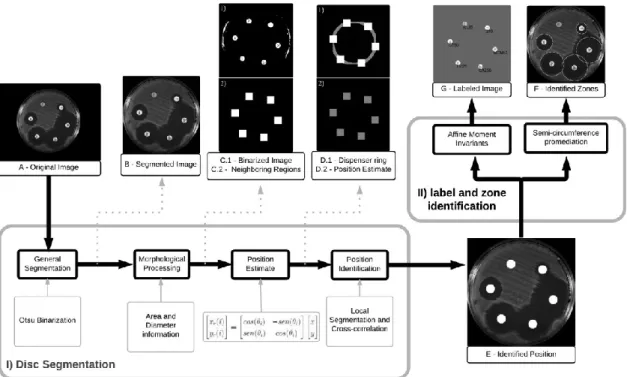
2.6. Automatic identification algorithm (AIA)
The developed Automatic Identification Algorithm (AIA) consists in two main steps, both dependent on the position of the disks. In the first step the alphanumeric labels of the disks were identified and in the second step the zones of inhibition were identified and measured (Fig. 2). For a better understanding, these steps are individually described below. MATLAB R2012b (Math- Works, Inc.; Natick, MA, USA) was used for encoding the proposed solution.
2.7. Identification of the discs' positions
Initially, for the identification of the discs, general segmentation was performed, in which the region of interest, containing only the Petri dish, was segmented and converted to grayscale (Fig. 2B). Binarization using a histogram was applied based on Otsu's method [21] to define the threshold. However, as this method is indicated for bimodal histograms, the background pixels (with intensity level of 0 to 5) were masked to 255 pixels. Therefore, another binarization using a histogram was applied, with a threshold of 97% of the maximum pixel amplitude of the grayscale image. This second binarization was performed in order to identify at least two antimicrobial discs in a binary image. Morphological processing was applied to each region labeled in binary image segmentation (Fig. 2C.1) in order to reliably target the discs. The ratio of two diameters perpendicular to region center, vertical diameter (VD), horizontal diameter (HD), and area (A) of the regions were analyzed, and acceptable VD/HD ratio and A values were considered as 0.9–1.1 and π(2:9 mm)2–π(3:1 mm)2 (equivalent of a 6-mm-diameter disc as shown in Eq. (1)). The conversion from millimeter to pixel was based on the size of Petri dish (90 mm) and the image size. Fig. 1C.2 shows the regions classified as discs.
Nevertheless, the bimodal histogram and morphological fea- tures failed to correctly identify all of the discs on the Petri dish. For a more robust estimate of the discs' positions, a ring was created with the same dimensions of the dispenser used. Thus, it was possible to define which of the ranked discs were governed by the ring (Fig. 2D.1). By holding only one reference disc on the inner ring, it was
possible to estimate the position of the other discs using the equations of rotation as follows:
where xr(i) e yr(i) are the coordinates of each estimated position i, and x and y
are the coordinates of the reference disc (Eq. (2)), where i = 1…6 (6 discs). The same logistic regression model was used in a previous study [22] by modifying the algorithm according to the number of discs and the dispenser geometry. In this way, the strategy can be applied to different contexts simply by knowing the number and the pattern of the discs disposed on the plate.
After applying the above estimation procedure, the disc positions were identified. Therefore, one image segmentation was applied on the original image using the coordinates of each estimated position, and local sub-images were created around each disc (Fig. 2D.2). A cross-correlation was performed between each sub-image using a 6-mm-diameter white circular element in sweeping motion. At every step, the sum of the pixels in the image was calculated, so that the sum of the major value was considered to be the correct position of the disc. Fig. 2E shows the identified position.
2.8. Identification of the alphanumeric labels
First of all, two image databases containing pictures of six discs each were created, as shown in Table 1.
Once the exact position of each disc was determined, it was possible to binarize the image, resulting only in the antimicrobial label (Fig. 3). The threshold used in such binarization corresponded to half of the area under the histogram.
Thus, when all labels of all the antimicrobials were identified, it was possible to compare the extracted sequence of antimicrobial labels with the created image libraries. The algorithm used for the comparison of labels was pattern recognition by Affine Moment Invariants (AMI) [23]. Such algorithm receives two binary images as entry, resulting in the Number of Features (NF) between them, allowing the comparison between the extracted label and labels from database. The systematic steps to extract the correct sequence were
1. Take one of the labels as reference and perform a comparison between the six
labels from the plate and the six labels from the Dtabase Standard 1 (e.g. Fig. 4) and Standard 2, shown in Table 1.
2. Each comparison resulted in a NF value and μnF_std_k average from NF was
calculated, which n indicating the rotation index and k the database index.
the following label in the counterclockwise direction.
4. The loop formed by steps 2 and 3 was repeated until six position changes for
each sequence image database.
5. The comparison between the sequence and the two database
patterns was performed, rotating to the six possible positions. The sequence with higher correspondence medium value was adopted as correct (Fig. 2G).
Identification of inhibition zones
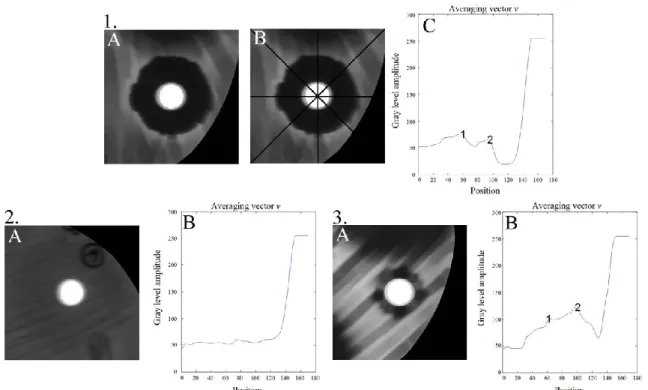
The identification of the inhibition zones was limited to diameters between 8 and 30 mm, which is sufficient for the anti- biotics tested [7]. Initially, the original image was processed with a low-pass filter type of Finite Impulse Response (FIR) order 25 and cutoff frequency of 5% of the bandwidth of the image. Then, each region of interest containing the disc and a square of 30 mm per side was segmented (Fig. 5A). For the segmentation, four lines that are each 4-pixels-thick were drawn: one vertical, one horizontal, and two diagonal, which crossed the center of the disc (Fig. 5B).
The average of every 4-pixels-thick was calculated, resulting in a mean vector for each line, and then a new average between the resultant vectors was calculated. In order to make the zone of inhibition even more evident, it was performed the average of opposite elements having as reference the vector center. This vector of averaging was named v which describes the beginning of the segmented square up to half of the antibiogram disc. Fig. 5C shows the irregularity of the averaging curve. When analyzing the curve of Fig. 5C from the highest position to the lowest, the amplitude of the disc was found to be equal to gray level value of 255 and decreases to a peak described by the number 2. This region corresponds to the desired zone of inhibition.
In this way, vector v was smoothed by a 5 point moving average filter [24]. After that, the strategy of zero crossings of the first derivative of the vector was used to identify the peaks of v. The peak position (Pm) was considered to be the transition point between the zone of inhibition and biomass. Another possible strategy for finding the approximate intensity level of the region without halos of inhibition was to calculate the average pixels located in a 40 x 40-pixels matrix drawn in the center of the plate (Mcentral). To establish a satisfactory threshold (T), Eq. (3) was used. To achieve vector without peaks, Pm is set to zero; i.e., the first element of v is considered.
where v corresponds to the vector of averaging, Pm corresponds to the peak closest to the disc.
To identify the diameter of each zone of inhibition, the average pixels from four semi-circles concentric to the disc were calculated, and their diameters (d) were
increased and the averages were recalculated until the value of T was reached for at least one of the zones.
It is worth noting that the first circumference was defined with d=8 mm and the
T value defined the amplitude boundary pixels in the zone of inhibition. This strategy
allowed us to overcome the problem of overlapping, whereas at least one semi-circumference would reach the T value. Fig. 6 illustrates an example of the growth of semicircles in the case of overlapping and Fig. 2F shows the final result.
Considering our experience with the pattern under study, the criterion adopted to identify discs without inhibition zones was ten or fewer pixels with a level intensity greater than 90% of T. This criterion was adopted for the pixels contained only in the first iteration of the four semicircles.
2.10. Accuracy
The results obtained using the AIA were compared with those obtained from human measurements (RD). The weighted kappa index, which is commonly used for comparing inter-rater agree- ment, was calculated according to the method of Fleiss [25] and the Pearson correlation coefficient was calculated [26]. SPSS 17.0 (IBM Corp.; Armonk, NY, USA) was used for the kappa and MATLAB R2012b (MathWorks, Inc.; Natick, MA, USA) was used for the Pearson correlation coefficient.
3. Results
3.1. Diameter estimates of inhibition zones
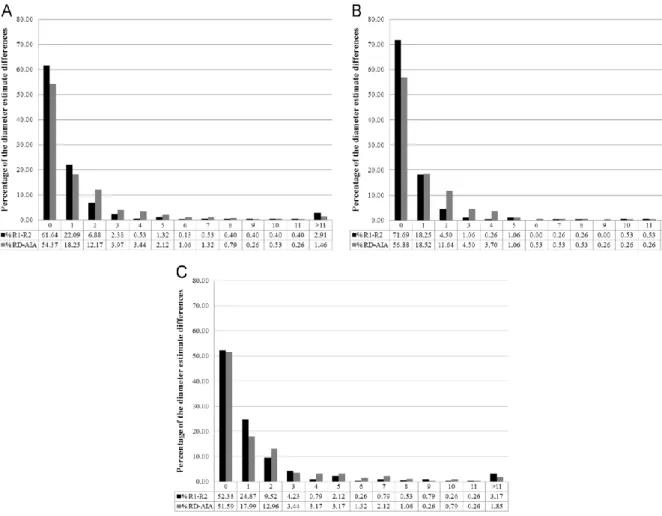
The differences between the measurements of R1 and R2, as well as the differences between the automated AIA and human RD estimates are shown in Fig. 7A, in the case of the total sample size (756 readings). The R1 and R2 readers measured the same diameter in 61.64% of the tests. Differences greater than 11 mm were observed in 2.91% of the tests.
The distribution of differences between the automated AIA and human RD estimates are shown in Fig. 7A (gray bars), in the case of the total sample size (756 reading). The majority of the tests (54.37%) were equal, whereas 1.46% of the tests have had differences greater than 11 mm.
Fig. 7 B shows the differences between the measurements of R1 and R2, as well as the differences between the automated AIA and human RD estimates, in standard images (378 readings). The R1 and R2 readers estimates were: 271 estimates were equal, whereas differences greater than 11 mm were observed in 6 tests. Mean- while, the distribution of differences between the automated AIA and human RD estimates were: 215 estimates were equal, mean- while differences of 4 mm or more were observed in 32 tests. Differences greater than 11 mm were observed in 5 tests. For the oddity images (Fig. 7C), the R1 and R2 readers estimates were: 198
estimates were equal, whereas differences greater than 11 mm were observed in 12 tests. Meanwhile, the distribution of differences between the automated AIA and human RD estimates were: 195 estimates were equal, whereas differences of 4 mm or more were observed in 53 tests. Differences greater than 11 mm were observed in 7 tests.
The Pearson correlation coefficient (0.85) revealed a strong significant correlation (p <0.05) between the measures in total sample size. For the oddity images the correlation level was 0.80 (p <0.05), whereas in standard images the correlation was 0.90 (p<0.05).
3.2. Susceptibility categorizations
The results of the susceptibility tests derived from the RD and AIA estimates are shown in Table 2. Meanwhile the estimates in categorized images are presented in Table 3.
Table 4 shows the results analyzed from the perspective of agreement and disagreement. The resulting kappa index values were 0.907 and 0.773 for comparisons between R1/R2 readers and between AIA/RD, respectively. Regarding the images categorized as oddity, the resulting kappa index values were 0.851 and 0.695 for comparisons between R1/R2 readers and between AIA/RD, respectively. On the other hand the resulting kappa index values were 0.995 and 0.834 for comparisons between R1/R2 readers and between AIA/RD, respectively, in standard images.
Agreement between categorizations derived from the measurements of the two first human readers was observed in 718 (95%) readings, in the case of the total sample size (756 reading). Dis- agreements were observed in the 38 remaining tests, 19 (3%) of which were minor. Agreement between categorizations derived from AIA and those derived from RD was observed in 663 (88%) readings. Disagreements were observed in the 93 remaining cases, 46 (6%) of which were minor (Table 4). In the case of oddity images, agreement between categorizations derived from the measurements of the two first human readers was observed in 349 (92%) readings. Disagreements were observed in the 29 remaining tests, 15 (4%) of which were minor. Agreement between categorizations derived from AIA and those derived from RD was observed in 319 (84%) readings. Disagreements were observed in the 29 remaining cases, 24 (6%) of which were minor (Table 4). For the standard images, agreement was observed in 369 (98%) readings in categorizations derived from the measurements of the two first human readers. Disagreements were observed in the 9 remaining tests, 4 (1%) of which were minor. Agreement between categorizations derived from AIA and those derived from RD was observed in 344 (91%) readings. Disagreements were observed in the 34 remaining cases, 19 (5%) of which were minor (Table 4).
4.
Discussion
The AIA, which is presented in this paper as an algorithm designed to estimate the diameter of the inhibition zones in disc diffusion susceptibility tests, produced relatively lower estimates than observed in previous studies which use automated system (i.e., kappa index values between 0.84 and 0.92 [16,17,19]), with 88.8% of tests showing no difference or differences lower than 4 mm (Fig. 7).
For susceptibility categorization, 88% of cases showed agreement, whereas the percentage of major (2%) and very major dis- agreement (5%) of AIA were close to or superior to those of already developed systems. Hejblum et al. [16] obtained values, in the worst case, of 3% and 2% for major and very major disagreement, respectively. Nolte et al. [27] found rates of 7% and 8% of major and very major disagreement, respectively; furthermore, their agreement rate was lower (82%) than that obtained in the present work (88%).
It was verified relatively significant differences between gold standard and automated readings in our study. The presence of oddities could be an explanation for these differences. In this case, the presence of oddities is able to challenge thresholds on the algorithm, leading the system to wrong interpretations of inhibition zones. Therefore, automated methods should be a support for a laboratory specialist who has the expertise and practice to judge efficacy and accuracy of these methods.
Moreover, AIA showed a correlation index of 0.85, higher correlation than the Sirscan system in the worst case (0.80) [28], but lower than the best case of a correlation of 0.97 [28]. In future studies, we aim to calculate the levels of correlation for each organism and for each antibiotic separately, as performed in other studies [16,27].
When the images were classified, the results were improved, mainly in the case of standard images. All estimates, kappa index (Table 6), susceptibility categorizations (Table 4) and correlation index were better in standard image (0.90) than oddity images (0.80). Probably the challenges in oddity images led to relatively lower estimates in the total sample size. Therefore, it is clear that the good quality of the image as well as a good antibiogram are important factors to improve the algorithm performance.
The correct identification of the discs' positions is a critical information for the proper functioning of AIA, given that the identification of the inhibition zones and alphanumeric labels depend fundamentally on the correct identification of the fusion discs' positions. However, bimodal histogram methods and morphological features, separately, cannot ensure the identification of all positions, since, quite often, it is verified a change in the antibiogram disc's tonality or destruction of disc's label as a result of the incubation process.
As described in Section 2.7, with at least two discs, it is possible to estimate the position of the other discs, turning our strategy more tolerable to failure when compared to bimodal histogram methods and morphological features. Fig. 8 illustrates a case which binarization has not been able to ensure the location of
all six discs, since one of the discs has failed the test to morphological features. However, the missing disc position was correctly estimated using the dispenser geometry and the label could be deduced by the relative position to adjacent labels. In this sense, use of a disc dispenser allows for correct disc positioning and identification, ensuring the quality of the tests, thereby avoiding incorrect disc placement or in a greater number than those recommended by the organization which are responsible for regulating the standardization of susceptibility tests [11]. In our study, the quality of the images was maintained owing to controlled standardization of the equipment, thereby avoiding the lighting problems described previously [29]. The image libraries constructed using our approach also limited the algorithm to identifying only the stipulated sequence of discs. However, this was done in a robust manner by implementing a strategy for assessing the neighboring discs. Furthermore, it will also be possible to insert new sequences of disc labels to the library in future work.
The use of four independent semi-circumferences (Fig. 6) counteracted the effects of overlapping of inhibition zones, circumference heterogeneity, problems with the seeding of the organism, and the formation of a second halo of inhibition; once reaching the threshold T, the halo diameter could be determined. In the case of overlapping of inhibition zones, at least one of the diagonals is expected to reach T. The strategy of using diverse increments in the diameter negates the problem of circumference heterogeneity, and continues toward the next incrementation until reaching T. Although problems with the seeding of the organism could decrease the average of the semi-circle in extreme cases (Fig. 1C), as four diagonals were used, the results would be inconclusive only if all four have problems in reading. Finally, the issue of a second inhibition halo is more complex, because the intensity levels are quite variable. The proposed solution could correctly identify cases with pixels of close intensity to the bio- mass and, consequently, near the threshold T.
Another challenge of an antibiogram test is partial action of the antibiotic [14,15]. This too was overcome by implementing a strategy that uses 10 pixels with higher intensity than 90% of threshold T (Eq. (3)) to identify discs without halos in the first interaction. As shown in Fig. 1E, in the case of partial action of the antibiotic, there are traces of biomass that cross the zone of inhibition. Such traces have a high level of intensity that is verified with the use of 10 pixels in the present strategy. In addition, the partial actuation can also decrease the intensity of related pixels, which is why 90% of threshold T was selected.
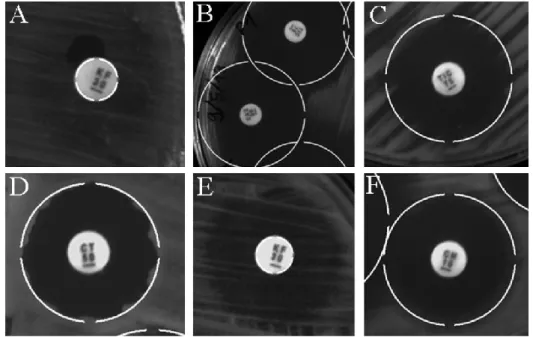
Fig. 9 shows how the AIA has performed the halos readings even with these cited challenges above.
The fact that our proposed method could overcome these common obstacles in disc diffusion methods is particularly valuable, because these problems can occur during routine tasks of analytical laboratories, and may also interfere with or hinder the correct interpretation of results in research studies [8–10]. More- over, other authors who have proposed methods for the automatic detection of inhibition zones have claimed that these parameters continued to influence
aspects of inhibition zone determination [17]. Gavoille et al. [17] reported problems with methods that assume a continuous boundary of inhibition zones. However, their strategy, which uses the Student's t-test as an edge detection criterion, is sensitive to noise on the inhibition zones. Furthermore, the method does not offer a solution to the partial action of the antibiotic. Salgado et al. [13] considered the use of directional filtering and texture analysis to measure inhibition halos. They assumed homogeneity of texture after filtering, but there is no evidence of the effectiveness of this method. In addition, substrate color components such as RGB and HSI are considered, which can be as variable as the texture. Therefore, it is assumed that our approach to classify images as oddity was little or not explored in previous works. All plates with feasible human analysis were submitted to the developed algorithm, leading to new developed strategies which differ essentially from the current bibliography.
Moreover, the generation of v was increased with the use of diagonal lines and peaks treatment. The proposed algorithm was limited to a range of 8–30 mm in diameter [7] for the inhibition zones. The first circle used in the calculation starts with an 8 mm diameter, and the filter based on the threshold T (Eq. (3)) deals with both the case of no inhibition zone or the case of large inhibition zones exceeding 30 mm. In cases outside this range (d >30 mm; d<8 mm), the response of the algorithm fixes values of 30 mm and 6 mm, respectively.
5.
Conclusions
In this paper, we presented an AIA to measure the zones of inhibition obtained by the disc diffusion method. The proposed AIA software is expected to become a valuable clinical support tool to help specialists achieve robust antibiogram interpretation. It is not intended to be a substitute for human measurements; the goal is to increase examiner reliability, as well as the number of antibiograms that could be read within a short period of time. In this context, the results showed good performance such as 87% of tests were correctly classified and the developed technique enabled the identification of the inhibition region of antibiotics with high correlation coefficient (0.85; p <0:05). Furthermore, oddity images led to relatively lower estimates in the total sample size although problems – not addressed in other works – such as the multiple overlapping of inhibition zones, imperfect seeding of the microorganism, heterogeneity of the circumference, partial action of the antimicrobial, and formation of a second halo of inhibition were overcomed through automatic and adaptive techniques for each image received by the algorithm. Together, our results indicate that AIA is a versatile and solid tool for laboratory use.
Conflict of interest statement
None declared.
Acknowledgements
The authors would like to thank the financial support provided by CNPq (grants 205058/2012-4, 204833/2012-4 and 238670/ 2012-0) and FINEP (Medical Products and biomaterials 2010/05), and the IVM grant SFRH/BPD/87360/2012 from Fundação para a Ciência e Tecnologia, Portugal. Besides, the authors appreciate Prof. Bruno Macchiavello’s close reading of the manuscript.
References
1. C. Llor, A. Moragas, C. Bayona, R. Morros, H. Pera, O. Plana-Ripoll, J.M. Cots, Efficacy of anti-inflammatory or antibiotic treatment in patients with non- complicated acute bronchitis and discoloured sputum: randomised placebo controlled trial, BMJ 5762 (2013) 1–12.
2. I. Oren, H. Sprecher, R. Finkelstein, S. Hadad, A. Neuberger, K. Hussein, A. Raz- Pasteur, N. Lavi, E. Saad, I. Henig, N. Horowitz, I. Avivi, N. Benyamini, R. Fineman, Y. Ofran, N. Haddad, J.M. Rowe, T. Zuckerman, Eradication of carbapenem-resistant enterobacteriaceae gastrointestinal colonization with nonabsorbable oral antibiotic treatment: a prospective controlled trial, Am J Infect Control 41 (2013) 1167–1172.
3. X.-X. Zhang, T. Zhang, H.H.P. Fang, Antibiotic resistance genes in water envir- onment, Appl Microbiol Biotechnol 82 (2009) 397–414.
4. J.L. Martinez, Environmental pollution by antibiotics and by antibiotic resis- tance determinants, Environ Pollut 157 (2009) 2893–2902.
5. R. Aminov, R. Mackie, Evolution and ecology of antibiotic resistance genes, FEMS Microbiol Lett 271 (2007) 147–161.
6. WHO, Manual for the Laboratory Identification and Antimicrobial Suscept- ibility Testing of Bacterial Pathogens of Public Health Importance in the Developing World, 1st ed., London, 2003.
7. CSLI, Performance Standards for Antimicrobial Susceptibility Testing; Twenty- Second Informational Supplement, 32nd ed., London, 2012. 8. E.S. Lestari, J.A. Severin, P.M.G. Filius, K. Kuntaman, D.O. Duerink, U.
Hadi, H. Wahjono, H.A. Verbrugh, Comparison of the accuracy of disk diffusion zone diameters obtained by manual zone measurements to that by automated zone measurements to determine antimicrobial susceptibility, J. Microbiol. Methods 75 (2) (2008) 177–181.
Education, 13th ed., Prentice Hall, NJ, 2006.
10. O.F. Join-Lambert, S. Clauser, C. Guillet, J.P. Jais, E. Abachin, G. Quesnes, E. Carbonnelle, A. le Monnier, J. Zahar, S. Kayal, P. Berche, A. Ferroni, Com- parison of cefoxitin and moxalactam 30 μg disc diffusion methods for detec- tion of methicillin resistance in coagulase-negative staphylococci, J. Anti-microb. Chemother. 59 (2007) 763–766.
11. O. Samuelsen, L. ABuarø, C. AGiske, G. Simonsen, B. Aasnæs, A. Sundsfjord, Evaluation of phenotypic tests for the detection of metallo-β-lactamase-pro- ducing pseudomonas aeruginosa in a low prevalence country, J. Antimicrob. Chemother. 61 (2008) 827–830.
12. S. García, M. Arroyo, M. Pérez-Vázquez, B. Aracil, J. Oteo, J. Campos, Evaluation of the eucast disc diffusion susceptibility testing method for haemophilus influenzae based on the resistance mechanism to β-lactam antibiotics, J. Antimicrob. Chemother. 68 (2013) 159–163.
13. L. Salgado, J. Menendez, E. Rendon, N. Garcia, V. Ruiz, Automatic antibiograms inhibition halo determination through texture and directional filtering ana- lysis, Image Processing, International Conference 2 (2001) 1–4.
14. C.A. Arias, M. Vallejo, J. Reyes, D. Panesso, J. Moreno, E. Castañeda, M. V. Villegas, B.E. Murray, J.P. Quinn, Clinical and microbiological aspects of linezolid resistance mediated by the cfr gene encoding a 23 s rrna methyl- transferase, J. Clin. Microbiol. 46 (2008) 892–896.
15. T.T. Tran, S. Jaijakul, C.T. Lewis, L. Diaz, D. Panesso, H.B. Kaplan, B.E. Murray, Wanger, C.A. Arias, Native valve endocarditis caused by corynebacterium stria- tum with heterogeneous high-level daptomycin resistance: collateral damage from daptomycin therapy?, Antimicrob. Agents Chemother. 56 (2012) 2461–2464.
16. G. Hejblum, V. Jarlier, J. Grosset, A. Aurengo, Automated interpretation of disk diffusion antibiotic susceptibility tests with the radial profile analysis algo- rithm, J. Clin. Microbiol. 31 (1993) 2396–2401.
17. Gavoille, B. Bardy, A. Andremont, Measurement of inhibition zone diameter in disk susceptibility tests by computerized image analysis, Comput. Biol. Med. 24 (1994) 179–188.
18. L.R. Legrand, L.S. Aho, L. Dusserre, Antibiogram automatic reading with a micro-computer based image processing system, in: Engineering in Medicine and Biology Society, 1995 and 14th Conference of the Biomedical Engineering Society of India. An International Meeting, Proceedings of the First Regional Conference., IEEE, 1995, pp. 30–31.
19. J. Andrews, F. Boswell, R. Wise, Evaluation of the oxoid aura image system for measuring zones of inhibition with the disc diffusion technique, J. Antimicrob. Chemother. 46 (2000) 535–540.
20. M. Ferreira da Silva, I. Tiago, A. Veríssimo, R.a.R. Boaventura, O.C. Nunes, C.M. Manaia, Antibiotic resistance of enterococci and related bacteria in an urban wastewater treatment plant, FEMS Microbiol. Ecol.
55 (2006) 322–329.
21. N. Otsu, A tlreshold selection method from gray-level histograms, IEEE Trans. Syst. Man Cybern. 20 (1979) 62–66.
22. L.F.R. Costa, M.A. Andrade, E.A. Costa-Jr, B. Macchiavello, Método automático para identificação de rótulos alfanuméricos de antibióticos posicionados em antibiograma., in: In Anais do XIX Congresso Brasileiro de Automática, Cam- pina Grande, Brasil, 2012.
23. J. Flusser, T. Suk, Pattern recognition by affine moment invariants, Pattern Recognit. 26 (1993) 167–174.
24. R.C. Gonzalez, R.E. Woods, S.L. Eddins, Digital Image Processing Using MATLAB, 2004.
25. J.L. Fleiss, B. Levin, M.C. Paik, The measurement of interrater agreement. In: Statistical Methods for Rates and Proportions, 3rd ed., 2003. 26. J. Benesty, J. Chen, Y. Huang, I. Cohen, Pearson correlation coefficient, in: Noise Reduction in Speech Processing, vol. 2 of Springer Topics in Signal Processing, Springer, Berlin Heidelberg, 2009, pp. 1–4.
27. F.S. Nolte, K.K. Krisher, L.a. Beltran, N.P. Christianson, G. Sheridan, Rapid and overnight microdilution antibiotic susceptibility testing with the sensititre breakpoint autoreader system, J. Clin. Microbiol. 26 (1988) 1079– 1084.
28. A. Nijs, R. Cartuyvels, A. Mewis, V. Peeters, J.L. Rummens, K. Magerman, Comparison and evaluation of osiris and sirscan 2000 antimicrobial suscept- ibility systems in the clinical microbiology laboratory, J. Clin. Microbiol. 41 (2003) 3627–3630.
29. L.F.R. Costa, T.d.C. Portela, M.M.D. Andrade, E.A. Costa, B. Macchiavello, Método automático para identificação robusta da região de inibição em antibiogramas, Anais do XXIII Congresso Brasileiro Eng Biomédica (2012) 1–5.
Fig. 1. Automatic identification algorithm (AIA) fluxogram. (A) Millimeter-scale ruler [9]. (B) Overlapping of inhibition zones. (C) Problems related with the seeding of the organism. (D) Non-homogeneous circumference. (E) Partial action of the antimicrobial. (F) Second inhibition halo
Fig. 2. Automatic identification algorithm (AIA) fluxogram. (B) Region of interest containing only the Petri dish. (C.1) Image after Otsu binarization. (C.2) Neighboring of regions classified as discs. (D.1) Ring created with the same dimensions of the dispenser used. (D.2) Discs governed by the ring. (E) Identified position after cross-correlation in each neighboring of estimated positions. (F) Identified zones of inhibition. (G) Identification of discs labels.
Fig. 3. Image binarization for labels identification. (A) Grayscale image of a segmented disc. (B) Segmented disc histogram. (C) Binary image of a segmented disc with the median of the histogram as the threshold pixel gray level for binarization.
Fig. 4. Example of comparison between the extracted sequence and Database Standard 1. The Affine Moment Invariants (AMI) algorithm 21 results in the Number of Features (NF) between image labels. The fifth rotation presented higher μNF average value, therefore the correct sequence for this database. Such operation was also realized for Database Standard 2, following the steps from 1 to 5.
Fig. 5. Vector v examples. (1,2,3). (A) Segmented image. (1.B) 4-pixels-thick: one vertical, one horizontal, and two diagonal for the averaging vector (v calculation). (1,2,3). (C) Peaks of v, number 2 corresponds to the highest position (Pm) used to
calculate threshold T on images (1.A) and (3.A), image (2.A) had no peaks, so the first
element of v is considered.
Fig. 6. Growth of semi-circumferences until at least one reach the threshold T. It was created four semi-circles concentric to the disc. Their diameters (d) were increased and the averages were recalculated until the value of T was reached for at least one of the
Fig. 7. Distribution of the diameter estimate differences (absolute values). For each test, the absolute value of the difference between the two human readers (RD1–RD2) in the estimates of the inhibition zone diameters was calculated. The black bars indicate the resulting distribution. The gray bars show the distribution for the comparison between the reader-derived diameter (RD) and the automatic identification algorithm (AIA)-derived diameter. A: Total sample size: 756 readings (126 images). B: Standard images, 378 readings (63 images). C: Oddity images, 378 readings (63 images).
Fig. 8. In this example, all six discs have not been found after morphological processing. The missing disc position was estimated by dispenser geometrical information.
Fig. 9. AIA's readings for oddity images. (A) AIA's reading even with noise and background. (B) AIA's reading in overlapping of inhibition zones. (C) AIA's reading even with problems related with the seeding of the organism. (D) AIA's reading in non-homogeneous circumference. (E) AIA's reading even with partial action of the antimicrobial. (F) AIA's reading in the case of second inhibition halo.
Table 1
Image databases created with the sequence of antimicrobials to compare with the determinated labels.
Table 2
Table 3
Contingency tables for susceptibility categorizations in categorized images.a
Table 4