Inês C. Santos, Raquel B.R. Mesquita, and António O.S.S. Rangel
The State of the Art of Flow-Through
Solid-Phase Spectrometry
Sample pretreatment is one of the bottlenecks in analytical chemistry, especially when dealing with complex matrices like environmental samples. When performed in a batch mode, sample handling methods are tedious and time consuming. Therefore, the hyphenation of these methods with flow-injection techniques yields many advantages. The possibility of automation not only increases the determination rate, but also decreases sample and reagent consumption. As a consequence, analyte separation, enrichment, and elimination of sample matrix becomes possible with an increase in selectivity and sensitivity. This is a significant contribution for the analysis of environmental samples because the analyte is usually present at trace levels in a complex matrix. In this scenario, the state of the art of solid-phase spectrometry (SPS) with a focus on the lab-on-valve (LOV) platform is discussed. LOV facilitates the manipulation of bead suspension for SPS with lower reagents consumption and waste production.
W
hen analyzing environmentalsamples such as water, soil, and plants, some major chal-lenges may be found. For example, when dealing with dynamic systems such as estuarine waters, spatial and temporal variability may be encountered. For this reason, the analyte concentration may range from low to trace levels. Salinity in estuarine systems maybe a good example, because it presents both spatial variabil-ity (proximvariabil-ity to the sea) and temporal variability (tides). Solid environmental samples, such as soil and plants, are another example where difficulties may be found because some type of extrac-tion is needed to isolate and separate the analyte from its matrix. Because of these challenges, a sample pretreatment is often necessary before identifying or quantifying the analyte of interest to increase the method’s selectivity and sen-sitivity. Different separation techniques such as liquid–solid extraction, liquid– liquid extraction (LLE), and gas
chroma-tography (GC) and liquid chromatogra-phy (LC) are available to overcome these issues. In this manner, analyte extrac-tion and enrichment can be performed along with the removal of sample matrix interferences. However, when performed in a batch mode, these sample pretreat-ment methods are very tedious and time-consuming. Furthermore, high amounts of organic solvents are usually necessary, especially for solvent extraction methods, which can cause health and environmen-tal problems because of their high volatil-ity and release into the environment (1).
In this context, the coupling of sepa-ration techniques with flow-injection methods not only allows the automation of the entire sample preparation process, but also achieves a reduction in reagent and sample consumption. Also, an increase in the sensitivity of the method can be obtained together with an increase in throughput (1,2). By incorporating external devices, such as gas diffusion or dialysis units, or resin packed columns,
in the flow manifolds, the analyte of
interest can be collected, enriched, and separated from its matrix before detec-tion in a miniaturized fashion.
Different flow techniques can be used according to their suitability for the intended determination. Flow-injection analysis (FIA) was first described by Ruzicka and Hansen in 1975 (3) where the concept of complete reaction and physical equilibrium was discarded. The sample is injected in a continuous flow of reagent and the mixture is performed as the sample is propelled downstream to the detector. To overcome some of the FIA limitations, a second genera-tion was proposed as an evolugenera-tion to this technique. The main principle of sequential-injection analysis (SIA), the so-called second generation of flow injection analysis, is the programmable flow where the mixing occurs by revers-ing the flow of sample and reagents (4). With this principle, SIA allows an even
lower consumption of reagents and efflu-ent production. The third generation of flow injection analysis, called sequential injection lab-on-valve (SI-LOV), has the main characteristics of SIA (5). However, this technique incorporates the detec-tion system in the selecdetec-tion valve, which allows a working volume in the micro-liter range. Additionally, this technique allows handling solid materials within the manifold conduits in a relatively sim-ple way. This feature opens new perspec-tives for performing several processes on the sorbent surface, such as analyte enrichment, immobilization of reagents, and derivatization reactions. If the solid material is sufficiently transparent, even the spectrometric measurement itself can be made directly on the solid material— that is, solid-phase spectrometry (SPS). This approach is quite a breakthrough for samples with complex matrices such as environmental samples. SPS provides the ability to minimize possible physical interferences (those caused by sample intrinsic color or turbidity) and chemi-cal interferences. Also, as already men-tioned, the analyte is usually present at trace levels, so this technique allows the enrichment as well as sample cleanup (for example, desalting). Additionally, a sensitivity enhancement can be achieved because there is no need for a previous elution before measurement. This fea-ture is explored in this article.
Hence, the coupling of FIA, SIA, and SI-LOV with on-line sample pretreat-ment procedures offers different advan-a)
b)
c) 250
Cumulative number of articles
Cumulative number of articles
Cumulative number of articles
Year
SPE Membrane-based LLE Chromatography
Year
SPE Membrane-based LLE Chromatography
Year
SPE Membrane-based LLE Chromatography
200 150 100 50 0 45 40 35 30 25 20 15 10 5 0 60 50 40 30 20 10 0 2000 2001 2002 2003 2004 2005 2006 2007 2008 2009 2010 2011 2012 2013 2014 2015 2000 2001 2002 2003 2004 2005 2006 2007 2008 2009 2010 2011 2012 2013 2014 2015 2000 2001 2002 2003 2004 2005 2006 2007 2008 2009 2010 2011 2012 2013 2014 2015
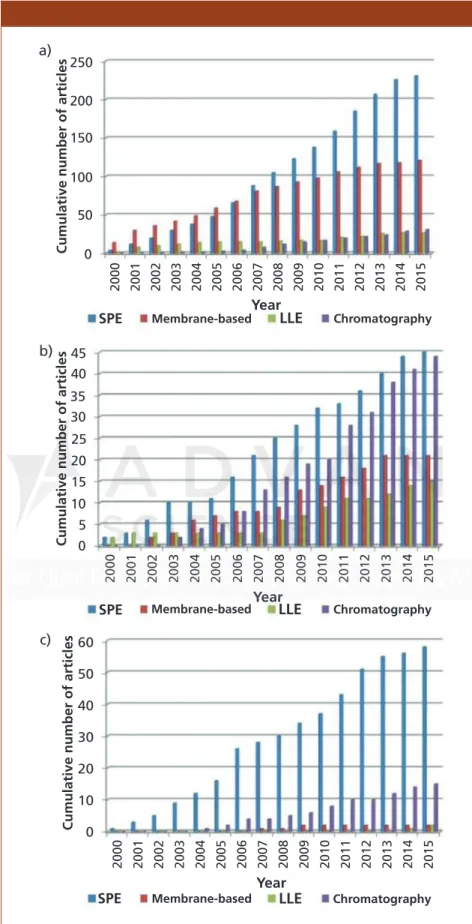
Figure 1: Progression over the years of the papers coupling on-line sample
pretreat-ment and (a) FIA, (b) SIA, and (c) SI-LOV. SPE = solid phase extraction and LLE = liquid-liquid extraction.
tages when compared to performing these procedures in a batch mode. Each technique presents unique characteristics that can contribute to the automation of the sample pretreatment procedure. FIA requires a simpler manifold, and because of its continuous flow, a higher throughput can be achieved. SIA and SI-LOV, in contrast to FIA, require a more sophisticated manifold; however, since they are based on a programmable flow, even lower sample and reagent consump-tion can be achieved. Also, since a selec-tion valve is used instead of an injecselec-tion valve, different reagents and devices can be coupled and therefore multiparamet-ric determinations can be performed with the same manifold. In the mean-time, other flow techniques have been described such as multicommuted flow analysis (MCFIA), multisyringe flow injection analysis (MSFIA), and multi-pumping flow analysis (MPFA) (6–8). Since they are all based on a unidirec-tional flow like flow-injection analy-sis—and to facilitate the reading of this article—all of these techniques were included in the FIA group. This article discusses the state of the art of flow-through SPS. Furthermore, it provides a detailed review on the use of SI-LOV for SPS.
On-Line Sample Pretreatment The advantages of coupling flow tech-niques with on-line sample pretreatment procedures are diverse. In this section,
we focus on extraction and preconcentra-tion as sample pretreatment techniques. In this context, liquid–solid extraction or solid-phase extraction (SPE), LLE, GC, LC, and membrane-based techniques such as gas diffusion, dialysis, and per-vaporation, are the techniques included in this section for discussion. SPE, LLE, GC, and LC are techniques used for separation of the analyte from possible sample matrix interferences. SPE and LLE moreover can be used to enrich the analyte in a solid or liquid phase, respec-tively. Membrane-based techniques can also be used for analyte separation from sample matrix as the species are trans-ferred through a membrane from a donor to an acceptor solution. The difference between dialysis and gas diffusion is the membrane material. These techniques can also be performed with the purpose of dilution and microextraction.
A search on ISI Web of Knowledg– Web of Science (Figure 1) was made for the existing publications (between the years 2000 and 2015) that couple sample pretreatment methods with flow tech-niques.
As shown in Figure 1, SPE is the first choice for on-line sample pretreatment in all flow techniques. In comparison, there have been few papers describing the hyphenation of LLE with flow tech-niques. This method still requires the use of organic solvents, although in lower volumes when compared to batch LLE, which may be the cause for it being used
less when compared to other pretreat-ment methods.
The coupling of membrane-based methods to flow techniques constitutes an excellent tool for the monitoring of dynamic systems. These on-line pre-treatment methods have been reasonably used throughout the years, with more application in the FIA and SIA methods. The yields of these membrane-based methods can be optimized and adapted to the intended application (for example, separation, enrichment, or dilution). However, when coupled to flow injec-tion techniques, the obtained yields are usually quite low as flow techniques frequently present a short time available for analyte transfer. This may be one of the reasons for the decrease in published works that use this on-line sample pre-treatment method.
Chromatography has been well explored using SIA methods. In fact, a significant increase in the published papers where chromatography is hyphen-ated to SIA is shown in Figure 1b. This increase can be explained by the recent development of monolithic columns (9–11) that, because of their porosity, allow efficient separations at lower pres-sure. Although this was a good contribu-tion, chromatography usually requires a step of analyte enrichment before sepa-ration, which in turn makes the method more complex.
SPE coupled to flow techniques has been well explored throughout the years (1,12,13). Indeed, this method has resulted in the improvement of simplicity and ease of automation when compared to the batch mode. By introducing a packed resin to the flow manifold, ana-lyte separation and enrichment can be achieved in a few steps. In doing so, the method’s throughput, sensitivity, and selectivity may be increased.
Flow-Through SPS
The performance of on-line SPE was a great advance in the automation of sam-ple pretreatment. In this context, SPS was described for the first time by Yoshimura and colleagues (14). Both techniques are based on analyte retention on a solid sup-port. In SPE, the analyte must be eluted from the solid support toward the detec-tor, but in SPS the beads are trapped in a flow cell where the signal is measured SI-LOV 18% SIA 15% FIA 67%
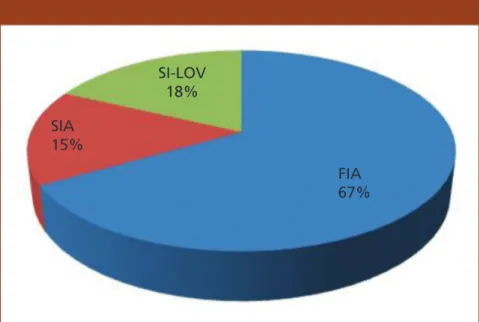
Figure 2: Distribution of published articles that performed flow-through SPS by flow
at the surface of the beads (optosensing). When compared to the traditional SPE
technique, SPS does not require the step of analyte elution from the solid support where dilution and partial loss of the pre-concentration capabilities may occur. In
fact, SPS not only allows analyte reten-tion and matrix interference eliminareten-tion, it also reduces intrinsic sample and bead absorption by resetting the absorbance baseline value after propelling the sam-ple through the packed beads. Therefore,
this technique exhibits high sensitivity and selectivity provided because of the in situ preconcentration and detection of analytes on the solid sensing support.
SPS has been mainly performed using FIA, as shown in Figure 2, probably because of the simplicity of the manifold. The great advantage of perform-ing flow-through SPS when compared to batch SPS, besides consuming less reagents and producing less waste, is the possibility of bead reutilization, as they are regenerated after each determination. Therefore, SPS is a good contribution to the green analytical chemistry concept because there is a reduction in sample, reagent, and solid support consumption and effluent production by downscaling the analytical system.
Different approaches can be used for SPS (15). In the first approach, the ana-lyte is primarily retained on the beads and then the chromogenic reagent is added. This procedure is mainly applied when the reagent has poor selectivity for the analyte. For this reason, possible matrix interferences must be removed so the analyte is the only species available to react with the chromogenic reagent. In the second approach, the reagent is first retained on the beads, functional-izing them, and then the sample is added. This procedure is recommended when the color reaction is highly selective for the analyte and the product formed can be sorbed on the solid support. Another approach performed is the measurement of the analyte intrinsic absorbance or fluorescence without the need of using a chromogenic reagent.
Detection Methods
To perform flow-through SPS, only a few detection methods are available because of the need to measure the signal at the surface of the beads. The major problem associated with this approach is that, due to the packed sorbent in the flow cell, a large background signal is already measured before the determination. As there is a large background attenuance of the solid phase, a relatively small absor-bance of the colored species adsorbed on the solid phase is measured, which can decrease the sensitivity of the method.
Consequently, the detection methods described in the literature used for flow-through SPS are ultraviolet–visible (UV–
a)
b)
c)
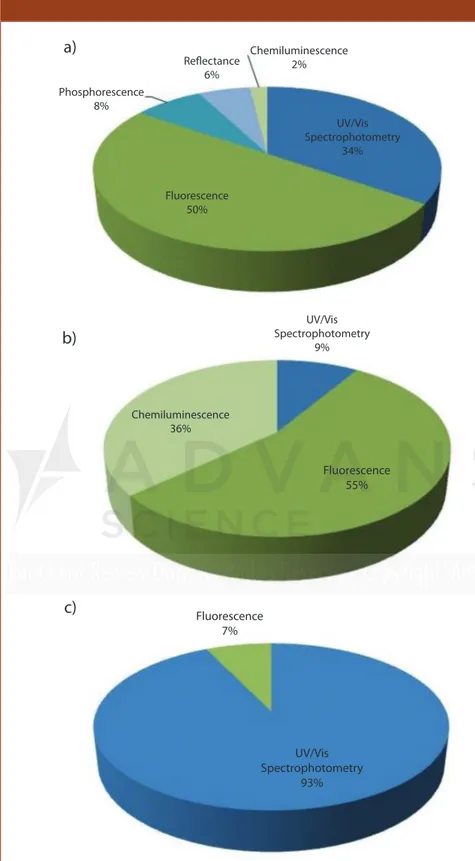
Phosphorescence 8% Reflectance 6% Chemiluminescence 2% Chemiluminescence 36% Fluorescence 50% Fluorescence 55% Fluorescence 7% UV/Vis Spectrophotometry 34% UV/Vis Spectrophotometry 9% UV/Vis Spectrophotometry 93%Figure 3: Distribution of published articles in flow-through SPS by type of detection
vis) molecular absorption, fluorescence, chemiluminescence, phosphorescence, and reflectometry (Figure 3), because these allow the measurement of a signal at the surface of a solid support (16).
According to Figures 3a and 3b, fluo-rescence is the most common detection method in FIA and SIA techniques for flow-through SPS. Fluorescence is more sensitive and selective than UV–vis spec-trophotometry; it is subject to less influ-ence from the solid material background signal and interferences from the sample matrix.
However, for SI-LOV, UV–vis is clearly
the most common detection device used. In fact, the flow cell of the SI-LOV can be configured for UV–vis and fluores-cence measurements by means of optical fibers. However, fluorescence is not as sensible as UV–vis molecular absorption when performed in this platform. Usu-ally, higher flow paths (1 or 1.5 cm) are advised for fluorescence measurements and the flow path of SI-LOV can only be 1 cm maximum, if no additional device,
such as a Garth cell (17), is used. Lab-on-Valve Platform for SPS The development of SI-LOV was a big
step toward miniaturization and automa-tion of chemical analysis. Its new design, which integrates the flow cell on top of the multiposition valve, made the reduc-tion of sample and reagent volumes and effluent production (5) possible. More-over, the geometry of the channels in the multiposition valve of the SI-LOV allows the manipulation of beads that can be trapped in different places in the valve, an approach called bead injection (BI). The use of beads and their entrap-ment in the selection valve allows the performance of SPE or chromatography without the need for coupling external
Table I: SI-LOV methods for SPS
Analyte
Solid-Phase Resin
Functionalized
Beads SPS Mode Reagent
Dynamic Range LOD RSD (%) Deter. Rate (h-1) Sample Reference Iron NTA superflow (agarose) - Reusable 3-hydroxy- 1(H)-2- methyl-4-pyridinone 20.0–100 µg/L 9 µg/L 2.1; 3.4 13/14 Fresh and coastal waters 19 Proteins NTA superflow (agarose)
Copper Renewable
Folin–Cio-calteu up to 0.3 g/L 0.03 g/L 1.9 - 4.9 9 White wines 20 Copper Sephadex QAE A-25 Zincon Renewable — 10.0–100 µg/L 3 µg/L 2.5 8 River water 21 Cobalt Sephadex QAE A-25 PAN-S Renewable — 20.0–500 µg/L 8 µg/L 2.8 16 Tablets, spring and river water 22 Iron NTA superflow (agarose) — Renewable SCN− 0.09–5.0 mg/L 0.02 mg/L - 20 Wine 23 Cell density, hydrogen peroxide Cytodex beads — Renewable DCFH-DA 1×10⁶– 8×10 cells; 5–100 µmol/L — 38 4 Live cells 24 biotinyl-ated DNA
Agarose Streptavidin Renewable OliGreen fluorescent dye
0–9.93 ng 111 pg — — — 25
Nucleic
acids Porous beads Streptavidin Renewable DNA probes 1–1000 pmol 1 pmol 7.2 3 No appli-cation 26
Proteins Agarose — Renewable — 0.06–12
µg/µL A = 0.003 — 6 No appli-cation 27
Immuno-globulin G Sepharose Protein G Renewable — 0.1–0.4 µg/µL 50 ng/µL — — IgG samples 28 Antibodies Sepharose Biotinylated
GAD65 Renewable Secondary antibody, HRPO sub-strate 100–400 ng/mL 20 ng/mL 2–5 2 Human serum 29 Biotin-containing conjugates
Agarose Streptavidin Renewable — 250–1500
pmol — — 13 Human cell
homog-enates
30
Immuno-globulin G Sepharose Protein Renewable — 0–0.4 µg/µL 470 ng — — No appli-cation 31
Immuno-globulin G
Sepharose Protein Renewable — 4.0–100 µg/mL 5/10 µg/mL — — No appli-cation 5 PAN-S, 1-(2-pyridylazo)-2-naphthol-sulfonic acid; zincon, 2-carboxy-2’-hydroxy-5’-sulfoformazylbenzene; DCFH-DA, dichlorofluores-cein diacetate.
devices such as columns. Furthermore, if the beads are entrapped in the flow cell of the multiposition valve, the analyte can be retained and determined at the sur-face of the beads (SPS). When compared to FI-SPS and SIA-SPS, SI-LOV-SPS offers the possibility to renew the adsor-bents not only by chemical regeneration (elution), but also by physical regenera-tion, where the beads are discarded and a new sensor is prepared in the flow cell after each analytical cycle. By doing so, no elution step is necessary to clean the sensor and thus, no analyte or interfering species accumulation occurs. Therefore, the lifetime of the sensor is not a limi-tation of the method. Bead injection in an LOV platform for SPS simplified the on-line sample pretreatment procedure because column preparation, analyte retention, enrichment, detection, and elution-washing can be performed auto-matically by computer control (18).
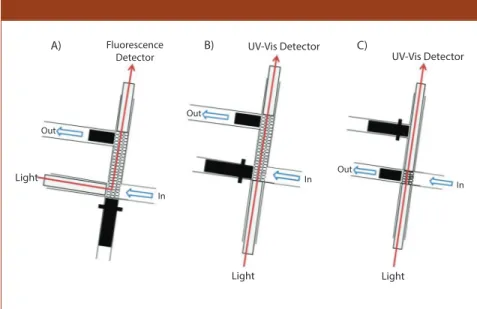
Absorbance and fluorescence measure-ments can be carried out in the flow cell that is integrated within an LOV module by means of optical fibers. The distance between the optical fiber ends defines the optical pathlength, which can be varied from 1 mm (Figure 4b) to 10 mm (Figure 4c). Fluorescence measurements (Figure 4a) are carried with optical fibers assembled at a 90° angle.
The use of a higher flow path may increase the sensitivity of the method because a higher mass of resin can be
packed in the flow cell. On the other hand, a higher amount of sensor in the flow cell may cause higher background signal and therefore low analytical signal decreasing the sensitivity of the method.
A review of all the works describing the use of SI-LOV for SPS is presented in Table I.
Almost all works use functional-ized beads, where the reagent has been previously retained on the surface of the beads. This approach can increase throughput, because there is no need to aspirate the chromogenic reagent. How-ever, the chromogenic reagent must be selective towards the analyte; otherwise, there may be some possible interferences from the sample matrix. In fact, some researchers not only functionalize the beads, but also use a second reagent that is propelled after the analyte is retained. By doing so, even higher selectivity is obtained.
Almost all the described works use the renewable approach, which means that the sorbents are not reused but renewed after each determination. As previously discussed, this method is not limited by the sensor’s lifetime and no accumula-tion, either of the analyte or of the inter-fering species, is observed. When com-paring the methods that use the reusable or the renewable approach, no significant difference in the throughput is observed. Higher determination rates would be expected for the reusable approach as the
sensor is not built after each analytical cycle. However, the need to elute and wash the beads in the reusable approach, also requires some time, which can decrease the determination rate.
As shown in Table I, the SI-LOV-SPS methods were applied to samples with complex matrices such as human serum, wine, and fresh and coastal waters. In fact, the more recent works (19,21,22) were applied to water samples, showing the increased need for new and more sensitive methods that can be applied to these complex samples. The presented works describe the efficient removal of potential sample matrix interferences was possible and the methods were suc-cessfully applied to the determination of the analyte of interest at trace levels. In fact, limits of detection at the micro-gram-per-liter level were achieved, dem-onstrating the increased sensitivity and selectivity obtained when performing flow-through SPS.
The chosen material for the solid support was agarose because it is easily coated with different molecules to mod-ify its affinity according to the intended determination. This is also a good choice for bead injection in an LOV platform as explained in the following section. Adsorbent Characteristics For the efficient retention and enrich-ment of analytes, and for the efficient removal of possible interfering matrix substances, a suitable sorbent must be selected. The interaction of the analyte with the solid support is of extreme importance, but the adsorbent itself must fulfill some requirements so it can be used as an optosensor in flow-through SPS. The adsorbent characteristics are more important when performing SPS in a bead injection mode. When the sensor is manually placed in the flow cell, there is only the need for optical transparency to prevent high signal background. In the bead injection mode, as the opto-sensor is built by aspirating the beads through the manifold tubing, certain size and material requirements are nec-essary to prevent clogging and scratch-ing of, for example, the LOV channels. According to Ruzicka (17), the particles must be spherical with a size in the range of 20 to 150 µm. The bead size must be homogeneous to ensure reproducibility
A) Out Light In In In Light Light Out Out B) C) Fluorescence
Detector UV-Vis Detector UV-Vis Detector
Figure 4: SI-LOV-SPS flow cell configuration for (a) fluorescence measurements, (b)
UV–vis measurements with a 1-cm flow path, and (c) UV–vis measurements with a 1-mm flow path.
in the SPS method when bead injection is performed in a renewable approach. Soft polymer beads are preferable, as rigid beads may scratch the selection valve. Sephadex and sepharose beads are therefore a good choice for bead injection applications because they fulfill the men-tioned criteria by being globe-shaped and of regular size (13,32).
Conclusions
Automation of sample pretreatment tech-niques is of great interest because they are tedious and time consuming and consume large amounts of toxic reagents. The hyphenation of flow techniques with sample pretreatment techniques was a breakthrough in analytical chemistry because the automation of these tedious methods was possible. Flow-through SPS has been a significant contribution to this field. This technique allows the analyte separation and enrichment by removing possible sample matrix inter-ferences with detection on the surface of the sensor. Therefore, higher sensi-tivity and selecsensi-tivity is achieved when comparing this technique with other on-line sample pretreatment techniques. SI-LOV-SPS was an even bigger advance as sensor preparation, analyte retention, enrichment, detection, and washing can be performed automatically in few steps by computer control.
Nowadays, the concept of green chem-istry receives greater attention to prevent environmental pollution by chemical activities. The main aim is to minimize or eliminate reagent consumption and waste production if possible by auto-mation and miniaturization of the ana-lytical systems. Flow-through SPS is a good contribution in this field because it allows a lower reagent and sample con-sumption with a decrease in waste gen-eration.
In spite of presenting several benefits in on-line sample pretreatment, flow-through SPS also has some disadvantages. Since the sensor is built in the flow cell, high background signal can be experi-enced that may decrease the sensitivity of the method. Also, a gain in sensitivity by increasing the sensor length is difficult, especially when using SI-LOV because the flow path is limited to a maximum of 1 cm.
Acknowledgments
I.C. Santos thanks Fundação para a Ciência e a Tecnologia (FCT, Portu-gal) and Fundo Social Europeu (FSE) through the program POPH–QREN for the grant SFRH/BD/76012/2011. This work was supported by National Funds through FCT, through projects PTDC/ AAG-MAA/3978/2012, and PEst-OE/ EQB/LA0016/2013.
References
(1) S. Motomizu and T. Sakai, in
Comprehen-sive Analytical Chemistry: Advances in Flow Injection Analysis and Related Techniques, 1st Ed. (Elsevier, The Netherlands, 2008), pp.
159–199.
(2) M.D.L. de Castro, in Comprehensive
Ana-lytical Chemistry: Advances in Flow Injec-tion Analysis and Related Techniques, 1st Ed. (Elsevier, The Netherlands, 2008), pp.
204–232.
(3) J. Ruzicka and E.H. Hansen, Anal. Chim.
Acta 78, 145–147 (1975).
(4) J. Ruzicka and G.D. Marshall, Anal. Chim.
Acta 237, 329–343 (1990).
(5) J. Ruzicka, Analyst 125, 1053–1060 (2000). (6) B.F. Reis, M.F. Gine, E.A.G. Zagatto,
J.L.F.C. Lima, and R.A. Lapa, Anal. Chim.
Acta 293, 129–138 (1994).
(7) V. Cerdà, J.M. Estela, R. Forteza, A. Cladera, E. Becerra, P. Altimira, and P. Sit-jar, Talanta 50, 695–705 (1999).
(8) R.A.S. Lapa, J.L.F.C. Lima, B.F. Reis, J.L.M. Santos, and E.A.G. Zagatto, Anal.
Chim. Acta 466, 125–132 (2002).
(9) F. Svec and C.G. Huber, Anal. Chem. 78, 2100–2107 (2006).
(10) D. Šatínský, P. Solich, P. Chocholouš, and R. Karlíček, Anal. Chim. Acta 499, 205– 214 (2003).
(11) M. Fernández, H.M. González-San Miguel, J.M. Estela, and V. Cerdà, TrAC-Trends
Anal. Chem. 28, 336–346 (2009).
(12) M. Miró and E.H. Hansen, TrAC-Trends
Anal. Chem. 25, 267–281 (2006).
(13) M. Miró, S.K. Hartwell, J. Jakmunee, K. Grudpan, and E.H. Hansen, TrAC-Trends
Anal. Chem. 27, 749–761 (2008).
(14) K. Yoshimura, H. Waki, and S. Ohashi,
Talanta 23, 449–454 (1976).
(15) A. Molina-Díaz, J.F. García-Reyes, and B. Gilbert-López, TrAC-Trends Anal. Chem.
29, 654–666 (2010).
(16) S. Matsuoka and K. Yoshimura, Anal. Chim.
Acta 664, 1–18 (2010).
(17) Tutorial on Flow Based microAnalytical
Techinques, J. Ruzicka, Ed. (CD, http://
www.flowinjection.com, USA, 4th Ed., 2009).
(18) S.S.M.P. Vidigal, I.V. Tóth, and A.O.S.S. Rangel, Anal. Methods 5, 585–597 (2013). (19) R. Suárez, R.B.R. Mesquita, M. Rangel, V.
Cerdà, and A.O.S.S. Rangel, Talanta 133, 15–20 (2015).
(20) S.S.M.P. Vidigal, I.V. Tóth, and A.O.S.S. Rangel, Talanta 96, 102–106 (2012). (21) Y.-L. Yu, Y. Jiang, and R.-H. He, Talanta
88, 352–357 (2012).
(22) Y.-L. Yu, Y. Jiang, S. Dou, and J.-H. Wang,
Anal. Methods 4, 1718–1724 (2012).
(23) S.S.M.P. Vidigal, I.V. Tóth, and A.O.S.S. Rangel, Talanta 84, 1298–1303 (2011). (24) I. Lähdesmäki, P. Chocholous, A.D.
Car-roll, J. Anderson, P.S. Rabinovitch, and J. Ruzicka, Analyst 134, 1498–1504 (2009). (25) M. Decuir, I. Lähdesmäki, A.D. Carroll,
and J. Ruzicka, Analyst 132, 818–822 (2007).
(26) K.A. Edwards and A.J. Baeumner, Anal.
Chem. 78, 1958–1966 (2006).
(27) J. Ruzicka, A.D. Carroll, and I. Lähdesmäki,
Analyst 131, 799–808 (2006).
(28) Y. Gutzman, A.D. Carroll, and J. Ruzicka,
Analyst 131, 809–815 (2006).
(29) A.D. Carroll, L. Scampavia, D. Luo, Å. Lernmark, and J. Ruzicka, Analyst 128, 1157–1162 (2003).
(30) Y. Ogata, L. Scampavia, J. Ruzicka, C.R. Scott, M.H. Gelb, and F. Tureček, Anal.
Chem. 74, 4702–4708 (2002).
(31) A.D. Carroll, L. Scampavia, and J. Ruzicka,
Analyst 127, 1228–1232 (2002).
(32) H.M. Oliveira, M. Miró, M.A. Segundo, and J.L.F.C. Lima, Talanta 84, 846–852 (2011).
Inês C. Santos, Raquel B.R. Mesquita, and António O.S.S. Rangel are with the Centro de Biotecnologia e Química Fina (CBQF), Laboratório Associado, Escola Supe-rior de Biotecnologia, at the Universidade Católica Portuguesa/Porto, in Porto, Portu-gal. Direct correspondence to:
For more information on this topic, please visit