Prospects for using DNA barcoding to identify spiders in species-rich genera 27
Prospects for using DNA barcoding to
identify spiders in species-rich genera
Emily A. Robinson, Gergin A. Blagoev, Paul D.N. Hebert, Sarah J. Adamowicz
Biodiversity Institute of Ontario, University of Guelph, 50 Stone Road East, Guelph, Ontario, Canada
Corresponding author: Gergin A. Blagoev ([email protected])
Academic editor:Pavel Stoev | Received 1 June 2009 | Accepted 15 July 2009 | Published 29 July 2009
Citation: Robinson EA, Blagoev GA, Hebert PDN, Adamowicz SJ (2009) Prospects for using DNA barcoding to iden-tify spiders in species-rich genera. In: Stoev P, Dunlop J, Lazarov S (Eds) A life caught in a spider's web. Papers in arach-nology in honour of Christo Deltshev. ZooKeys 16: 27-46. doi: 10.3897/zookeys.16.239
Abstract
While previous research has indicated the utility of DNA barcoding in identifying spider species sampled from a localized region, the ef ectiveness of this method over a broader geographic scale and with denser taxon sampling has not yet been extensively considered. Using both new and published data from 1801 individuals belonging to 361 morphospecies, this study examined intra- and interspecii c divergences for 19 genera that were each represented by at least 10 morphospecies. We particularly focused on increasing species-level sampling in order to better characterize levels of interspecii c divergence within species-rich genera and to examine the prevalence of a “barcode gap” (discontinuity between intra- and interspecii c di-vergences). Overall, the mean intraspecii c divergence value was found to be 2.15%, the average maximum intraspecii c divergence was 3.16%, while the mean divergence between nearest interspecii c neighbours was 6.77%, demonstrating the typical presence of a barcode gap. Of the 66% of morphospecies that formed monophyletic sequence clusters, the majority (92.5%) possessed a barcode gap. We also examine possible biological explanations for the large proportion of paraphyletic and polyphyletic clusters and discuss the need for further taxonomic investigations. h e overlap between intra- and interspecii c divergences was not unexpected for some ‘species’, such as Pardosa groenlandica, since prior morphological studies have suggested that it is an example of a species complex. However, other cases of high intraspecii c divergences may rel ect cryptic species diversity, indicating the need for a taxonomic approach that combines both morphological and molecular methods. h e list of the species, COI sequences, and source references used in the analysis is published as a dataset under doi: 10.3897/zookeys.16.239.app.A.ds. h e list of analyzed species, mean and maximum intraspecii c divergences, distances to the nearest neighbouring species in its genus, general localities, and lifestyle characteristics is published as a dataset under doi: 10.3897/zookeys.16.239.app.B.ds.
Keywords
DNA barcoding, Araneae, spiders, genetic variability, intraspecii c divergence, interspecii c divergence, monophyly, paraphyly
ZooKeys 16: 27-46 (2009) doi: 10.3897/zookeys.16.239 www.pensoftonline.net/zookeys
Copyright Emily A. Robinson et al.This is an open access article distributed under the terms of the Creative Commons Attribution License, which permits unrestricted use, distribution, and reproduction in any medium, provided the original author and source are credited.
Launched to accelerate biodiversity research
A peer-reviewed open-access journal
Introduction
DNA barcoding – the use of short, standardized gene regions for species identii ca-tion and discovery (Hebert et al. 2003) – has proven to be very ef ective in identifying specimens to species level for many dif erent groups of organisms, from butterl ies (Lukhtanov et al. 2009) to birds (Kerr et al. 2007) to plants (Kress et al. 2005). For groups in which identii cation can be very dii cult, the potential utility of DNA bar-coding is immense. Spiders are one such group, with 40,700 spider species and sub-species belonging to 109 families recognised worldwide (Platnick 2009).
Morphology-based identii cations of spiders are time consuming and problematic for several reasons. With some groups, it is dii cult or impossible to identify juve-niles, which are the most abundant individuals at certain times of the year. Another challenge for identii cation is striking sexual dimorphism, especially in some weavers (Nephila and Micrathena), or the lack of information on diagnostic characters for one sex. In fact, 46% of spider descriptions consider just one sex, and 1.5% are based upon juveniles only (Platnick 2009), subsequently making it dii cult to match sexes and life stages. Even identii cation of known adults is time consuming, because the major-ity of species require detailed examination and even dissection of the sexual organs for authoritative identii cation (Locket and Millidge 1951). h ese factors represent major obstacles for large ecological studies and biotic surveys of spiders but are ones that could be overcome by DNA barcoding. DNA barcoding could also assist in both distinguishing species with similar morphologies (sister species), a common issue with spiders due to their overall long-term evolutionary morphological stasis (Bond et al. 2001), as well as in resolving the status of subspecies.
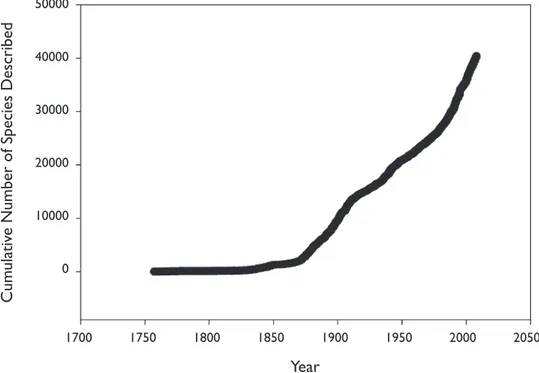
In addition to assisting with the identii cation of known species and helping to solve taxonomic problems, DNA barcoding is likely to be useful for species discov-ery in spiders, where many species await discovdiscov-ery (Fig. 1). Although the majority of undescribed species are expected to inhabit the tropics, certain temperate regions of the world are clearly underexplored. Interestingly, last year twice as many new taxa were described from China as from North America (Platnick 2009). h erefore, DNA barcoding could play an important role in an iterative taxonomic program, l agging cases of potential new species or cryptic species (Hebert et al. 2004) among both ju-veniles and adults, thus focusing further collecting or taxonomic attention where it is needed most. Many authors now emphasize that the combination of morphological, molecular, and other types of data is the best approach for identifying and describing new species (Dayrat 2005; DeSalle et al. 2005; Gibbs 2009). In this respect, strong collaboration between molecular systematists and traditional taxonomists is necessary to increase the accuracy, speed, and accessibility of identii cations (Hebert and Barrett 2005). h e present paper represents an example of such a collaboration.
Prospects for using DNA barcoding to identify spiders in species-rich genera 29
for a 100% success rate in matching duplicate specimens to their species among the taxa included in their study. However, two important constraints limit the generality of their conclusions: only a small fraction of known diversity was included, less than 0.005% of spider species (Prendini 2005), and taxon sampling was sparse, with only 5 genera be-ing represented by more than 4 species. While the collections used in their study were augmented by museum material, most of the specimens were collected from southern Ontario (Barrett R., pers. comm.), leading some to question the utility of DNA barcod-ing for spiders that are more broadly sampled (Prendini 2005). One reason for this is that increased geographical coverage may lead to greater intraspecii c variability, reduc-ing or potentially swampreduc-ing the “barcode gap”, which is a typical discontinuity between levels of intraspecii c and interspecii c divergence that allows for successful identii cation. Secondly, since allopatric speciation is thought to be the dominant mode of speciation (Coyne and Orr 2004), many more closely related species pairs are also expected to be en-countered as geographic coverage expands. While locality information could be incorpo-rated into identii cation algorithms to address this issue, it would be simplest if barcoding were to work globally across specimens from any site from any lineage, even species-rich ones, especially since a desired application is to be able to detect invading species.
Some progress has been made to address these issues in spiders, with recent studies using COI to examine divergences within and between species collected regionally or globally (Table 1). While one study that considered 61 species in the family Pholcidae Figure 1. Cumulative number of spider species described over time, including only species that are cur-rently valid (description years for all valid species follow Platnick 2009).
Cum
ulativ
e Number of Species Described
50000
40000
30000
20000
10000
0
1700 1750 1800 1850 1900 1950 2000 2050
E
mily A. R
obinson et al. / Z
ooK
eys 16: 27-46 (2009)
divergence values but did have all of their sequences deposited in GenBank, ranges were recalculated based on the studies’ original data (indicated by *).
Reference Taxonomic level # species # sequences
Geographic coverage
Range of mean intraspecii c divergence
values
Range of max intraspecii c divergence values
Range of interspecii c divergence values
Hedin 2001 species in a genus 11+1 for outgroup
22 US 1.04-21.64% (using model HKY85+1); 0.83-16.23%*
0.83-17.74%* 8.39-18.71%* (mean)
Paquin and Hedin 2004
species in a genus 26+1 for outgroup
104 US & Canada 0-3.96% 1.73-12.03% (min)
Ayoub et al. 2005 species from 2 agelenid genera
15+2 for outgroup
83 US & Canada 0.2-9%
Barrett and Hebert 2005
species from >1 family
168 292 North America 0-3.6% 0.4-7.4% 6.5-23.1% (mean)
Greenstone et al. 2005
species from >1 family
34 38 New data from the US
Successfully identii ed immature specimens to species using DNA barcoding
Astrin et al. 2006 species in 1 family
61 112 Neotropics, US, Germany, & more
0-10.9% (min to max)
8.7-28.5% (min to max) Garb and Gillespie
2006
species from 3 thomisid genera
33 64 Austral Islands, Hawaiian Islands, US, & more
Max 8.9% (uncorrected)
10.1-14%
Chang et al. 2007 1 species 1 86 China 0.1-1.8%
(min to max)
6.4-9.4%
Johannesen et al. 2007
species in a genus 8+6 for comparison
18 Africa, India, & more
2.7-6.5% (uncorrected) 6.3-8.4% (uncorrected)
Stockman and Bond 2007
1 genus 198 Northern
California
Detected 5 cryptic species by using a combined approach that included an analysis of variability in COI
Binford et al. 2008 species from 4 genera
40+2 for outgroup
57 US, Mexico, Argentina, S. Africa, & more
1.5-16.3% (uncorrected) 16-18% (uncorrected)
Wang et al. 2008 species in 1 family
Prospects for using DNA barcoding to identify spiders in species-rich genera 31
found a maximum intraspecii c divergence value of 10.9%, which was greater than the minimum interspecii c divergence value of 8.7%, overall there was little overlap between the two categories of divergence (Astrin et al. 2006). Binford et al. (2008) also found slight overlap in intraspecii c and interspecii c divergence values in 40 species from 4 genera as well as one anomalously high intraspecii c divergence value (16.3%) in Loxosceles speluncarum, a taxon which they suggested may represent a species com-plex. Garb and Gillespie (2006), however, did i nd evidence of a barcode gap in their 64 widely collected specimens representing 33 species, even with a maximum intraspe-cii c divergence value of 8.9% (Table 1).
Currently, global-scale taxonomic campaigns are underway to test barcoding suc-cess in geographically widespread and species-rich clades. In the continent-wide and large-scale regional campaigns that have been conducted thus far, high identii cation success and low intraspecii c variability have been found in birds of North America and Argentina (Kerr et al. 2007, 2009). Increased intraspecii c divergence did, how-ever, arise in central Asian butterl ies that were sampled across a broad range, but this problem was addressed through a clustering method rather than a divergence thresh-old concept (Lukhtanov et al. 2009). DNA barcoding has therefore been shown to be successful in the face of high species richness sampled allopatrically, but the need for broader sampling and testing of more taxonomic groups remains.
In this study, we build upon previous studies examining COI sequence diversity in spiders (Table 1) to explore patterns of genetic variability in this group more broadly. We specii cally aim to extend taxon coverage within specirich genera to better es-timate minimum interspecii c and maximum intraspecii c divergences. We use this information to draw inferences about whether or not closely related species sampled allopatrically can be distinguished using either a threshold or clustering approach. Based on original and publicly available data, we investigate genetic patterns within and among species belonging to 19 species-rich genera to examine the evidence for a barcode gap in broadly distributed species.
Methods
New data
Collection procedure
Protocol for barcoding
Following photography of the whole specimen, a section of one leg was removed and placed in a well of a 96-well plate containing ethanol. One well was left empty in each plate to serve as a negative control. A standard Glass-Fibre protocol, (Ivanova et al. 2006) was used for DNA extraction. First, 50 μL of a mixture of 5 mL of insect lysis buf er and 500 μL of Proteinase K (20mg/L) was added to each well of the plate. h e plate was then incubated overnight at 50°C before being centrifuged. A liquid-handling robot carried out the remaining series steps that included the addition of binding mix into each well followed by vacuuming and washing using protein wash buf er (Ivanova et al. 2006).
For the polymerase chain reaction (PCR), the standard PCR cocktail concen-trations of the Canadian Centre for DNA barcoding were employed (Ivanova and Grainger 2007). To amplify the target gene, cytochrome c oxidase subunit I (COI), either the Folmer primer pair (tailed with M13), a universal metazoan primer (Folmer et al. 1994), or Lep primers (Hebert et al. 2004) were used. h e PCR thermal regime was as follows: 94°C for a minute; 5 replicates of 94°C for a minute, 45°C for 40 sec-onds, and 72°C for one minute; 35 cycles of a minute at 94°C, 40 seconds at 51°C, and 72°C for a minute; and concluding with i ve minutes at 72°C.
All PCR products were sequenced bi-directionally on an ABI3730XL using the primer pair of M13F and M13R or Lep-F or Lep-R. h e forward and reverse sequenc-es were used to generate a single consensus sequence using CodonCode Aligner v. 3.0.2 (CodonCode Corporation).
Accessible data
In order to include as many genera in the analysis as possible, publicly available data in BOLD (Ratnasingham and Hebert 2007) were combined with the newly obtained sequences. Most of the data from BOLD were originally obtained from GenBank and include specimens collected around the world by various methods and researchers. All species names, BOLD or GenBank accession codes, and general localities are provided in Appendix A. For original data, additional locality details as well as the sequence data are available in the following project in BOLD: “Spiders in species rich genera”.
Analysis of genetic divergence patterns
Prospects for using DNA barcoding to identify spiders in species-rich genera 33
combined. Only specimens with species-level identii cations and sequence lengths greater than 420 base pairs were included in this analysis, resulting in a dataset consist-ing of 1801 individuals and 361 species.
With the sequence analysis tools available in BOLD, distance summary analysis as well as nearest-neighbour (NN) analysis were performed for each genus separately us-ing the Kimura-2-Parameter (K2P) genetic distance model (Kimura 1980) with pair-wise deletion of missing sites. For each species, mean intraspecii c divergence, maxi-mum intraspecii c divergence, and mean NN distance (average distance to the most closely related species) were computed. h e averages and ranges of these values were tallied and compared among genera.
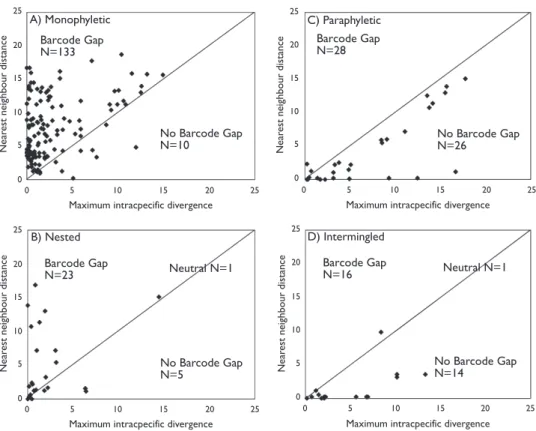
Using the 200 morphospecies represented by two or more individuals, we checked for the presence of a “barcode gap”, a disjunction between levels of intraspecii c and interspecii c variability, by plotting maximum intraspecii c divergences against mean NN distances. Additionally, we explored whether this pattern varied among mor-phospecies displaying dif erent topological patterns in the Neighbour-joining (NJ) (Saitou and Nei 1987) phenogram for each genus. Each morphospecies was assigned to one of four topological categories depending upon its sequence clustering pattern: monophyletic (and reciprocally monophyletic from the nearest neighbour), nested (monophyletic cluster nested within a paraphyletic species), paraphyletic, or inter-mingled (polyphyletic). Four anomalous specimens each failed to group with its own morphospecies and additionally had an average distance of more than 10% from its morphospecies; these specimens were excluded from further analysis under the as-sumption of misidentii cation. Morphospecies that formed monophyletic and para-phyletic clusters were retained regardless of the genetic distances. h e relationship between topology category and presence/absence of a barcode gap was plotted for all data together and for just those specimens examined in the present study (for the three genera that were represented by more than 5 species once GenBank data were excluded: Pardosa, Tetragnatha, and Xysticus).
Life histories and geographic distributions of species
state or single other country), continental (regional to continental: collected from at least two provinces or states or countries), or intercontinental (collected from at least two continents). If increasing geographical scope results in greater intraspecii c and lower interspecii c divergences, then the ratio between NN distance and intraspecii c distance is expected to decrease as geographical sampling increases, resulting in lower barcode identii cation success. One-way ANOVAs were used to test for dif erences in genetic patterns among lifestyles of regionally sampled species as well as among the geographical distribution categories, while box-and-whiskers plots were used to ex-plore the data graphically.
Results
Range of divergence values
When all available data were considered, divergence values were fairly variable across gen-era. Mean intraspecii c divergences within morphospecies ranged from a low of 0.61% in Cyclosa to a high of 10.86% in Hypochilus. h e latter genus also included the highest observed intraspecii c divergence value – 17.74% (Table 2; Appendix B). Although some of these divergence values are very high, they were still, in most cases, less than the NN distances. Average NN distances ranged from 2.38% in Geolycosa to 14.10% in Pimoa. However, 0% divergences were found in 5 species pairs belonging to 3 genera: Cicurina caliga / C. hoodensis, Cicurina vespera / C. madla, Latrodectus variegates / L. mirabilis, Latrodectus corallinus / L. diaguit, and Schizocosa ocreata / S. rovneri (Table 2).
While a greater dif erence between intraspecii c divergences and NN distances was expected when published data (which originated from many sources) were excluded, some high intraspecii c divergence values remained in our new dataset. In Xysticus, the average of mean intraspecii c divergences was 2.12%, with a maximum intraspecii c divergence of 9.21% in Xysticus durus (Table 2). However, even though mean NN dis-tances were reduced in both Pardosa and Xysticus when only new data were considered, no cases remained of species with NN distances of 0%.
P
rospects for using DNA bar
coding to identify spiders in species-rich gener
a
35
Table 2. Summary of COI divergence patterns within and among species belonging to 19 diverse spider genera. Divergence values for 3 of the genera are also pro-vided using new data only (indicated in bold).
Genus No. of
species (total, species with 2+ individuals)
No. of sequences (total, those belonging to species with 2+ individuals)
Mean intraspecii c divergence (average and range across species)
Max. intraspecii c divergence (average and range across species)
Mean nearest neighbour distance (average and range across species)
Geographical distribution (of species included in this study)
Agelenopsis 12, 10 109, 107 1.65 (0.17-5.3) 2.49 (0.17-7.21) 2.55 (0.17-6.81) Continental
Anoteropsis 20, 7 31, 18 0.95 (0.23-1.82) 1.16 (0.23-3.15) 2.59 (0.23-4.17) Regional
Cicurina 21, 15 91, 85 0.63 (0-4.1) 0.94 (0-4.1) 6.30 (0-12.44) Continental
Cyclosa 13, 5 30, 22 0.61 (0.15-1.11) 0.96 (0.37-1.48) 9.29 (5.9-13.22) Continental
Dolomedes 11, 8 27, 24 1.01 (0.17-2.55) 1.30 (0.17-3.94) 4.24 (1.85-6.84) Intercontinental
Dysdera 58, 32 173, 147 4.65 (0-14.89) 5.63 (0-16.66) 11.57 (0.17-17.86) Intercontinental
Geolycosa 14, 12 149, 147 2.25 (0.33-6.32) 4.11 (0.33-6.92) 2.38 (0.17-12.78) Regional
Hypochilus 10, 6 22, 18 10.86 (0.83-16.23) 11.75 (0.83-17.74) 14.08 (8.39-18 .71) Regional
Latrodectus 17, 12 85, 80 1.49 (0-8.35) 2.43 (0-8.72) 6.12 (0-12.39) Intercontinental
Misumenops 24, 4 56, 36 3.20 (0.30-7.09) 4.99 (0.52-9.92) 4.90 (1.46-11.25) Intercontinental
Neriene 11, 3 19, 11 2.21 (0.17-3.67) 4.40 (0.33-10.09) 12.90 (8.64-17.9) Continental
Orsonwelles 12, 7 30, 23 0.93 (0-1.76) 1.36 (0-3.06) 3.80 (1.15-8.93) Regional
Pardosa 30, 21 413, 404 0.77 (0-5.47) 1.44 (0-7.63) 4.09 (1.26-7.53) Intercontinental
Pardosa-new data only 13, 10 306, 303 0.64 (0.15-2.53) 1.62 (0.15-3.87) 3.49 (1.26-5.47)
Pholcus 23, 14 66, 55 1.07 (0-4.66) 2.03 (0-12.44) 4.30 (0.16-17.72) Intercontinental
Pimoa 10, 3 56, 49 4.07 (2.16-7.68) 6.17 (2.37-12.48) 14.10 (11.74-16.52) Intercontinental
Schizocosa 10, 4 51, 45 0.73 (0.34-1.21) 1.53 (0.95-2.09) 2.91 (0-6.25) Continental
Tetragnatha 33, 27 272, 266 2.90 (0-10.67) 5.19 (0-15.7) 8.73 (1.27-17.7) Intercontinental
Tetragnatha-new data only 8, 6 73, 71 1.07 (0.31-1.54) 2.39 (0.53-5.92) 9.47 (1.27-16.36)
h eridion 18, 2 23, 7 0.82 (0.67-0.96) 1.50 (1.46-1.53) 6.78 (3.48-12.7) Continental
Xysticus 14, 8 98, 92 2.12 (1.07-3.95) 3.91 (1.84-9.21) 6.99 (3.46-8.86) Intercontinental
Xysticus-new data only 12, 8 97, 93 2.12 (1.07-3.95) 3.91 (1.84-9.21) 6.85 (3.46-8.89)
Figure 2. Box-and-whisker plots of average intraspecii c divergence for 16 genera represented by more than 3 species (Neriene, Pimoa, and h eridion were excluded). h e life history of each genus is also indicated.
Figure 3. Bar graph with standard errors showing the dif erences in mean (in black) and maximum (in grey) intraspecii c divergence as well as nearest-neighbor distance (in white) between the three geographi-cal distribution categories.
18
Anoter
opsis
Sc
hyz
ocosa
Geolycosa Misumenops
Dysder
a
Dolomedes
Pa
rdosa
Xysticus
12
6
0
A
vera
g
e intraspecific div
erg
e
nce
Active hunters Sit & wait predators
Web builders
Ag
elenopsis
Latr
odectus
Cyc
losa
Pholcus
Cicur
ina
Or
sonwelles
Hypoc
hilus
Tetr
agnatha
P
e
rc
ent div
erg
e
nce
Regional (N=139)
16
14
12
10
8
6
4
2
0
Prospects for using DNA barcoding to identify spiders in species-rich genera 37
Types of sequence topologies within
morphospecies and presence of a barcode gap
Among the newly collected data, a greater proportion of the morphospecies formed monophyletic sequence clusters. Of the 24 morphospecies, 22 (92%) were mono-phyletic, as opposed to 66.5% of the morphospecies examined when all of the data were combined. h e remaining two morphospecies examined in the present study possessed a paraphyletic topology. When GenBank data were included, 14% of morphospecies were paraphyletic, 11% were nested, and 8% were intermingled. h e proportion of monophyletic morphospecies in these two datasets ultimately af ected how frequently a barcode gap was present, with a gap observed in 83.3% of morphospecies when only new data were considered and 71.5% when all data were used. Among those morphospecies within the monophyletic category, how-ever, there was very little dif erence between the two datasets in the proportion that lacked a barcode gap. When GenBank data were excluded, a barcode gap was absent for 13.6% of monophyletic morphospecies, while 7.5% of monophyletic morphos-pecies lacked a gap when the data were combined (Fig. 4). A barcode gap was more frequently absent in the combined dataset for species belonging to the three other
Figure 4. Maximum intraspecii c divergence compared with nearest-neighbour distance of monophylet-ic morphospecies for all data and using only new data, whmonophylet-ich have been identii ed by a single spider tax-onomist. Most species (92.5%) fall above the 1:1 line, indicating the presence of a “barcode gap”.
Near
est neighbour distance
Maximum intracpecific divergence
All data
25 25
20 20
15 15
10 10
5 5
0 0
New data
Barcode Gap
categories, with 92.9% of paraphyletic morphospecies (Fig. 5C), 87.5% of inter-mingled morphospecies (Fig. 5D), and 21.7% of nested morphospecies lacking a barcode gap (Fig. 5B).
Divergences of broadly sampled species
To address the issue of broader geographic sampling within species potentially di-minishing the barcode gap, intraspecii c divergence values and NN distances were considered for 3 morphospecies represented by specimens collected from at least 2 geographically distant sites, more than 1000 km apart. A barcode gap was clearly present in 2 of these cases. Xysticus emertoni, collected from 2 sites in Southern On-tario as well as in Saskatchewan, showed a maximum intraspecii c divergence value of 2.2% while the NN distance was 3.46%. A maximum intraspecii c divergence
Figure 5. Maximum intraspecii c divergence compared with nearest-neighbor distance using all data for the four categories of topology: A monophyletic (133 cases), B nested (23 cases), C paraphyletic (28 cases), and D intermingled (16 case). See Methods for dei nitions. 89.7% of monophyletic and nested species fall above the 1:1 line, indicating the presence of a barcode gap, while 90.9% of paraphyletic and intermingled species fall below this line.
Near
est neighbour distance
Near
est neighbour distance
Near
est neighbour distance
Near
est neighbour distance
Maximum intracpecific divergence
Maximum intracpecific divergence
Maximum intracpecific divergence
Maximum intracpecific divergence
25 25 20 20 15 15 10 10 5 5 0 0 25 20 15 10 5 0 25 20 15 10 5 0 25 20 15 10 5 0 25 20 15 10 5 0 25 20 15 10 5 0 25 20 15 10 5 0 Barcode Gap N=133 Barcode Gap N=23 Barcode Gap N=28 Barcode Gap
N=16 Neutral N=1
Neutral N=1
A) Monophyletic C) Paraphyletic
B) Nested D) Intermingled
No Barcode Gap N=10
No Barcode Gap N=5
No Barcode Gap N=26
Prospects for using DNA barcoding to identify spiders in species-rich genera 39
value of 2.4% and a NN distance of 7.26% were found in Tetragnatha versicolor, a species collected from Manitoba and 3 sites in Southern Ontario. However, Pardosa groenlandica, which was collected from Michigan, Alberta, and Churchill, Manito-ba, had a maximum intraspecii c divergence value of 3.87% and a nearest neighbour distance of only 1.26%.
Because locality information was available from the source papers for some of the GenBank records, it was possible to examine genetic variability in species collected glo-bally. While maximum intraspecii c divergence (5.11%) did exceed the NN distance of 0.17% in Dysdera crocata, a species collected from the Canary Islands, Canada, and Spain, a barcode gap was present for three other broadly sampled species. Latrodec-tus geometricus, sampled from Argentina, Hawaii, and Florida, showed a maximum intraspecii c divergence value of 2.39% and an NN distance of 12.39%. While the maximum intraspecii c divergence value was high in Pholcus phalangioides (7.13%), a species collected from Brazil, Spain, and Germany, it remained below the NN distance of 17.72%. Represented by individuals from Canada and French Polynesia, a barcode gap was also detected in Tetragnatha laboriosa, with a maximum intraspecii c diver-gence value of 2.67% and an NN distance of 13.88%.
Discussion
Our study sought to determine the suitability of DNA barcoding for identifying spi-ders by examining genetic variability in 19 species-rich genera. Overall, a barcode gap – a discontinuity in levels of intraspecii c compared to interspecii c genetic divergences – was detected for a large proportion of the species, even though some very high val-ues of intraspecii c divergence and very low NN distances were observed. We explore possible biological and artefactual explanations for these extreme values. h is study furthers our understanding of genetic divergence patterns, the degree of concordance between taxonomy and genetic results, and geographical distributions of lineages. Fur-ther study on genetic patterns and processes of evolution will enhance our ability to create a barcode-based species identii cation system in spiders as well as advance our knowledge of spider biology.
Presence of a barcode gap
the 2.15% observed in this study. However, even the value obtained from their local study was higher than intraspecii c divergences reported in other taxonomic groups. For example, mean intraspecii c divergence was 0.6% in 81 of 87 species of bats exam-ined in Guyana (Clare et al. 2007) and just 0.23% in North American birds (Kerr et al. 2007). In a study of 300 aphid species, Foottit et al. (2008) found an overall average intraspecii c divergence of just 0.2%. When 39 of these species that were represented by replicate individuals from widely separated geographical regions were considered, divergences were still modest, with 30 of the species showing <0.7% divergence and the remaining 9 possessing divergences ranging from 0.7 to 3.1%.
High intraspecii c divergence values were not the only cause of more spider mor-phospecies lacking a barcode gap in our study; interspecii c divergence values (or NN distances) were also low in comparison to previous i ndings. h e average minimum interspecii c divergence within genera was 9.2% in Barrett and Hebert (2005) but was only 2.61% in our study. Although Paquin and Hedin (2004) did observe some similarly low values for interspecii c divergence, most other previous studies on spi-ders have found interspecii c divergence values closer to those of Barrett and Hebert (2005) (Table 1). h e denser taxon sampling in the present study certainly reduced inter-species distances, but this low average value was also inl uenced by the i ve species pairs with a NN distance of 0%. In light of the broad range and diverse sources of data included in the present study, the high rate of barcode gap detection is perhaps more remarkable than its absence in a small fraction of cases.
Potential causes of anomalous values in published data
While the causes of the high intraspecii c divergence values (especially in Hypochilus, Dysdera, and Pimoa, where the average mean exceeded 4%), the low interspecii c diver-gence values (which averaged below 3% in Geolycosa, Anoteropsis, and Agelenopsis), and the large number of paraphyletic and interspersed morphospecies cannot accurately be determined in the scope of this study, previous research has provided multiple possible explanations.
Prospects for using DNA barcoding to identify spiders in species-rich genera 41
the sclerotized region covering the internal female genitalia) within P. groenlandica, suggesting the need for further investigation of this morphospecies.
h e previous studies from which the 5 species pairs having 0% NN distances origi-nated were unable to establish the exact cause of the lack of interspecii c divergence. How-ever, for the species pairs of Cicurina caliga / C. hoodensis and Cicurina vespera / C. madla, Paquin and Hedin (2004) suggested that the explanation could either be introgression or the species being synonymous. Synonymy was also used to explain the lack of genetic divergence between Latrodectus variegates / L. mirabilis (Garb et al. 2004), while incom-plete lineage sorting and hybridization were proposed for Schizocosa ocreata / S. rovneri and Latrodectus corallinus / L. diaguita (Hebets and Vink 2007; Garb et al. 2004).
Although 90.9% of paraphyletic and interspersed ‘species’ lacked a barcode gap, 22% of morphospecies in this study possessed these sequence patterns. It would be benei cial to consider why this pattern occurred and whether these morphospecies are in fact valid taxa. Firstly, it is important to consider that paraphyly can occur naturally and is an expectation of many speciation processes (Kuntner and Agnarsson 2006). Potential causes for species displaying an interspersed pattern include hybridization, molecular introgression, and rapid morphological divergence due to selection on certain traits. An-other possible explanation is convergent evolution, which is thought to rarely occur, but that has been recently suggested to explain colour polymorphisms in the family h e-ridiidae (Oxford 2009), behaviors in Hawaiian Tetragnatha (Blackledge and Gillespie 2004), and secondary sex traits in Padilla (Andriamalala 2007). However, such types of characters are seldom used as the basis for species discrimination in spiders. Since a far smaller proportion of species in the new dataset were paraphyletic or interspersed (8%), misidentii cations may also explain some cases in the published data.
Prospect of a DNA barcode identii cation system for spiders
Despite the clear need for further systematic studies and for harmonization of molecular and taxonomic data, the results of this study are promising. Rapid identi-i catidenti-ion of spidenti-iders usidenti-ing DNA barcodidenti-ing methods identi-is expected to become identi-increasidenti-ingly accurate, af ordable, and attainable. Due to their diversity and important position in terrestrial foodwebs, biosurveillance protocols that include spiders are highly desirable. We propose that collaboration towards building a global community resource – con-sisting of expert-identii ed specimens in permanent collections linked to online speci-men and sequence records – will be the most productive step towards understanding and enabling research on global spider biodiversity.
Acknowledgements
h is work was supported by grants to PDNH from the Natural Sciences and Engineer-ing Research Council of Canada (NSERC) International Polar Year fund, Genome Canada through the Ontario Genomics Institute, the Canada Foundation for Innova-tion, the Ontario Innovation Trust, and Discovery grants from NSERC. We thank staf of the Canadian Centre for DNA Barcoding and the Biodiversity Institute of Ontario for processing, photographing, and sequencing the spiders, and the follow-ing colleagues for collectfollow-ing specimens: A. Borisenko, A.L. Turnbull, A. Smetana, A. Stirling, C. Carr, C.D. Dondale, C. Ewing, D.B. Lyons, D.C. Lowrie, D. Gillespiel, D.M. Campbell, F.G. Mailloux, F.W. Howard, G. Belanger, G. Gibson, G. Mailloux, G. Wood, J.C. Cokendolpher, J. deWaard, J.E. Cokendolpher, J.E. Cossey, J.F. Doane, J.M. Hardman, J. Peck, J.R. Straka, J. Redner, J. Sones, K. Perez, L. Humble, L. Tabri-zi, L. Wallace, M. Wood, N.R. Fridzen, N.W. Jef ery, O. Kukal, R.A. Cannings, R.B. Semple, R. Bell, R.G. Bennett, R.G. Holmberg, R.I.G. Morrison, R.L. Lake, S.A. Marshall, S.C. Cokendolpher, S.G. Cannings, S. McCubbin, S. Peck, T.J. Rypien, T. Pajunen, T. Spence, T. Wang, T. Wright, and W.D. Charles. We thank two anonymous reviewers for insightful comments that improved this contribution.
References
Andriamalala D (2007) Revision of the genus Padilla Peckham and Peckham, 1894 (Araneae: Salticidae) – convergent evolution of secondary sexual characters due to sexual selection and rates of molecular evolution in jumping spiders. Proceedings of the California Acad-emy of Sciences 58: 243-330.
Astrin JJ, Huber BA, Misof B, Klütsch CFC (2006) Molecular taxonomy in pholcid spiders (Pholcidae, Araneae): evaluation of species identii cation methods using CO1 and 16S rRNA. Zoologica Scripta 35 (5): 441-457.
Prospects for using DNA barcoding to identify spiders in species-rich genera 43
Barrett RDH, Hebert PDN (2005) Identifying spiders through DNA barcodes. Canadian Journal of Zoology 83: 481-491.
Binford GJ, Callahan MS, Bodner MR, Rynerson MR, Núñez PB, Ellison CE, Duncan RP (2008) Phylogenetic relationships of Loxosceles and Sicarius spiders are consistent with Western Gondwanan vicariance. Molecular Phylogenetics and Evolution 49: 538-553. doi:10.1016/j.ympev.2008.08.003.
Blackledge TA, Gillespie RG (2004) Convergent evolution of behavior in an adaptive radiation of Hawaiian web-building spiders. Proceedings of the National Academy of Sciences USA 101: 16228-16233.
Bond JE, Hedin MC, Ramirez MG, Opell BD (2001) Deep molecular divergence in the ab-sence of morphological and ecological change in the Californian coastal dune endemic trapdoor spider Aptostichus simus. Molecular Ecology 10: 899-910.
Chang J, Song D, Zhou K (2007) Incongruous nuclear and mitochondrial phylogeographic patterns in two sympatric lineages of the wolf spider Pardosa astrigera (Araneae: Lycosidae) from China. Molecular Phylogenetics and Evolution 42: 104-121.
Clare EL, Lim BK, Engstrom MD, Eger JL, Hebert PDN (2007) DNA barcoding of Neotropical bats: species identii cation and discovery within Guyana. Molecular Ecology Notes 7: 184-190. Comstock JH (1965) h e spider book. Vail-Vallou Press, Inc., New York, 729 pp.
Coyne JA, Orr HA (2004) Speciation. Sinauer Associates., Sunderland, MA, 545 pp.
Dayrat B (2005) Towards integrative taxonomy. Biological Journal of the Linnean Society 85: 407-415.
DeSalle R, Egan MG, Siddall M (2005) h e unholy trinity: taxonomy, species delimitation, and DNA barcoding. Philosophical Transactions of the Royal Society, London B-Biologi-cal Science 360: 1905-1916.
Dondale CD (1999) Revision of the groenlandica subgroup of the genus Pardosa (Araneae, Lycosidae). h e Journal of Arachnology 27: 435-448.
Dondale CD, Redner JH (1978) h e insects and arachnids of Canada, Part 5. h e crab spiders of Canada and Alaska, Araneae: Philodromidae and h omisidae. Research Branch, Agri-culture Canada 1663: 1-255.
Dondale CD, Redner JH (1990) h e insects and arachnids of Canada, Part 17. h e wolf spi-ders, nurseryweb spispi-ders, and lynx spiders of Canada and Alaska, Araneae: Lycosidae, Pis-auridae, and Oxyopidae. Research Branch, Agriculture Canada 1856: 1-383.
Dondale CD, Redner JH, Paquin P, Levi HW (2003) h e insects and arachnids of Canada. Part 23. h e orb-weaving spiders of Canada and Alaska (Araneae: Uloboridae, Tetragnathidae, Araneidae, h eridiosomatidae). NRC Research Press, Ottawa, 371 pp.
Folmer O, Black M, Hoeh W, Lutz R, Vrijenhoek R (1994) DNA primers for amplii cation of mitochondrial cytochrome c oxidase subunit I from diverse metazoan invertebrates. Mo-lecular Marine Biology and Biotechnology 3: 294-299.
Foottit RG, Maw HEL, Von Dohlen CD, Hebert PDN (2008) Species identii cation of aphids (Insec-ta: Hemiptera: Aphididae) through DNA barcodes. Molecular Ecology Resources 8: 1189-1201. Garb JE, Gillespie RG (2006) Island hopping across the central Pacii c: mitochondrial DNA
Garb JE, González A, Gillespie RG (2004) h e black widow spider genus Latrodectus (Araneae: h eri-diidae): phylogeny and invasion history. Molecular Phylogenetics and Evolution 31: 1127-1142. Gibbs J (2009) Integrative taxonomy identii es new (and old) species in the Lasioglossum ( Di-alictus) tegulare (Robertson) species group (Hymenoptera, Halictidae). Zootaxa 2032: 1-38. Greenstone MH, Rowley DL, Heimbach U, Lundgren JG, Pfannenstiel RA, Rehner SA (2005)
Barcoding generalist predators by polymerase chain reaction: carabids and spiders. Molecu-lar Ecology 14: 3247-3266.
Hebert DNP, Barrett DHR (2005) Reply to the comment by L. Prendini on “Identifying spi-ders through DNA barcodes”. Canadian Journal of Zoology 83: 505-506.
Hebert PDN, Cywinska A, Ball SL, deWaard JR (2003) Biological identii cations through DNA barcodes.Proceedings of the Royal Society B: Biological Sciences 270: 313-322. Hebert PDN, Penton EH, Burns JM, Janzen DH, Hallwachs W (2004) Ten species in one: DNA
barcoding reveals cryptic species in the neotropical skipper butterl y Astraptes fulgerater. Proceed-ings of the National Academy of Sciences of the United States of America 101: 14812-14817. Hebets EA, Vink CJ (2007) Experience leads to preference: Experienced females prefer
brush-legged males in a population of syntopic wolf spiders. Behavioral Ecology 18: 1010-1020. Hedin MC (1997) Speciational history in a diverse clade of habitat-specialized spiders (Araneae:
Nesticidae: Nesticus): inferences from geographic-based sampling. Evolution 51: 1929-1945. Hedin MC (2001) Molecular insights into species phylogeny, biogeography, and morphologi-cal stasis in the ancient spider genus Hypochilus (Araneae, Hypochilidae). Molecular Phy-logenetics and Evolution 18 (2): 238-251.
Ivanova NV, deWaard JR, Hebert PDN (2006) An inexpensive, automation-friendly protocol for recovering high-quality DNA. Molecular Ecology Notes 6: 998-1002.
Ivanova NV, Grainger CM (2007) CCDB Protocols, COI Amplii cation. Retrieved from http:// www.dnabarcoding.ca/CCDB_DOCS/CCDB_Amplii cation.pdf on May19, 2009. Johannesen J, Lubin Y, Smith DR, Bilde T, Sneider JM (2007) h e age and evolution of
social-ity in Stegodyphus spiders: a molecular phylogenetic perspective.Proceedings of the Royal Society B: Biological Sciences 274: 231-237. doi: 10.1098/rspb.2006.3699.
Kerr KCR, Lijtmaer DA, Barreira AS, Hebert PDN, Tubaro PL (2009) Probing evolutionary patterns in neotropical birds through DNA barcodes. PLoS ONE 4: e4379.
Kerr KCR, Stoeckle MY, Dove CJ, Weigt LA, Francis CM, Hebert PDN (2007) Comprehensive DNA barcode coverage of North American birds. Molecular Ecology Notes 7: 535-543. Kimura M (1980) A simple method for estimating evolutionary rate of base substitutions through
comparative studies of nucleotide sequences. Journal of Molecular Evolution 16:111-120. Kress WJ, Wurdack KJ, Zimmer EA, Weigt LA, Janzen DH (2005) Use of DNA barcodes to
identify l owering plants. Proceedings of the National Academy of Sciences of the United States of America 102: 8369-8374.
Kuntner M, Agnarsson I (2006) Are the Linnean and Phylogenetic Nomenclatural Systems Com-binable? Recommendations for Biological Nomenclature. Systematic Biology 55 (5): 774-784. Locket GH, Millidge AF (1951) British spiders. Ray Society, London 1: 1-310.
Prospects for using DNA barcoding to identify spiders in species-rich genera 45
Oxford GS (2009) An exuberant, undescribed colour polymorphism in h eridion californicum
(Araneae, h eridiidae): implications for a theridiid pattern ground plan and the convergent evolution of visible morphs. Biological Journal of the Linnean Society 96: 23-34.
Paquin P, Hedin M (2004) h e power and perils of ‘molecular taxonomy’: a case study of eye-less and endangered Cicurina (Araneae: Dictynidae) from Texas caves. Molecular Ecology 13: 3239-3255.
Platnick NI (2009) h e world spider catalog, version 10.0. American Museum of Natural His-tory, online at http://research.amnh.org/entomology/spiders/catalog/index.html
Prendini L (2005) Comment on “Identifying spiders through DNA barcodes”. Canadian Jour-nal of Zoology 83: 498-504.
Ratnasingham S, Hebert PDN (2007) BOLD: h e Barcode of Life Data System (www.barcod-inglife.org). Molecular Ecology Notes. doi: 10.1111/j.1471-8286.2006.01678.x.
Saitou N, Nei M (1987) h e neighbor-joining method: a new method for reconstructing phy-logenetic trees. Molecular Biology and Evolution 4: 406-425.
Stockman AK, Bond JE (2007) Delimiting cohesion species: extreme population structur-ing and the role of ecological interchangeability.Molecular Ecology 16: 3374-3392. doi: 10.1111/j.1365-294X.2007.03389.x.
Appendix A.
List of the species, COI sequences, and source references used in the analysis. File format: Microsoft Excel (1997-2003). doi: 10.3897/zookeys.16.239.app.A.ds.
Copyright notice: h is dataset is made available under the Open Database License
(http://opendatacommons.org/licenses/odbl/1.0/). h e Open Database License (ODbL)
is a license agreement intended to allow users to freely share, modify, and use this Dataset while maintaining this same freedom for others, provided that the original source and author(s) are credited.
Citation: Robinson EA, Blagoev GA, Hebert PDN, Adamowicz SJ (2009) Appendix A. List of the species, COI sequences, and source references used in the analysis. DATASET. File format: Microsoft Excel (1997-2003). doi: 10.3897/zookeys.16.239.app.A.ds. ZooKeys 16: 27-46. doi: 10.3897/zookeys.16.239
Appendix B.
List of analyzed species, mean and maximum intraspecii c divergences, distances to the nearest neighbouring species in its genus, general localities, and lifestyle characteristics. File format: Microsoft Excel (1997-2003). doi: 10.3897/zookeys.16.239.app.B.ds.
Note: For general localities see Legend for locality abbreviations.
Copyright notice: h is dataset is made available under the Open Database License
(http://opendatacommons.org/licenses/odbl/1.0/). h e Open Database License (ODbL)
is a license agreement intended to allow users to freely share, modify, and use this Dataset while maintaining this same freedom for others, provided that the original source and author(s) are credited.