13
© 2016 GEUS. Geological Survey of Denmark and Greenland Bulletin 35, 13–16. Open access: www.geus.dk/publications/bull
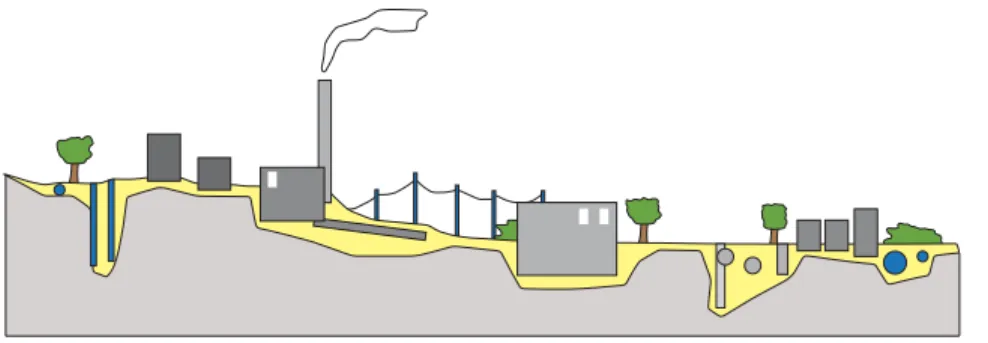
The subsurface material in urban areas comprises the original geological succession together with anthropogenic modifications and deposits. The Geological Survey of Den-mark previously performed geological mapping in selected Danish cities (e.g. Mertz 1974), but this practice stopped in the mid-1980s. The lack of recent systematic mapping in urban areas is apparent not only in Denmark but also in most other European countries (COST 2015). However, there is a growing demand for knowledge of the subsur-face beneath our cities for a number of reasons: increased urbanisation, infiltration of excess surface water and other climate-change related measures, thermal storage, ground-water cooling and abstraction, subsurface infrastructure, infrastructure projects, etc. The physical properties of the subsurface material are in constant change due to urban growth and infrastructure development. This can strongly influence the geotechnical properties and handling of ex-cess surface water. In order to manage both challenges and opportunities of the ground beneath the cities there is a growing need for 3D hydrogeological models that can en-compass all relevant parts of the physical subsurface system and act as operational tools in its management.
With the main focus on hydrogeology and the urban water cycle, the Municipality of Odense, the local water-works (VandCenter Syd), the Geological Survey of Den-mark and Greenland (GEUS) and two consultants (Alec-tia and I-GIS) have made a joint effort to systematically map the subsurface layers and build a 3D hydrogeological model of the subsurface of the city of Odense (Fig. 1). This paper provides an overview of the project rationale and an outline of the major results.
The sedimentary succession beneath
Odense
The uppermost 50 to 100 m of the subsurface of Odense is dominated by Weichselian clay till with intervening sand layers (e.g. Jørgensen & Piotrowski 2003, Mertz 1974), which form three groundwater reservoirs of varying extent and thickness. There are also late- to postglacial, near-surface, sandy outwash plains and heterogeneous infill of
erosive channels and depressions (Sandersen et al. 2015).
Historical maps from the late 1800s show that postglacial bogs and wetland areas have also earlier been present. The urban development of Odense has mainly taken place within the past 200 years (Fig. 1). The switch to the industrial era increased its population and led to expand-ing residential and paved areas, installation of water sup-ply and sewage systems, creation of waste dumps and an accelerated abstraction of groundwater. The drainage and lowering of the groundwater table dried out some of the former wetlands and created new agricultural and urban-ised land, and in other areas caused subsidence due to the decay of organic matter. Since the 1980s, a growing envi-ronmental awareness and increased taxes have resulted in a marked decrease in groundwater abstraction, and former
3D hydrogeological modelling for urban subsurface
management in Odense, Denmark
Susie Mielby, Tom Martlev Pallesen and Peter B.E. Sandersen
1717 1839 1892 1928 1977
Urban plan 2009–2021
Odense municipality
Odense
Ode
nse Fjo
rd
5 km
14 14
wetland areas are beginning to return to their original wet state. The urban activities within the last 200 years created a heterogeneous man-made layer consisting of backfill of excavations, modified terrain, landfill, waste dumps, etc. Parts of this anthropogenic layer rest on top of the original geological formations, whereas other parts replace them.
Building the 3D model
The man-made modifications of the urban subsurface, along with the ongoing climate change, affect the urban water cycle and must therefore be carefully evaluated. For instance, in areas with sustainable urban drainage systems (SUDS), the local infiltration potential and its consequenc-es on the hydraulic heads in adjacent areas must be known
(Jeppesen 2014; Mielby et al. 2015a), and this implies a
need for a close integration of regional and local geological information.
In order to build a comprehensive subsurface model for Odense both the natural and man-made layers were mapped, but due to their different nature, different map-ping and modelling approaches were needed. A standard framework-model approach where layer boundaries were mapped all the way to the surface was employed for the original geology, primarily using borehole data, geophysi-cal data and high-resolution digital elevation models
(San-dersen et al. 2015). The man-made layers shown in Fig. 2
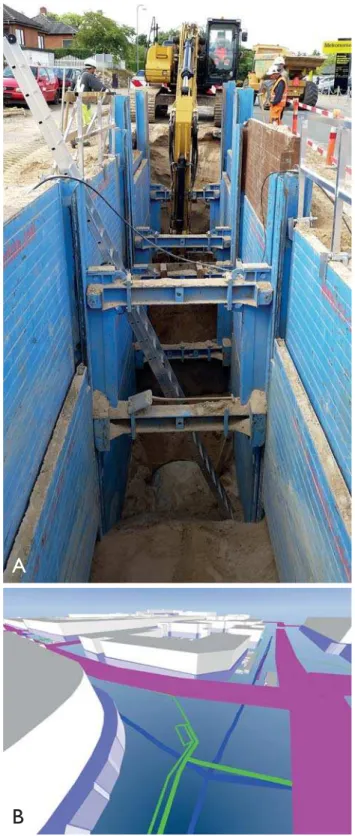
were mapped using data from boreholes about the thick-ness and character of infill, and from excavations around subsurface infrastructures. The latter requires detailed in-formation about the age, character and spatial extent of the individual parts of the infrastructure and access to current standards for excavation back-fill (Fig. 3; Pallesen & Jensen 2015).
The digital information about the anthropogenic layer is generally abundant, but also rapidly changing compared with the traditional geological data. Because the elements of the anthropogenic layers change over time, a tool for the modelling of the anthropogenic layers was established in
the modelling software GeoScene3D to make a sequential handling of the infrastructure data possible (Pallesen & Jensen 2015).
The need for a high degree of detail is most relevant in the uppermost parts of the 3D model, where the scale of the urban infrastructure typically is counted in metres or tens of metres. Mapping of the man-made layers should therefore be done with a corresponding level of detail. In the deeper parts of the subsurface, the number of bore-holes that reach depths of 20 m or more is very limited
(Kristensen et al. 2015), meaning that the deeper geological
succession typically cannot be resolved better than 100 m horizontally (Sandersen et al. 2015).
After mapping of the original geological layers and the man-made components the two parts are merged, whereby the latter component replaces the model part of the original geological layers (Fig. 4). In this way, two models are com-bined into one 3D model. However, due to the above-men-tioned scale difference, it is important to choose a common resolution that meets the required need for detail but does not exceed computational capability.
The major part of the geological information in the ur-ban area comes from relatively short boreholes drilled in connection with geotechnical and environmental projects. The geotechnical borehole information is very important, as it provides information about both the original geol-ogy and the composition of the man-made fill. Data from many of these boreholes are stored in the national Jupiter database, but its quality is variable because upload of this type of borehole data is not mandatory. In addition, many boreholes have not found their way to the national database at all, because the data were collected by private compa-nies, considering the information their private property. Therefore, the readily available digital geological informa-tion does not necessarily reflect all of the existing data, and this problem must be addressed before a 3D model is constructed.
15
Results
The project resulted in a 3D geological municipality model, and detailed anthropogenic and combined hydrogeological models were made for a chosen site in order to test the mod-elling in a typical situation. In addition to the models and the model tool in GeoScene3D, descriptions, workflows and recommendations for data acquisition, management and updating procedures were also developed.
In the project, a systematic and comprehensive colla-tion of available data was established within the borders of Odense Municipality. In 2015, the geological model con-cept provided the ‘best so far‘ foundation for the manage-ment of the urban hydrogeology in Odense. The resulting model and its tools were proven to be valuable, as they were quickly taken into use in several new hydrological mod-elling projects such as modmod-elling of hydrological climate-change effects and detailed infiltration possibilities, as well as the evaluation of the natural protection of drinking-water well fields.
The data and information density proved variable, and therefore information on the data background is impor-tant for the municipal decision-making. Detailed studies in Odense showed that in many areas the data coverage is insufficient for the purpose required. Therefore, the geo-logical basis for planning and water management has to be improved, and this requires a dynamic model that can benefit from both existing and new data.
If all additional geological data are to be accessible for future planning, the authorities must ensure that all geo-logical and geotechnical data are reported and available. The investigations in the current project proved that open access to better geotechnical and geological data and mod-elling would also benefit a wider range of users such as archaeologists, engineers, architects, entrepreneurs and other professionals working with e.g. road and railway con-struction (Laursen et al. 2015). If the 3D model is regularly updated in the future, Odense will also obtain an increas-ingly robust foundation for the hydrological modelling and management of the urban water cycle. Detailed
recommen-dations and experience from the current project (Mielby et
al. 2015b), urban data modelling tools in GeoScene3D and
data storage facilities for geotechnical information in the
Jupiter database (Hansen et al. 2015) are available for the
benefit of other areas.
A
B
16 16
Acknowledgements
The Foundation for Development of Technology in the Danish Water Sector (VTU- Fonden; ans-7497.2012) is thanked for financial support. The project partners Knud Søndergaard and Gert Laursen, Odense Mu-nicipality, Christian Ammitsøe and Johan Linderberg, VCS Denmark, Martin Hansen and Margrethe Kristensen, GEUS and Jan Jeppesen, Alectia are acknowledged for fruitful collaboration.
References
COST 2015: http://www.cost.eu/COST_Actions/tud/Actions/TU1206. Sub-Urban – A European network to improve understanding and use of the ground beneath our cities.
Hansen, M., Wiese, M.B., Gausby, M. & Mielby, S. 2015: Udvikling af en 3D geologisk/hydrogeologisk model som basis for det urbane vand-kredsløb. Delrapport 6 – Teknisk håndtering og lagring af bygeolo-giske data og modeller, 22 pp. København: De Nationale Geolobygeolo-giske Undersøgelser for Danmark og Grønland.
Jeppesen, J. 2014: Udvikling af en urban-hydrologisk model til simule-ring af nye innovative LAR-løsninger til lokal håndtesimule-ring af både regn-vand og grundvand (LARG). Afrapportering af VTU-projekt 29. December 2014.
Jørgensen, F. & Piotrowski, J.A. 2003: Signature of the Baltic Ice Stream on Funen Island, Denmark during the Weichselian glaciation. Boreas
32, 242–255.
Kristensen, M., Sandersen, P. & Mielby, S. 2015: Udvikling af en 3D ge-ologisk/hydrogeologisk model som basis for det urbane vandkredsløb. Delrapport 2 – Indsamling og vurdering af data, 82 pp. København: De Nationale Geologiske Undersøgelser for Danmark og Grønland. Laursen, G. & Mielby, S. 2016: Odense. TU1206 COST Sub-Urban
WG1 Report.
Laursen, G., Mielby, S. & Kristensen, M. 2015: Udvikling af en 3D ge-ologisk/hydrogeologisk model som basis for det urbane vandkredsløb. Delrapport 3 – Geotekniske data til planlægning og administration, 32 pp. København: De Nationale Geologiske Undersøgelser for Dan-mark og Grønland.
Mertz, E.L. 1974: Odense og omegns jordbundsforhold: En ingeniør-geologisk beskrivelse. Danmarks Geologiske Undersøgelse Rapport
9, 37 pp.
Mielby, S., Laursen, G., Linderberg, J., Sandersen, P. & Jeppesen, J. 2015a: Udvikling af en 3D geologisk/hydrogeologisk model som basis for det urbane vandkredsløb. Delrapport 1 – 3D-modellen som basis for håndteringen af det urbane vandkredsløb, 66 pp. København: De Nationale Geologiske Undersøgelser for Danmark og Grønland. Mielby, S., Jespersen, C.E., Ammitsøe, C., Laursen, G., Jeppesen, J.,
Linderberg, J., Søndergaard, K., Kristensen, K., Hansen, M., Jensen, N.-P. & Sandersen, P. 2015b: Udvikling af en 3D geologisk/hydro-geologisk model som basis for det urbane vandkredsløb. Synteserap-port, 57 pp. København: De Nationale Geologiske Undersøgelser for Danmark og Grønland.
Pallesen, T.M. & Jensen, N.-P. 2015: Udvikling af en 3D geologisk/ hydrogeologisk model som basis for det urbane vandkredsløb. Del-rapport 5 – Interaktiv modellering af antropogene lag, 58 pp. Køben-havn: De Nationale Geologiske Undersøgelser for Danmark og Grøn-land.
Sandersen, P., Kristensen, M. & Mielby, S. 2015: Udvikling af en 3D geologisk/hydrogeologisk model som basis for det urbane vandkreds-løb. Delrapport 4 – 3D geologisk/hydrostratigrafisk modellering i Odense, 106 pp. København: De Nationale Geologiske Undersøgelser for Danmark og Grønland.
A
B
C
Fig. 4. Elements of the geological modelling. A:Buildings and pipes. B:Man-made ground with fill. C: Combined model showing man-made features and the underlying geological model.
Authors’ addresses