Brazilian Journal of Microbiology (2012): 177-186 ISSN 1517-8382
OPTIMIZATION OF NUTRITION FACTORS ON CHITINASE PRODUCTION FROM A NEWLY ISOLATED
Chitiolyticbacter meiyuanensis SYBC-H1
Zhikui Hao1,2; Yujie Cai1; Xiangru Liao1*; Xiaoli Zhang3; Zhiyou Fang4; Dabing Zhang5
1
The Key Laboratory of Industrial Biotechnology, Ministry of Education, School of Biotechnology, Jiangnan University, Wuxi 214122, People’s Republic of China; 2Fishery Extension Station of Yingzhou District, 28 Yingzhou Road, Fuyang 236000, Anhui
Province, People’s Republic of China; 3School of Textile Engineering and Art, Anhui Agricultural University, Hefei 230036; 4
Department of Cell Biology and Cell Dynamics Program, University of Massachusetts Medical School, Worcester, MA 01605, USA; 5Jiangsu Hanbon Science & Technology Co. Ltd, Huai’an, Jiangsu 223001, People’s Republic of China.
Submitted: November 20, 2010; Approved: August 30, 2011.
ABSTRACT
The present study reports statistical medial optimization for chitinase production by a novel bacterial strain isolated from soil recently, which the name Chitinolyticbacter meiyuanensis SYBC-H1 is proposed. A sequential statistical methodology comprising of Plackett-Burman and response surface methodology (RSM) was applied to enhance the fermentative production of chitinase, in which inulin was firstly used as an effective carbon source. As a result, maximum chitinase activity of 5.17 U/mL was obtained in the optimized medium, which was 15.5-fold higher than that in the basal medium. The triplicate verification experiments were performed under the optimized nutrients levels which indicated that it well agreed with the predicted value.
Key words: chitinase, medium optimization, response surface method, inulin, Chitinolyticbacter meiyuanensis SYBC-H1
INTRODUCTION
Chitin is the second most abundant insoluble biodegradable polymer, which exists naturally in the biosphere as a structural polysaccharide of -1,4-N-acetyl-D-glucosamine (16). It is highly distributed in nature, as a constituent of insect exoskeleton, shells of crustaceans, fungal cell walls (11), and algae components (5). More than 1×10¹¹ tons of chitin are estimated to be produced annually in marine waters alone,
mostly by copepods (24). Most of chitin for commercial are come from shrimp shellfish waste.
Chitinase (E.C.3.2.1.14) are enzymes capable of hydrolyzing chitin to its oligo and monomeric components. Microorganisms (5), higher plants (17), even lower animals and birds (3) are known to produce chitinase. Microorganisms are well investigated, Serratia marcescens is the most common and well known microorganism for chitinase production (4).
Recently, chitinase are gaining much attention worldwide
*Corresponding Author. Mailing address: The Key Laboratory of Industrial Biotechnology, Ministry of Education, School of Biotechnology, Jiangnan
(7, 8, 12, 26), because of their wide range of biotechnological applications in such as generation of fungal protoplasts (12), shellfish waste management, production of single cell protein (34), and specially in the production of chitooligosaccharides (immune enhancers), N-acetyl-glucosamine, or chitooligosaccharides for various applications (34), and in biocontrol of fungal plant pathogens (6).
In order to industrially convert the complex chitin to simple or proper compounds, much work has been done to improve the production of chitinase by a cheap and energy-saving process using genetically modified organisms (18)
and/or multistage fermentation system. An enhancing effect of glucose on chitinase production was reported by Bhushan when glucose was used with chitin as carbon source (2). However, a suppressing effect of glucose on chitinase production was reported by Miyashita et al. (23). Therefore, the current challenge is to further enhance the enzyme activity via strain selection and culture conditions optimization.
In the conventional method, the medium is optimized by changing one factor at a time while keeping others at a constant level (26, 33), which is laborious and often leads to wrong conclusions (20). Multivariate experiments are designed not only to reduce the number of necessary experiments in the optimization process, but also to produce more defined results than those available by univariate strategies (27). Plackett– Burman (P-B) and response-surface methodology (RSM) are multivariate analyzing tools comprising of mathematical and statistical techniques for generating empirical models that obtained importance for optimizing production conditions of industrially high value products such as chemicals, enzymes, and for studying enzyme kinetics. The statistical tool has been used in many biotechnological processes namely optimization of culture conditions (19), enzyme production (32), ethanol production (10), and biomass production (36). It was also useful for optimizing the yield of recombinant products such as actinorhodin (9), nisin (21), lysozyme (14), alkaline protease (1), and hirudin (28) as well as extracellular polysaccharides
and biomass (13). However, there have been few studies on chitinase production using (P-B) and RSM (31).
A novel bacterial strain was isolated from soil recently, which named Chitinolyticbacter meiyuanensis SYBC-H1. In this paper, the effect of the addition of inulin to the liquid culture of the strain was investigated, and RSM, an efficient experimental strategy, was applied in optimizing the medial composition to improve the production of chitinase.
MATERIALS AND METHODS
Microorganism
The chitinase-producing bacterium was isolated in our laboratory from the soil samples collected from Meiyuan Park (33°56´N,120°18´E), Wuxi city, China. The physiological and biochemical tests of the isolated chitinase-producing strain were done as described in Bergey’s manual of systematic bacteriology (15). The strain was further identified according to 16S rRNA studies. The obtained sequence was searched against the GenBank database and homology studies were undertaken to identify the isolate. Initially sequence was analyzed at National Center for Biotechnology Information (NCBI) server (http://www.ncbi.nlm.nih.gov). Nearly complete 16S rRNA gene sequence of the isolate, consisting of 1,526 nucleotides, was determined and deposited in the DDBJ/ GenBank/ EMBL database under the accession number of GQ981314. Homology search indicated that the strain SYB-H1 had sequence identity of 95.0% to SAY3T (AB 453176) as closest relative (30). On the basis of physiological, biochemical and 16S rRNA gene sequence study, the isolate was identified as gen. nov., sp. nov. (22) and named Chitinolyticbacter meiyuanensis SYBC-H1, which was deposited into the China General Microbiological Culture Collection Center (CGMCC3438) and American Type Culture Collection (ATCC BAA-2140). The strain was first studied on fermentation.
Preparation of seed culture
Hao, Z. et al. Chitanase production from C. meiyuanensis
4 oC. The seed culture was prepared by inoculating single colony in a plate containing the medium composed of (g/L) 2.0
glucose, 4.0 peptone 0.7 KH2PO4, 0.5 MgSO4·7H2O, 0.3
K2HPO4, 0.02 FeSO4·7H2O, and 20.0 agar. In order to have stable strains, the cells were transferred into a fresh medium for several times. After incubated for 2 days at 30 oC, a loop full of the colony from the flat plate is transferred to 50 mL seed medium composed of (g/L) 2.0 glucose, 4.0 peptone, 0.7 KH2PO4, 0.5 MgSO4·7H2O, 0.3 K2HPO4 and 0.02 FeSO4·7H2O in 250 mL shake flasks and incubated at 30 °C for 12 hour on a rotary shaker (200 rpm). The cells growth was monitored by absorbance measurement at 600 nm with a UV-visible spectrophotometer. For shake flask culture, the liquid medium was sterilized in the autoclave at 121°C for 20 min, and pH was adjusted to 7.0 before autoclaving.
Culture conditions
Chitinase production was carried out by shake-flask culture. Medium were determined according to the result of the Plackett-Burman factorial and the Response Surface Method design. The pH was adjusted to 6.5 before autoclaving at 121 oC
for 20 min. Subsequently inoculated with 4 % (w/w) seed and
incubated at 30 oC for 72 h under shaking at 200 rpm. The broth was centrifuged at 10,000×g for 10 min at 4 oC, and the supernatant was used for chitinase assay.
Effect of incubation period on the chitinase production
Flasks containing 50 ml of production medium were inoculated with 4.0% seed culture and incubated at 30 oC with constant shaking at 200 rpm. Following incubation for 12 h intervals, fermentation broth was centrifuged and chitinase activity was determined.
Assay of chitinase activity
The chitinase activity was measured by reduction of 3,5-dinitrosalicylic acid, in the presence of the aminosugar N-acetyl-D-glucosamine (NAG) released by enzymatic hydrolysis
of colloid chitin according to the method described by Rojas-Avelizapa et al. (29). The absorbance was recorded at 530 nm. Readings were compared with a standard curve prepared with a series of dilutions of NAG (0–5.0 mmol/mL) and 3, 5-dinitrosalicylic acids. The chitinase activity was assayed in triplicate and the average enzyme activity with standard deviations was measured using software of SPSS 11.5. One unit chitinase activity (U) was defined as the amount of enzyme required for producing 1 mmol of NAG at 37 oC in 1 minute.
Screening of critical media components using a Plackett–
Burman design
The Plackett-Burman factorial design was used to select significant medium components affecting the production of chitinase. Previous studies showed that peptone, urea, corn steep liquor powder, ammonium sulfate, glucose, inulin, starch, sodium sulfate, fructose, and Magnesium sulfate were effective medial components for process modeling. A total of fourteen process variables comprising of ten medial components (peptone, urea, corn steep liquor powder, ammonium sulfate, glucose, inulin, starch, sodium sulfate, fructose, and Magnesium sulfate) and one dummy variable were studied in Plackett–Burman screening experiments. Each variable was represented at 3 levels, upper (‘high, +’), intermediate (‘center point, 0’) and lower (‘low, -’) levels of the range covered by each variable and the response (Tables 1 and 2). Experimental responses were analyzed by first order model by the following equation Y= o+ i xi where Y is the response for chitinase
production, o is the model intercept and i is the linear
coefficient, and xi is the level of the independent variable.
production were further optimized by RSM.
Optimization of medium with the Response Surface
Method
Inulin, urea, and sodium sulfate were identified as the key factors that influenced chitinase production from the above experiments (Table 3), and their suitable concentration ranges were also preliminarily determined. Consequently, RSM was employed to optimize the four most significant factors, namely inulin, urea, sodium sulfate, and chitin powder (particle size < 100 mesh), which had been screened by fractional factorial design for chitinase production enhancement based on central composite design. The four independent factors were studied at five different levels (−1.41, −1, 0, +1, and +1.41) as shown in Table 4. The factors were coded according to Eq. 1:
xi =(Xi-X0)/ Xi, i = 1, 2,.., k (1)
Where Xi and xi are the actual value and codified value,
respectively. X0 is the value of Xi at center point, and
✁
Xi is
the step change value. The second-order model used to fit the response to the independent variables is shown in Eq. 2:
Y = 0+ ixi+ ix2i+ ijxixj, i = 1, 2, ..., k (2)
Where Y is the predicted response, xi and xj are the coded
independent factors that influence the response variable Y, o is
the intercept, i represents the linear effect of xi, ij represents
the interaction between xi and xj, and ij represents the quadratic
effect of xi. Design Expert version 7.1.5 statistical software
(Stat-Ease, Minneapolis, MN) was used for the experimental design and regression analysis of the experimental data. Statistical analysis of the model was performed to evaluate the analysis of variance (ANOVA). The quality of the polynomial model equation was judged statistically by the coefficient of determination R2, and its statistical significance was determined by an F test. The significance of the regression coefficients was tested by t test.
RESULTS
Screening of significant factors by Plackett–Burman design
In the Plackett–Burman model, 14 experiments were required tests to screen the importance of eleven medium components derived from single-factor optimization (Tables 1 and 2). The values of Prob > F less than 0.05 implied that model terms were significant. From the experimental data, all of these variables could distinctly affect the production of chitinase (Table 3). Among them, Corn steep liquor powder, glucose, starch, and magnesium sulfate exerted negative effect, whereas the other six variables exerted positive effects on the production of chitinase. The optimum variables (urea, inulin, and sodium sulfate) were further evaluated by a response surface methodology (RSM) design.
Table 1. Variables representing medium components used in Plackett-Burman design
Variables
Medium component
✂✂✂✂
values (g/L)
0 values (g/L)
✄✄✄✄
values (g/L)
X1 Peptone 5.00(+) 3.00 1.00(-)
X2 Urea 1.30(+) 0.78 0.26(-)
X3 Corn steep powder 1.33(+) 0.80 0.27(-)
X4 Ammonium sulfate 2.86(+) 1.72 0.57(-)
X5 Glucose 2.00(+) 1.20 0.40(-)
X6 Inulin 1.16(+) 0.70 0.23(+)
X7 Starch 1.95(+) 1.17 0.39(-)
X8 Magnesium sulfate 0.492(+) 0.30 0.098(-)
X9 Fructose 2.00(+) 1.20 0.40(-)
X10 Sodium sulfate 0.284(+) 0.17 0.057(-)
X1–X10 represent different assigned variables (Peptone, Urea, Corn steep liquor powder, Ammonium sulfate, Glucose, Inulin,
Starch, Magnesium sulfate, Fructose, Sodium sulfate); the sign ‘+’ is for high concentration of variables, ‘0’ is for intermediate
Hao, Z. et al. Chitanase production from C. meiyuanensis
Table 2. Plackett–Burman experimental design matrix with the observed response (Chitinase activity). The values showed in the table
were averaged from two independent triplicate experiments with means less than 5 %.
X1–X10 represent different assigned variables(Peptone, Urea, Corn steep liquor powder, Ammonium sulfate, Glucose, Inulin,
Starch, Magnesium sulfate, Fructose, Sodium sulfate), and D are the unassigned⁄dummy variable; the sign ‘+’ is for high
concentration of variables, the sign ‘0’ is for middle concentration of variablesand ‘☎ ’ is for low concentration of variables.
Table 3. Statistical analysis of medium components for chitinase production by Plackett–Burman design.
X1–X10 represent different assigned variables(Peptone, Urea, Corn steep liquor powder, Ammonium sulfate, Glucose, Inulin, Starch,
Magnesium sulfate, Fructose, Sodium sulfate)
Std. Dev. = 0.021; R-Squared = 0.999; Mean = 0.91; Adj R-Squared = 0.9941; C.V. % = 2.30; Pred R-Squared = 0.9843; PRESS = 0.014; Adeq Precision = 46.992
Optimization using RSM
To search for the optimum combination of these components in the culture medium, a CCD experimental plan was carried out. Their suitable concentrations ranges were preliminarily determined. Table 4 shows various combinations used and the corresponding chitinase yield. Data were analyzed by linear multiple regression using the Design-Expert (Version 7.0; Stat-Ease, Inc.) and the following equation was obtained.
Y=4.68+0.34X1+0.25X2+0.52X3+0.16X4+0.041X1X2+0.025X1X3-0.19X1X4
-0.11X2X3+0.19 X2X4+0.39X3X4-0.95X12-0.32 X22-0.53 X32-0.16 X42 (3)
Where X1, X2, X3 and X4 are the symbols of concentration of inulin, urea, chitin and sodium sulfate, respectively. The experimental results revealed that this mathematical tool could satisfactorily explain the effects of the variables concentration (inulin, urea, chitin, and Sodium Sulfate) in chitinase production of Chitinolyticbacter meiyuanensis SYBC-H1 in shake-flask cultures. Analysis of variance (ANOVA) for the Quadratic model were shown in Table 5. Value of ‘‘Model
Variables
Run X1 X2 X3 X4 X5 X6 X7 X8 X9 X10 D
Chitinase (U/ml)
1 ✆✞✝ 1 1 1 ✆✞✝ ✆✞✝ ✆✞✝ 1 ✆✞✝ 1 1 0.79
2 ✆✞✝ ✆✞✝ 1 ✆✞✝ 1 1 ✆✞✝ 1 1 1 ✆✞✝ 0.88
3 1 ✆✞✝ 1 1 ✆✞✝ 1 1 1 ✆✞✝ ✆✞✝ ✆✞✝ 0.70
4 0 0 0 0 0 0 0 0 0 0 0 0.93
5 1 1 ✆✞✝ ✆✞✝ ✆✞✝ 1 ✆✞✝ 1 1 ✆✞✝ 1 1.26
6 ✆✞✝ ✆✞✝ ✆✞✝ ✆✞✝ ✆✞✝ ✆✞✝ ✆✞✝ ✆✞✝ ✆✞✝ ✆✞✝ ✆✞✝ 0.75
7 1 ✆✞✝ ✆✞✝ ✆✞✝ 1 ✆✞✝ 1 1 ✆✞✝ 1 1 0.41
8 1 1 ✆✞✝ 1 1 1 ✆✞✝ ✆✞✝ ✆✞✝ 1 ✆✞✝ 1.27
9 ✆✞✝ ✆✞✝ ✆✞✝ 1 ✆✞✝ 1 1 ✆✞✝ 1 1 1 1.32
10 ✆✞✝ 1 1 ✆✞✝ 1 1 1 ✆✞✝ ✆✞✝ ✆✞✝ 1 0.72
11 0 0 0 0 0 0 0 0 0 0 0 0.89
12 ✆✞✝ 1 ✆✞✝ 1 1 ✆✞✝ 1 1 1 ✆✞✝ ✆✞✝ 0.84
13 1 1 1 ✆✞✝ ✆✞✝ ✆✞✝ 1 ✆✞✝ 1 1 ✆✞✝ 1.11
14 1 ✆✞✝ 1 1 1 ✆✞✝ ✆✞✝ ✆✞✝ 1 ✆✞✝ 1 0.98
Source Medium
component
Sum of squares
Coefficient estimate
Mean square
Stdized
Effects F-value
P-value Prob✟✟✟✟ F
Model 0.89 0.91 0.089 204.12 0.0049
X1 Peptone 0.009 0.028 0.009 0.055 20.74 0.0450
X2 Urea 0.092 0.088 0.092 0.18 210.00 0.0047
X3 Corn steep liquor powder 0.049 -0.064 0.049 -0.13 112.93 0.0087
X4 Ammonium sulfate 0.037 0.056 0.037 0.11 85.5 0.0115
X5 Glucose 0.044 -0.061 0.044 -0.12 101.50 0.0097
X6 Inulin 0.11 0.098 0.11 0.20 260.74 0.0038
X7 Starch 0.072 -0.078 0.072 -0.16 164.74 0.0060
X8 sodium sulfate 0.16 -0.11 0.16 -0.23 357.50 0.0028
X9 Fructose 0.29 0.15 0.29 0.31 651.90 0.0015
182
Prob>F’’ less than 0.0060 implied that the model was highsignificant. In this case X1, X3, X12 and X32 are significant model terms. The ‘‘Lack of Fit Prob>F value’’ of 0.335 showed that the lack of fit is insignificant. The R2 coefficient obtained, of 0.8422, suggests that it is a reliable model and that 84.22% of the sample variation of chitinase yield is attributed to a high correlation between the independent variables. Only 15.78% of the total variation of chitinase production was not explained by the model. The relatively high-adjusted determination coefficient (R2Adj=0.6582) accounts for significance of the model. The coefficient of variation (CV) indicated the degree of precision with which the calculations were compared. Usually, a high CV value represents low reliability of the experiment. The low value obtained (CV = 25.76%) showed a small residual variability data and the greater reliability of the experiments performed. The observed chitinase activity (the response) versus those factors from the empirical model equation 2 was shown in Figure 1, which indicated that the predicted data of the response from the empirical model was in agreement with the observed ones in the range of the operating variables. The graphical representation provides a method to visualize the relationship between the
response and experimental levels of each variable and the type of interactions between test variables to deduce the optimum conditions. In this design, the response surface curves for the four variables were shown in Figure 2. The response surface representing chitinase was a function of concentrations of the two medium components with another nutrient being at a zero level. The regression equation, maximized by the Design Expert 7.0 (Minneapolis, USA) software, allowed to obtain the following optimal coded units for test variables: X1 = 0.1, X2 = 0.55, X3 = 0.80 and X4 = 1.00, which corresponded to optimal concentrations of (g/L) 3.10 urea, 3.55 inulin, 3.80 chitin and 0.64 sodium sulfate, for the maximal chitinase activity of the 5.17 U/mL, predicted by the mathematical model with a high model accuracy. The P values are used for checking the significance of each coefficient which, in turn, it is necessary to understand the pattern of the mutual interactions between the important variables, and the small magnitude of P values means that the corresponding coefficients are more significant. A positive coefficient represents an effect that favors the optimization of chitinase yield, while a negative value indicates an antagonistic effect.
Table 4. Experimental design and results of the central composite design. The values showed in the table were averaged from two independent triplicate experiments with means less than 5 %.
Variables/levels
Inulin Urea Chitin sodium sulfate
Chitinase (U/ml) Trial Coded
value
Actual value (g/L)
Coded value
Actual value (g/L)
Coded value
Actual value (g/L)
Coded value
Actual value (mM)
Experimental
1 -1 2 -1 2 -1 2 -1 1 1.41
2 0 3 - 1.59 0 3 0 2 3.13
3 -1 2 1 4 -1 2 1 3 1.63
4 1 4 -1 2 1 4 -1 1 2.92
5 0 3 0 3 0 3 0 2 4.51
6 -1 2 -1 2 1 4 1 3 3.01
7 + 4.41 0 3 0 3 0 2 1.59
8 1 4 1 4 -1 2 1 3 3.73
9 1 4 -1 2 -1 2 1 3 0.83
10 -1 2 -1 2 1 4 -1 1 1.50
11 1 4 1 4 1 4 1 3 3.63
12 0 3 0 3 - 1.59 0 2 1.35
13 0 3 + 4.41 0 3 0 2 4.41
14 0 3 0 3 + 4.41 0 2 4.51
15 0 3 0 3 0 3 + 3.41 4.44
16 -1 2 1 4 1 4 -1 1 1.64
17 -1 2 1 4 -1 2 -1 1 2.18
18 -1 2 -1 2 -1 2 1 3 1.80
19 0 3 0 3 0 3 0 2 4.73
20 1 4 1 4 -1 2 -1 1 2.43
21 -1 2 1 4 1 4 1 3 3.70
22 - 1.59 0 3 0 3 0 2 0.91
23 1 4 1 4 1 4 -1 1 3.11
24 0 3 0 3 0 3 - 0.59 4.36
25 1 4 -1 2 1 4 1 3 3.82
Hao, Z. et al. Chitanase production from C. meiyuanensis
Table 5. Analysis of variance (ANOVA) for the Quadratic model
Source df
Coefficient Estimate
Sum squares
Mean
square F ratio
Prob. level
model 14 4.68 36.67 2.62 4.58 0.0060
X1-Inulin 1 0.34 2.80 2.80 4.89 0.0472
X2-Urea 1 0.25 1.54 1.54 2.70 0.1265
X3-Chitin 1 0.52 6.40 6.40 11.18 0.0059
X4-sodium sulfate 1 0.16 0.62 0.62 1.08 0.3191
X1×X2 1 0.041 0.026 0.026 0.046 0.8338
X1×X3 1 0.025 9.851 9.851 0.017 0.8978
X1×X4 1 -0.19 0.60 0.60 1.05 0.3251
X2×X3 1 -0.11 0.21 0.21 0.37 0.5547
X2×X4 1 0.19 0.55 0.55 0.96 0.3469
X3×X4 1 0.39 2.45 2.45 4.28 0.0607
X1 2
1 -0.95 19.25 19.25 33.62 0.0001
X2 2
1 -0.32 2.19 2.19 3.82 0.0742
X3 2
1 -0.53 6.01 6.01 10.05 0.0071
X4 2
1 -0.16 0.56 0.56 0.98 0.3427
Residual 12 6.87 0.57
Lack of fit 10 8.82 0.68 29.20 0.335
Total error 2 0.047 0.023
Corrected total 26 43.54
R-Squared =0.8422, Adj R-Squared =0.6582, C.V.=25.76%, Adeq Precision ratio=7.948
Figure 1. Plot of predicted vs actual chitinase activity (U/mL
values)(different color represents the corresponding chitinase activity
in the figure).
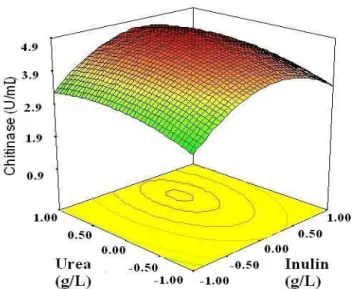
The regression equation was represented in 3-D response surface plots, and each contour curve corresponds to an infinite number of combinations between two test variables, while the third was maintained at their zero level. The chitinase for different concentrations of the variables could also be
predicated from the respective response surface plots (Figure 2). The maximum predicted yield was indicated by the surface confined in the response surface diagram.
Figure 2. 3D response surface curve for effects of Inulin, Urea and
their mutual interaction on chitinase production by SYBC-H1. Other
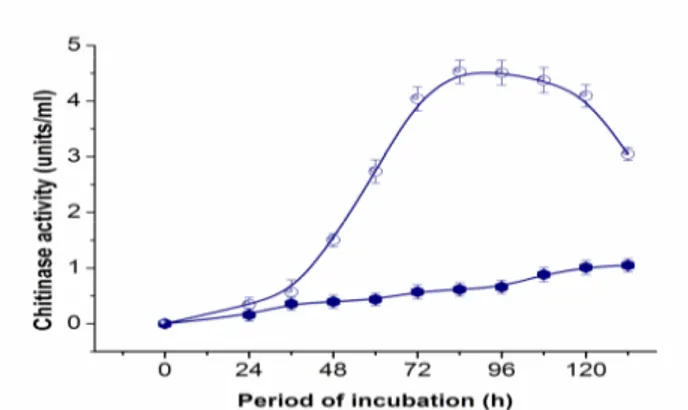
Fermentation time courses under optimized and non-optimized conditions were given in Figure 3. Both time courses showed disparity fermentation process trend. Initially, chitinase yield was very low, and after a lag phase of near 48 hours, chitinase yield gradually increased. After about 84 hours of incubation, chitinase reached the maximum yield. The time course showed that the optimized fermentation conditions change the chitinase producing process. After the enzyme activity reached maximum, the production of chitinase reduced rapidly, which was similar to the previous reports (26, 33). The reduction of chitinase might be caused by proteinase degradation or inactivation of the chitinase by unclear mechanisms. In many submerged fermentation processes, when the products reached the highest yield, further increase in incubation time could decrease the yield due to the degradation of metabolites.
Figure 3. The time-course of chitinase production by SYBC-H1 before and after the optimization ( : Original, : Optimum medium).
Table 6. Effect of medium composition on chitinase production
Factors Original Optimum medium
Urea (g/L) - 3.10
Inulin (g/L) - 3.55
Chitin (g/L) 1.00 3.80
Sodium sulfate (g/L) - 0.64
Glucose(g/L) 1.20 -
Yeast extract(g/L) 4.00 -
Mineral medium * *
Chitinase(U/ml) 0.49 ± 0.2 5.17 ± 0.4
*mineral medium(g/l): K2HPO4 0.7; KH2PO4; MgSO4.7H2O 0.5; FeSO4.7H2O 0.2
Optimization and Model Verification
From the study of plots, the maximum production of chitinase was obtained when the concentration (g/L) of 3.1 urea, 3.55 inulin, 3.8 chitin, 0.64 sodium sulfate, 0.7 KH2PO4, 0.5 MgSO4·7H2O, 0.02 FeSO4·7H2O, and 0.3 K2HPO4 (Table 6) were used for flask fermentation at 30 oC for 96 h. The maximum value of chitinase yield predicted from this model was 5.17 U/mL. To verify the predicted results, the triplicate verification experiments were performed under the optimized nutrients levels. The mean value of the chitinase activity was 5.16±0.15 U/mL, which was well agreed with the predicted value (5.17 U/mL). As a result, the models developed were considered to be accurate and reliable for predicting the production of chitinase by Chitinolyticbacter meiyuanensis SYBC-H1.
DISCUSSION
Hao, Z. et al. Chitanase production from C. meiyuanensis
series of experiments for important factors of interest, which is laborious and time consuming. Furthermore, such methods could not provide information for the interactions of the factors. Statistical methodology could locate the most important factors levels with minimum effort and time; moreover, it could reveal the interaction among the factor. In this study, a sequential statistical methodology comprising of Plackett-Burman and response surface methodology were applied to enhance the fermentative production of chitinase. A quadratic polynomial equation suggested by the RSM model was then validated experientially. The synthesis of extracellular enzymes such as chitinase depends on carbon and nitrogen. The composition of culture medium has been optimized before, in which glucose principally serves as carbon source (35). In the research, urea, inulin, chitin powder and sodium sulfate were found to be significant factors controlling chitinase yield. This is the first report suggesting a whole new carbon source to produce chitinase through employment of inulin as substrate. Inulin, a D-fructose polymer terminated by glucose residue, makes up 80% or so of the dry matter of Jerusalem artichoke tubers, and for many years it has been proposed to be a possible feedstock for ethanol production (25). As demonstrated in this paper, Inulin can also be used as an effective carbon source to chitinase yield with much lower cost in substrate.
The study using RSM based on CCD established an efficient model to describe the process. During the process of chitinase production, chitin acts as not only inducer, but also carbon source and nitrogen source. Furthermore, preliminary experiments indicated that chitinase production was significantly influenced by chitin. The high similarity between the observed value and the predicted ones showed that the RSM was an accurate and applicable tool to optimize culture medium for chitinase yield in Chitinolyticbacter meiyuanensis SYBC-H1 industry. By utilizing the statistical methodology, the optimum chitinase activity was determined to be 5.17 U/mL. Under optimized culture conditions, the chitinase activity was 15-fold than that under the original culture
conditions. In particular, the culture time was also decreased. Although chitinase activity slightly lower than Streptomyces (26), but it is low cost in substrate. To further increase the yield of chitinase, we will attempt to construct recombinant Chitinolyticbacter meiyuanensis SYBC-H1 using the molecular biotechnology. Further works will be continued in our studies.
ACKNOWLEDGEMENTS
This work was financially supported by the National High Technology and Development Program of China (863 Program, grant No. 2010AA101501), National Institutes of Health grant GM-33048, the scientific & technological personnel service project of the ministry of science and technology (Grant No. 2009GJ10038), the national natural science foundation of China (Grant No. 21045007), special funds of science & technology innovation of science and technology department of Jiangsu province (Grant No. BY2010117), and the Fundamental Research Funds for the Central Universities JUSRP21120.
REFERENCES
1. Adinarayana, K.; Ellaiah, P. (2002). Response surface optimization of the critical medium components for the production of alkaline protease by a newly isolated Bacillus sp. J. Pharm. Sci., 5, 272–278.
2. Bhushan, B.; Hoondal, G. S. (1998). Isolation, purification and properties of a thermostable chitinase from an alkalophilic Bacillus sp. BG-11. Biotechnol. Lett., 20, 157-159.
3. Boman, H. G. (1995). Peptide antibiotics and their role in innate immunity.Annu. Rev. lmmunol., 13, 61-92.
4. Cha, J. M.; Cheong, K. H.; Cha, W. S.; Choi, D. B.; Roh, S. H.; Kim, S. I. (2004). Optimal conditions for chitinase production by Serratia marcescens.Biotechnol. Bioprocess. Eng. 9, 297-302.
5. Chang, S. C.; Wang, J. T.; Vandamme, P.; Hwang, J. H.; Chang, P. S.; Chen, W. M. (2004). Chitinimonas taiwanensis gen. nov., sp. nov., a novel chitinolytic bacterium isolated from a freshwater pond for shrimp culture.Syst. appl. microbiol., 27, 43-49.
6. Chang, W. T.; Chen, Y. C.; Jao, C. L. (2007). Antifungal activity and enhancement of plant growth by Bacillus cereus grown on shellfish chitin wastes.Bioresource Technol., 98, 1224-1230.
of chitinolytic enzymes: a review.Appl. Microbiol. Biot., 71, 773-782. 8. Deshpande, M. V. (1986). Enzymatic degradation of chitin and
biological application.J. Sci. Ind. Res. India., 45,
9. Elibol, M. (2004). Optimization of medium composition for actinorhodin production by Streptomyces coelicolor A3(2) with response surface methodology.Process Biochem., 39, 1057–1062.
10. Ergun, M.; Ferda Mutlu, S. (2000). Application of a statistical technique to the production of ethanol from sugar beet molasses by Saccharomyces cerevisiae.Process Biochem., 73, 251-255.
11. Flach, J.; Pilet, P. E.; Jolles, P. (1992). What's new in chitinase research? Experientia, 48, 701-716.
12. Fleuri, L. F.; Kawaguti, H. Y.; Sato, H. H. (2009). Production, purification and application of extracellular chitinase from Cellulosimicrobium cellulans 191.Braz. J. Microbiol., 40, 623. 13. Gaoqiang, L.; Xiaoling, W. (2007). Optimization of critical medium
components using response surface methodology for biomass and extracellular polysaccharide production by Agaricus blazei. Appl. Microbiol. Biot., 74, 78-83.
14. Gheshlaghi, R.; Scharer, J. M.; M, M.-Y.; Douglas, P. L. (2005). Medium optimization for hen egg white lysozyme production by recombinant Aspergillus niger using statistical methods. Biotechnol. Bioeng., 90, 754–760.
15. Gillis, M.; Vandamme, P.; De Vos, P.; Swings, J.; Kersters, K. (2001). Bergey’s Manual of Systematic Bacteriology. Boone, D. R. Castenholz, R. W. e. New York: Springerd. P. taxonomyIn.
16. Gooday, G. W. (1999). Chitin and chitinases. Birkh userd. P. Aggressive and defensive roles for chitinases. In: Jolle´s, Muzzarelli, R.A.A. (Eds.). 17. Graham, L. S.; Sticklen, M. B. (1994). Plant chitinases.Can. J. Biochem.
72, 1057-1083.
18. Hobel, C. F. V.; Hreggvidsson, G. O.; Marteinsson, V.; Bahrani-Mougeot, F.; Einarsson, J.; Kristjansson, J. (2005). Cloning, expression, and characterization of a highly thermostable family 18 chitinase from Rhodothermus marinus.Extremophiles, 9, 53-64.
19. Huang, X. Q.; Wang, Y. F.; Cui, Y. H.; Hua, X. (2010). Optimization of Antifungal Effect of Surfactin and Iturin to Penicillium notatum in Syrup of Peach by RSM.Int. J. Pept. Res. Ther., 16, 63-69.
20. Kalil, S.; Maugeri, F.; Rodrigues, M. (2000). Response surface analysis and simulation as a tool for bioprocess design and optimization.Process. Biochem., 35, 539-550.
21. Liu, C.; Liu, Y.; Liao, W.; Wen, Z.; Chen, S. (2003). Application of statistically-based experimental designs for the optimization of nisin production from whey.Biotechnol. Lett., 25, 877-882.
22. Ludwig, W.; Strunk, O.; Klugbauer, S.; Klugbauer, N.; Weizenegger, M.; Neumaier, J.; Bachleitner, M.; Schleifer, K. H. (1998). Bacterial phylogeny based on comparative sequence analysis.Electrophoresis, 19, 554-568.
23. Miyashita, K.; Fujii, T.; Sawada, Y. (1991). Molecular cloning and
characterization of chitinase gene from Streptomyces lividans. J. Microbiol., 137, 2065-2072.
24. Muzzarelli, R. (1999). Native, industrial and fossil chitins.In:Jolles P and Muzzareli RAA (eds) Chitin and chitinases Birkhauser, Basel, pp 1-6.
25. Nakamura, T.; Ogata, Y.; Hamada, S.; Ohta, K. (1996). Ethanol production from Jerusalem artichoke tubers by Aspergillus niger and Saccharomyces cerevisiae* 1.J. Ferm. Bioeng. 81, 564-566.
26. Narayana, K. J. P.; Vijayalakshmi, M. (2009). Chitinase Production by Streptomyces sp. Anu 6277.Braz. J. Microbiol., 40, 725-733.
27. Ooijkaas, L. P.; Wilkinson, E. C.; Tramper, J.; Buitelaar, R. M. (1999). Medium optimization for spore production of Coniothyrium minitans using statistically-based experimental designs.Biotechnol. Bioeng., 64, 92-100.
28. Rao, K. J.; Kim, C. H.; Rhee, S. K. (2004). Statistical optimization of medium for the production of recombinant hirudin from Saccharomyces cerevisiae using response surface methodology.Process Biochem., 35, 639–647.
29. Rojas-Avelizapa, L. I.; Cruz-Camarillo, R.; Guerrero, M. I.; Rodriguez-Vazquez, R.; Ibarra, J. E. (1999). Selection and characterization of a proteo-chitinolytic strain of Bacillus thuringiensis, able to grow in waste media.World J. Microb. Biot. 15, 261-268.
30. Sato, K.; Kato, Y.; Taguchi, G.; Nogawa, M.; Yokota, A.; Shimosaka, M. (2009). Chitiniphilus shinanonensis gen. nov., sp nov., a novel chitin-degrading bacterium belonging to Betaproteobacteria. J. Gen. Appl. Microbiol., 55, 147-153.
31. Singh, A. K.; Mehta, G.; Chhatpar, H. S. (2009). Optimization of medium constituents for improved chitinase production by Paenibacillus sp. D1 using statistical approach.lett. Appl. microbiol., 49, 708-714. 32. Treichel, H.; Oliveira, D.; Mazutti, M. A.; Di Luccio, M.; Oliveira, J. V.
(2010). A Review on Microbial Lipases Production.Food Bioprocess Tech., 3, 182-196.
33. Vaidya, R. J.; Shah, I. M.; Vyas, P. R.; Chhatpar, H. S. (2001). Production of chitinase and its optimization from a novel isolate Alcaligenes xylosoxydans: potential in antifungal biocontrol. World J. Microb. Biot., 17, 691-696.
34. Wang, S. L.; Lin, T. Y.; Yen, Y. H.; Liao, H. F.; Chen, Y. J. (2006). Bioconversion of shellfish chitin wastes for the production of Bacillus subtilis W-118 chitinase.Carbohydr. Res., 341, 2507-2515.
35. Wasli, A. S.; Salleh, M. M.; Abd-Aziz, S.; Hassan, O.; Mahadi, N. M. (2009). Medium Optimization for Chitinase Production from Trichoderma virens using Central Composite Design. Biotechnol. Bioprocess. Eng., 14, 781-787.