ISSN 0104-6632 Printed in Brazil
Vol. 19, No. 02, pp. 181 - 186, April - June 2002
Brazilian Journal
of Chemical
Engineering
OPTIMIZATION OF ACETOIN PRODUCTION
BY
Hanseniaspora guilliermondii
USING
EXPERIMENTAL DESIGN
R.M.Teixeira, D.Cavalheiro, J.L.Ninow and A.Furigo Jr.*
Department of Chemical Engineering and Food Engineering, Technological Center, Federal University of Santa Catarina, Phone +55-48-331-9448, Campus Universitário,
Trindade, CEP 88040-900, Cx.P. 476, Florianópolis - SC, Brazil. E-mail: [email protected]
(Received: February 10, 2002 ; Accepted: May 3, 2002)
Abstract - The synthesis of acetoin in YM medium and under aerobic conditions by Hanseniaspora
guilliermondii was studied. Experimental design and surface response analysis were employed to evaluate the influence of glucose concentration, temperature and pH on the process. The experiments were carried out in shaking flasks under controlled temperature. Five different levels of initial concentration of glucose, temperature and pH were used with variations from 17 to 81 g/L, from 24 to 36oC and from 4.0 to 6.0, respectively. The maximum concentration of acetoin was the response obtained. The parameters which affected acetoin production most were initial concentration of glucose and temperature. An empirical model that showed statistically significant and predictive capacity was constructed. The optimum values of glucose concentration and temperature obtained for acetoin production were 63 g/L and 28oC, respectively.
Keywords:acetoin, Hanseniaspora guilliermondii, flavors, experimental design.
INTRODUCTION
Flavors are present in all foods and can be formed during processing or by activity of microorganisms. Frequently, to reinforce or mask the taste of foods, it is necessary to add chemical substances to make the product more attractive to the consumer. In this way, flavorings have become indispensable additives for the food industries. The presence of flavor increases the value of the product, thereby decreasing the importance of bioprocessing costs in the price of the final product (Gatfield, 1995).
The role of biotechnology in the synthesis of flavors is increasing. Synthetic flavorings derived from chemical or petrochemical industries have gradually been substituted for flavors of enzymatic or fermentative origin. Biotechnological processes are less aggressive to the environment; in addition, the food laws of many countries recognize the fact
that natural flavors can be obtained via biotechnology (Christen and López-Munguia, 1994).
Due to the growing demand on the consumer market for utilization of natural products and also the high costs of purification and extraction processes, many research groups have sought to study bioprocesses capable of producing natural compounds that may be of commercial interest.
In 1996, the worldwide flavor and fragrance business was valued at an estimated $10 billion, representing a 7.5% compounded yearly growth since 1992. Growth in consumption of these products is projected to continue at an average of 4-5% per year through 2002 (Somogyi et al., 1998).
According to Romano and Suzzi (1996), high concentrations of acetoin are produced by
Hanseniaspora guilliermondii, an apiculate yeast that is found during the earlier stages of wine fermentation.
In order to study acetoin production by
Hanseniaspora guilliermondii, we employed
experimental design and surface response analysis to evaluate the influence of initial concentration of glucose, temperature and pH on the process. In addition, we identified the optimum conditions to obtain a maximum concentration of acetoin.
MATERIAL AND METHODS
Experimental Design
This work studied how acetoin production by
Hanseniaspora guilliermondii is affected by three independent variables (Xi): initial concentration of
glucose (X1), temperature (X2) and pH (X3).
Maximum concentration of acetoin was the dependent output variable. A 2k factorial design with six axial center points (α) and two replicates at the center point was employed.
The α value can be calculated according to Equation (1):
4 k2
α = (1)
where k is the number of independent variables. According to this design, the total number of treatment combinations is 2k + 2k + no, where no is
the number of repetitions at the center point. Therefore, a total number of sixteen experiments was employed. All of the experiments were performed at random. For statistical calculations, the variables Xi were coded as xi according to Table 1.
The behavior of the system is explained by the following quadratic equation:
3 3 2 3
2
o i i ii i ij i j
i 1 i 1 i 1 j i 1
Y b b x b x b x x
= = = = +
= +
∑
+∑
+∑ ∑
(2)
where Y is the predicted response and bo, bi, bii, bij
the regression coefficient related to average, linear, quadratic and interaction effects, respectively.
The fit between the model and the experimental data was evaluated by ANOVA (Analysis of Variance). The F-test was applied to verify whether the model could predict a significant variation in the
experimental data. The statistical analysis was performed using Statistica® 5.0 software.
Optimization of Process Conditions
The optimum conditions for acetoin production were determined from the dimensionless coded values, which maximize the response of the function (model). This optimization is obtained by Equation (3).
1 2 3 i
Y(x , x , x ) 0 x
∂ =
∂ (3)
Where Y is the studied function, x1, x2, x3 are the
dimensionless coded variables and i = 1, 2, 3.
Microorganism
Hanseniaspora guilliermondii CCT 3800 was
obtained from the Fundação Tropical de Pesquisa e Tecnologia “André Tosello” (Campinas - SP, Brazil). The yeast was maintained on yeast malt (YM) agar slants containing (per liter of water): glucose (10.0 g), yeast extract (3.0 g), malt extract (3.0 g), peptone (5.0 g) and agar (20.0 g). The pH of the medium was adjusted to 5.0. The culture was incubated at 28oC for 24 hours and then maintained at 4oC.
Assays
The assays were carried out in yeast malt medium, in which the glucose concentration was varied according to Table 1. Batch cultures were carried out in Erlenmeyer flasks under agitation (100 min-1) and controlled temperature. The experiments ran for 24 hours and samples were taken at regular time intervals for acetoin analysis.
Determination of Acetoin Concentration
RESULTS AND DISCUSSION
Experimental Design
Three independent variables that exert an influence on the acetoin production by Hanseniaspora guilliermondii
were chosen: initial concentration of glucose, temperature and pH. The matrix for the factorial design is shown in Table 2 together with the experimental results.
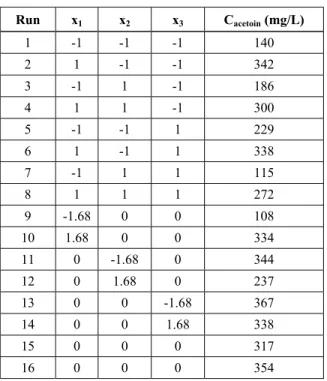
The amplitude of response values varied from 108 to 367 mg/L of acetoin. Romano et al. (1993) studied 48 strains of Hanseniaspora guilliermondii
that produced approximately 200 mg/L of acetoin using grape must as substrate. In this work, the maximum value (367 mg/L) is almost 84% higher than previously cited.
Table 3 shows the estimation of main and interaction effects of independent variables on maximum concentration of acetoin (response). According to these results, only the initial concentration of glucose and temperature are significant with a confidence level of 95% using the quadratic approximative (without the interaction term).
An empirical model was fitted to the experimental results, for which the regression coefficients are shown in Table 4. It is important to emphasize that the model parameters were obtained from dimensionless variables.
Using the significant effects, the equation relating to the maximum concentration of acetoin is given below:
acetoin 1
2 2
2 1 2
C 332.70 70.50x
26.09x 49.10x 24.44x
= + −
− − −
(4)
where Cacetoin is the maximum concentration of acetoin (mg/L) and x1 and x2 are dimensionless variables, the initial concentration of glucose and temperature, respectively.
The statistical significance of this model was evaluated by ANOVA (Analysis of Variance) and the results are shown in Table 5. The F-test revealed that this regression was statistically significant at a confidence level of 95%.
The correlation coefficient (R2 = 0.9114)
indicates that a 91.14% variability can be explained by the model. According to Barros Neto et al. (1995), when the F value is at least four times greater than F tabulated the empirical model can be considered predictive. Therefore, this model, in addition to its statistical significance, has clear predictive value.
Figure 1 shows the surface response relating to the model for the maximum concentration of acetoin. The plotted variables are those that had significant effects and the unplotted variable (pH) is fixed at the center point.
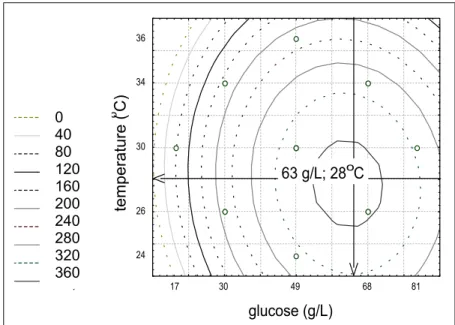
Analyzing the surface responses (Figure 1), it is notable that high concentrations of glucose favor acetoin production. This fact can be attributed to greater availability of pyruvate from glycolysis. According to Chuang and Collins (1968), high concentrations of pyruvate enable greater production of secondary metabolites.
In Figure 1 it can be seen that the intermediate temperatures (around 30oC) stimulated acetoin production. According to Romano and Suzzi (1992), the quantity of acetoin produced increases when fermentation is carried out at 30oC, as compared to 12, 18 and 24oC, because this increases the rate of α -acetolactate decomposition.
Optimization of Conditions for Acetoin Production
To evaluate the optimum conditions for acetoin production, the maximum point of Equation 4 was determined for each statistically significant variable in the model. The dimensionless values obtained were 0.718 and –0.534 for the initial concentration of glucose and temperature, respectively. The real values were 63 g/L of glucose and 28oC, which are shown in contour lines in Figure 2. These conditions correspond to 365 mg/L of acetoin. It is important to emphasize that pH was not optimized, because it did not show statistical significance in the production of acetoin. Therefore, this variable can be fixed at any value in the range studied (4.0 to 6.0).
The acetoin concentration obtained from the model was near to the experimental values in assays 13 to 16 (Table 2). Conditions in the culture were similar to those obtained from the optimization.
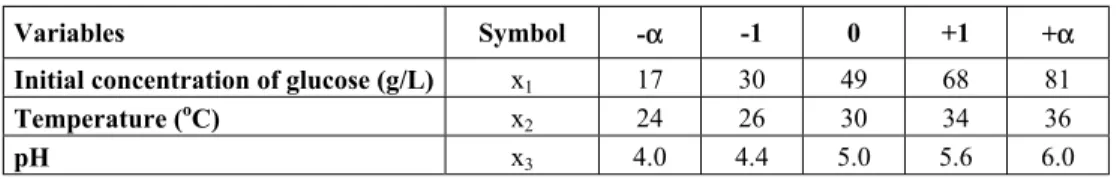
Table 1: Coded and real values of independent variables
Variables Symbol -α -1 0 +1 +α
Initial concentration of glucose (g/L) x1 17 30 49 68 81
Temperature (oC) x2 24 26 30 34 36
pH x3 4.0 4.4 5.0 5.6 6.0
Table 2: A 23 full-factorial matrix with six axial points and experimental results
Run x1 x2 x3 Cacetoin (mg/L)
1 -1 -1 -1 140
2 1 -1 -1 342
3 -1 1 -1 186
4 1 1 -1 300
5 -1 -1 1 229
6 1 -1 1 338
7 -1 1 1 115
8 1 1 1 272
9 -1.68 0 0 108
10 1.68 0 0 334
11 0 -1.68 0 344
12 0 1.68 0 237
13 0 0 -1.68 367
14 0 0 1.68 338
15 0 0 0 317
16 0 0 0 354
*Runs performed at random
Table 3: Effects of independent variables on the response maximum concentration of acetoin (Cacetoin)
Process variables Effect Standard deviation
x1 141.00* 18.67
(x1) 2
-98.21* 20.56
x2 -52.17* 18.67
(x2)2 -48.87* 20.56
x1*x3 -12.62 24.39
x2*x3 -46.03 24.39
*Significant effects with a confidence level of 95%; x1: initial concentration of glucose;
x2: temperature;
x3: pH
Table 4: Regression coefficients for the model fitted to maximum concentration of acetoin (Cacetoin)
Regression coefficients Standard deviation
Mean 332.70* 16.55
x1 70.50* 9.33
(x1)2 -49.10* 10.28
x2 -26.09* 9.33
(x2)2 -24.44* 10.28
x1*x3 -6.31 12.20
x2*x3 -23.02 12.20
*Significant effects with a confidence level of 95%; x1: initial concentration of glucose;
x2: temperature;
Table 5: Analysis of variance of the regression
Source of
variations Sum of squares
Degrees of
freedom Mean square Fc Ft
Regression 110107.22 6 18351.20 15.42 3.37
Residue 10709.66 9 1189.96
Total 120816.88 15
* R2 = 0.9114; confidence level: 95%; F
c: F-calculated; Ft: F-tabulated
Figure 1: Surface response to maximum concentration of acetoin described by initial concentration of glucose and temperature (pH=5.0)
0,000 40,000 80,000 120,000 160,000 200,000 240,000 280,000 320,000 360,000
glucose (g/L)
temperature (
o C)
24 26 30 34 36
17 30 49 68 81
63 g/L; 28oC
Figure 2: Contour lines for maximum concentration of acetoin and optimum conditions for initial concentration of glucose and temperature
CONCLUSIONS
The results obtained permit us to conclude that from three studied variables (initial concentration of glucose, temperature and pH) only the effects of initial concentration of glucose and pH showed statistical significance (with a confidence level of 95%) within the evaluated range. The empirical model showed statistical significance and predictive ability. The optimum conditions for acetoin production were 63 g/L and 28oC for the initial concentration of glucose and temperature, respectively. Varying the pH between 4.0 and 6.0 did not show any significant effect, and therefore, pH can be fixed at any value within this range. The maximum concentration of acetoin obtained from the model was 365 mg/L. This value is close to experimental results obtained under similar conditions.
REFERENCES
Barros Neto, B., Sacarminio, I.S. and Bruns, R.E. Planejamento e Otimização de Experimentos. Editora da Unicamp, Campinas (1995).
Christen, P. and López-Munguia, A. Enzymes and Food Flavor - A Review. Food Biotechnology, 6,
Nos. 2 and 3, 167-190 (1994).
Chuang, L. and Collins, E. Biosynthesis of Diacetyl in Bacteria and Yeast. Journal of Bacteriology, 95, No. 4, 2083-2089 (1968).
Gatfield, I.L. Enzymatic and Microbial Generation of Flavors. Perfumer & Flavorist, 2, 5-14 (1995). Romano, P. and Suzzi, G. The Effect of
Saccharomyces cerevisae Strains on the
Formation of Acetaldehyde and Acetoin During Fermentation. Proceedings of Technical Meeting of European Brewing Convention, Zocterxolvole, The Netherlands, 231-247 (1992).
Romano, P., Suzzi, G., Zironi, R. and Comi, G. Biometric Study of Acetoin Production in
Hanseniaspora guilliermondii and Kloeckera
apiculata. Applied and Environmental
Microbiology, 59, No. 6, 1838-1841 (1993). Romano, P. and Suzzi, G. Origin and Production of
Acetoin During Wine Yeast Fermentation – A Review. Applied and Environmental Microbiology, 62, No. 2, 309-315 (1996).
Somogyi, L., Cometta, C. and Takei, N. Flavors and Fragrances.http://scup.sric.sri.com/Public/Reports /FLAVO000 (1998).