INTRODUCTION
An increasing number of studies on biological and genetical variability of Anopheles darlingi have been pub-lished in the last few years due to the importance of this mosquito as the major vector of human malaria in Brazil, especially in the Amazon region. These studies have dem-onstrated plasticity in response to environmental changes, which might affect the transmission of this disease (Santos et al., 1981, 1985; Tadei and Santos, 1982; Tadei et al., 1982; Rosa-Freitas et al., 1992, 1995; Harbach et al., 1993). Chromosome polymorphism studies have revealed significant genetic differentiation between populations of A. darlingi from northern and southern Brazil. High fre-quencies of inversion in heterozygotes were observed in populations from the Amazon region (Kreutzer et al., 1972; Tadei and Santos, 1982; Tadei et al., 1982).
Brazilian populations of A. darlingi revealed spe-cific differences in hydrocarbon profiles from Ilha de Maracá, State of Roraima, and Jaru, State of Rondônia (Walsh, 1989, in Rosa-Freitas et al., 1995). Distinctive hydrocarbon patterns in this species were also found by Rosa-Freitas et al. (1992) in Dourado (São Paulo) and Costa Marques (Rondônia), although specimens from Juturnaíba were often misassigned. However, these authors did not find significant behavior or allozyme differences in these populations.
Mitochondrial DNA and morphological studies were carried out for six Brazilian populations of A. darlingi (Juturnaíba, Dourado, Costa Marques, Cuiabá, Manaus,
and Capanema), but none showed morphological differ-ences, and nucleotide divergence estimates were not high (Rosa-Freitas et al., 1995).
In the present study, four populations of A. darlingi were analyzed using enzymatic variation of 19 loci to un-derstand the genetic structure of this species, which is the principal vector of human malaria in the Brazilian Ama-zon.
MATERIAL AND METHODS
Mosquitoes were obtained from natural populations from four locations in the Amazon region: Ariquemes (10o S, 63o W) and Porto Velho/Samuel (9o S, 63o W), State of Rondônia; Manaus (3o S, 60o W), State of Amazonas, and Cachoeira Porteira (1o S, 57o W), State of Pará (Figure 1). Wild females laid eggs individually in the labora-tory, and from each single brood an average of five indi-viduals were used for each single enzymatic system (Table I). Electrophoretic techniques and enzyme recipes were those described in Steiner and Joslyn (1979) and Lima and Contel (1990). The gels were prepared as described by Santos et al. (1996). The following loci were analyzed: EST1, EST2, EST5, LAP1, LAP2, LAP5, IDH1, IDH2, ODH1, ODH2, ODH3, AO1, AO2, XDH1, GDH, G-6PDH, 6-PGDH, α-GPDH and PGM.
Allele frequencies were estimated directly from the data. In the case of null alleles, their frequencies were es-timated by maximum likelihood, using the dominance model of inheritance. Proportion of polymorphic loci (P), heterozigosities and Wright’s F-coefficients were estimated using the Biosys Program (Swofford and Selander, 1981). The fixation index within populations (Fis) was also calcu-lated using ALPHA software of the Genioc Program col-lection (Cabello and Krieger, 1997), with option 4 (calcu-lation of F between systems). A dendrogram was con-structed using the UPGMA method (Nei, 1978).
INTRAPOPULATIONAL GENETIC DIFFERENTIATION IN Anopheles (N.) darlingi
ROOT, 1926 (DIPTERA: CULICIDAE) IN THE AMAZON REGION
Joselita Maria Mendes dos Santos1, Jorge Arturo Lobo2, Wanderli Pedro Tadei1 and Eucleia P. Betioli Contel3
ABSTRACT
Four natural Amazonian Anopheles darlingi populations were analyzed for 19 loci, 12 of which showed variation, i.e., 68.4% of polymorphic loci. The Ariquemes, Rondônia, population was the most variable, with a large number of alleles per locus (2.26 ± 0.27) and high polymorphism (P = 63.15). The highest values of observed and expected intralocus heterozygosity were observed in the Manaus, Amazonas, population (Ho = 0.432 ± 0.11; He = 0.375 ± 0.08), and the lowest in the Cachoeira Porteira, Pará, population (Ho = 0.236 ± 0.09; He = 0.290 ± 0.11). Wright’s F-statistic revealed disequilibrium caused by an excess of homozygotes, as shown by the Fis > Fst values(Fis = 0.083 > 0.026) reflecting intrapopulational differentiation. The four populations studied were genetically similar, as indicated by distance and similarity values. Chromosomal variation of Amazon population also did not indicate geographical differentiation, and populations in the central region of the Amazon Basin showed high polymorphism in relation to the marginal populations, which were mainly monomorphic.
1Coordenação de Pesquisas em Ciências da Saúde, INPA, Alameda Cosme Ferreira, 1756, 69011-970 Manaus, AM, Brasil. Send correspondence to J.M.M.S.
Figure 1 - Collection sites of Anopheles darlingi populations in the Amazon region.
Table I - Gene frequencies of alleles at each locus of the Anopheles darlingi populations analyzed. (N) = Sample size; O = null allele; nc = frequency not calculated; - = inexistent
allele; 1 = rare PGM alleles. Population
Locus Allele Ariquemes Porto Velho / Cachoeira Manaus Samuel Porteira
EST2 (N) 273 223 236 56
F 0.468 0.363 0.460 0.518
S 0.532 0.637 0.540 0.482
EST5 (N) 397 209 198 41
A 0.307 0.218 0.291 0.341
B 0.227 0.409 0.376 0.427
C 0.260 0.249 0.151 0.146
D 0.206 0.124 0.182 0.086
IDH1 (N) 145 299 76 106
A 0.024 - 0.020 0.108
B 0.952 0.930 0.908 0.741
C 0.024 0.070 0.072 0.151
ODH1 (N) 133 119 136 106
F 0.135 0.155 - 0.146
S 0.865 0.845 1.000 0.854
(N) 0 126 0 0
F nc 0.125 nc nc
S nc 0.657 nc nc
O nc 0.218 nc nc
AO1 (N) 130 135 131 98
F 0.977 0.978 1.000 1.000
S 0.023 0.022 -
-PGM (N) 156 119 84 101
A 0.170 0.134 0.179 0.074
B 0.647 0.702 0.780 0.861
C 0.048 0.164 0.042 0.064
A1 0.042 - -
-B1 0.093 - -
-No. of alleles/locus 2.26 ± 0.27 2.05 ± 0.23 1.94 ± 0.23 1.89 ± 0.22
% Polymorphic loci 63.15 57.89 52.63 52.63
km 500 0
RESULTS
Allelic frequencies and polymorphism
Twelve of the 19 loci studied presented genetic vari-ability in the four populations: EST1, EST2, EST5, LAP5, IDH1, ODH1, ODH2, ODH3, AO1, AO2, α-PGDH, and PGM. LAP1, LAP2, IDH2, XDH1, GDH, G-6PDH and 6-PGDH were monomorphic in all populations. The locus 6-PGDH showed variation only in the Ariquemes population. Table I shows the number of alleles per locus in each of the four populations. The Ariquemes population was the most polymorphic and presented the largest num-ber of alleles per locus. The Manaus and Cachoeira Porteira populations showed the lowest degree of polymorphism and the lowest number of alleles per locus.
Hardy-Weinberg equilibrium
Most of the loci analyzed in the Ariquemes and Manaus populations were not in Hardy-Weinberg equilib-rium (Table II). Porto Velho/Samuel and Cachoeira Porteira population loci were found to be in equilibrium, except forEST2 in the latter and IDH1 in both. However, EST2 homozygotes from the same population were more fre-quent than expected (EST2*F/EST2*F and EST2*S/ EST2*S genotypes). The same was observed in Ariquemes, where homozygote classes for the same locus (EST2) pre-sented significantly higher values than heterozygotes, and this pattern (excess of homozygotes) was not observed for all loci for which chi-square values were significant. In the Manaus population, the heterozygote class was the most frequent for theEST2 locus.
Estimate of heterozygosity and F coefficient of Wright
Levels of observed and expected intralocus het-erozygosity varied within each population (Table III). The
Manaus population showed the highest level of heterozy-gosity. This result contrasts with those obtained for num-ber of alleles per locus and percentage of polymorphic loci, for which Manaus presented the lowest variability. The Porto Velho/Samuel population presented a wide range of observed heterozygosity and an amplitude of expected heterozygosity. Most of the loci analyzed also had excess homozygotes, with highly significant F values at the 1% level for loci EST2.
Despite the excess homozygotes observed in most of the loci analyzed, we also detected excess heterozy-gotes for locus EST5in Ariquemes, ODH1in Porto Velho/ Samuel and EST2, IDH1 and PGM in Manaus. Of these, only EST2 in Manaus and EST5 in Ariquemes showed sta-tistically significant (P < 0.05) excess heterozygosity.
The total F calculated by maximum likelihood (Table III) shows that there was significant disequilibrium in favor of excess homozygosity in the Ariquemes, Porto Velho/Samuel and Cachoeira Porteira populations. The mean F for Manaus was 0.01 ± 0.03, which does not differ significantly from zero. However, the standard error for the F estimates in the other populations ranged from 0.02 to 0.03, being much lower than the mean estimated val-ues. The F coefficient was higher in Cachoeira Porteira and lower in Porto Velho/Samuel, possibly due to the in-fluence of EST2 locus which did not show disequilibrium in Porto Velho/Samuel.
However, as can be seen from the values for each locus, mean F was significantly different between sys-tems of the Ariquemes and Cachoeira Porteira popula-tions, precisely those with the highest F values. This re-sult was obtained from the chi-square values for hetero-geneity (Table III).
Population genetic structure
Fis and Fst values varied considerably from locus to locus. Fis values were greater than Fst values for almost all loci, with the exception of EST5 and IDH1 (Table IV).
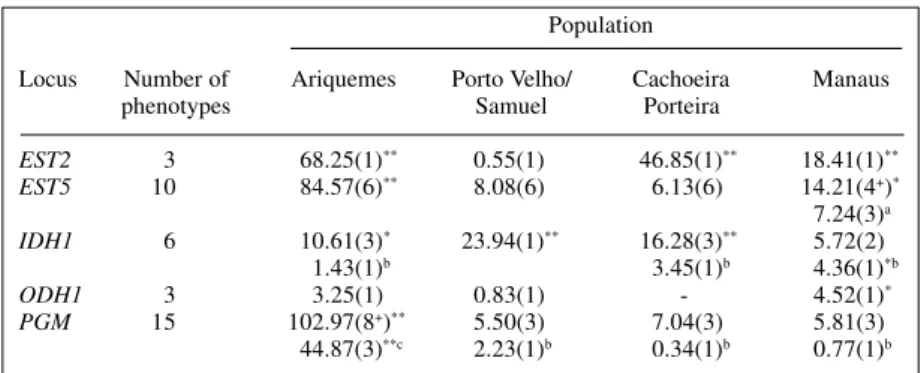
Table II - Chi-square values observed in test of Hardy-Weinberg equilibrium for five
polymorphic loci in natural populations of Anopheles darlingi. Population
Locus Number of Ariquemes Porto Velho/ Cachoeira Manaus
phenotypes Samuel Porteira
EST2 3 68.25(1)** 0.55(1) 46.85(1)** 18.41(1)** EST5 10 84.57(6)** 8.08(6) 6.13(6) 14.21(4+)* 7.24(3)a IDH1 6 10.61(3)* 23.94(1)** 16.28(3)** 5.72(2) 1.43(1)b 3.45(1)b 4.36(1)*b ODH1 3 3.25(1) 0.83(1) .- 4.52(1)* PGM 15 102.97(8+)** 5.50(3) 7.04(3) 5.81(3)
Thus, we observed that gene frequency variability had an intrapopulational origin, and allele origin did not have much of an effect on the probability of sampling two dif-ferent alleles in the set of populations.
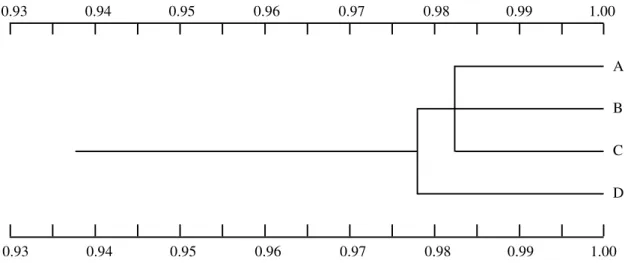
Genetic distance and similarity data indicate that the four populations studied are genetically similar (Table V). The Ariquemes population is the closest to the Manaus population. Nevertheless, Ariquemes, Cachoeira Porteira and Porto Velho/Samuel have more in common geneti-cally with each other than with Manaus (Figure II). The Manaus population is alone in a separate cluster.
DISCUSSION AND CONCLUSIONS
Levels of genetic variability
Allele frequency was not uniform for the different loci. Of the 19 loci analyzed, six presented variation. The observed deviation from genetic equilibrium was due in part to a larger number of observed than expected homozy-gotes, except for locus EST2 in the Manaus population.
Crouau-Roy (1988) pointed out that many studies have shown significant levels of heterozygote deficiency in natural populations, but usually these deficiencies are observed at some allozymic loci and/or only in some popu-lations which have other loci in equilibrium. It has also been observed that different loci do not present the same
Table V - Matrix of genetic distance and similarity among the four
Anopheles darlingi populations.
Population 1 2 3 4
1 Ariquemes ***** 0.012 0.010 0.024 2 Porto Velho/ 0.988 ***** 0.011 0.019 Samuel
3 Cachoeira 0.990 0.989 ***** 0.012 Porteira
4 Manaus 0.976 0.981 0.989 *****
The values above the diagonal correspond to unbiased genetic distance and those below the diagonal correspond to unbiased genetic identity (Nei, 1978).
Table IV - Analysis of intra- and interpopulation genetic structure by the Wright F-statistic in natural populations of Anopheles darlingi.
Locus Fis Fit Fst
EST2 0.106 0.117 0.013
EST5 -0.001 0.022 0.023
IDH1 -0.017 0.034 0.050
ODH1 0.113 0.150 0.041
AO1 0.659 0.663 0.070
PGM 0.198 0.221 0.029
Mean 0.083 0.107 0.026
Fis and Fit are the F values (fixation index) of the individuals in the sub-populations and total population, respectively. Fst is the degree of differen-tiation of the subpopulations in relation to the maximum possible differ-entiation in complete fixation.
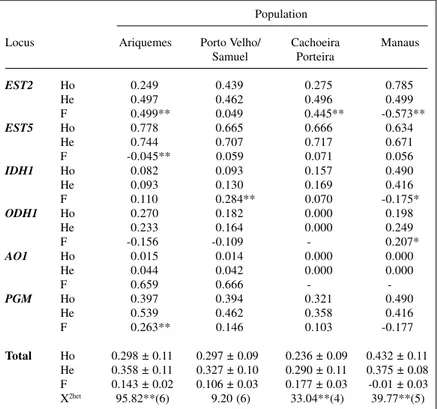
Table III - Observed (Ho) and expected (He) heterozygosity and respective Wright
F-value for each locus in the Anopheles darlingi populations analyzed. Population
Locus Ariquemes Porto Velho/ Cachoeira Manaus Samuel Porteira
EST2 Ho 0.249 0.439 0.275 0.785
He 0.497 0.462 0.496 0.499
F 0.499** 0.049 0.445** -0.573**
EST5 Ho 0.778 0.665 0.666 0.634
He 0.744 0.707 0.717 0.671
F -0.045** 0.059 0.071 0.056
IDH1 Ho 0.082 0.093 0.157 0.490
He 0.093 0.130 0.169 0.416
F 0.110 0.284** 0.070 -0.175*
ODH1 Ho 0.270 0.182 0.000 0.198
He 0.233 0.164 0.000 0.249
F -0.156 -0.109 - 0.207*
AO1 Ho 0.015 0.014 0.000 0.000
He 0.044 0.042 0.000 0.000
F 0.659 0.666 -
-PGM Ho 0.397 0.394 0.321 0.490
He 0.539 0.462 0.358 0.416
F 0.263** 0.146 0.103 -0.177
Total Ho 0.298 ± 0.11 0.297 ± 0.09 0.236 ± 0.09 0.432 ± 0.11
heterozygote deficiency. These observations have been frequently made in mosquitoes (Santos et al., 1985; Van Driel et al., 1987; Hii et al., 1991) and other insects (Stur-geon and Mitton, 1986: Crouau-Roy, 1988). These defi-ciencies were attributed by these investigators to differen-tial genotype selection, inbreeding, null alleles, founder effect (bottleneck) and even the population structure it-self. The same results were observed by Scarpassa (1988) in a natural population of A. nuneztovari from Tucuruí for three nonspecific esterase loci. The author attributed these results to ecological alterations introduced into the area which probably affected the genotype frequencies, with different adaptive values for homozygote classes.
In the case of null alleles for locus ODH1 of Porto Velho/Samuel population, it can be seen that the locus is in Hardy-Weinberg equilibrium. The occurrence of null alleles was observed in loci A and B of EST-C of A. punctipennis (Narang and Kitzmiller, 1971) and in the al-dehyde oxidase of A. nuneztovari (Narang et al., 1979).
On the basis of the data presented, though the alle-les had different frequencies among populations, the loci analyzed showed a certain homogeneity, with no detec-tion of diagnostic loci for the various populadetec-tions.
The proportion of polymorphic loci in the 19 loci analyzed in A. darlingi indicates a high level of polymor-phism even though the number of alleles per locus showed small variation. Narang et al. (1979) also found a high level of polymorphism (P = 0.632) for a population of A. darlingi from BR-174 (Manaus-Boa Vista). A relatively high degree of polymorphism has been also described in A. quadrimaculatus by Narang et al. (1989) in 50% of the 33 loci analyzed. However, Van Driel et al. (1987) found in strains of A. stephensi from Pakistan that only six loci were polymorphic of the 16 loci analyzed. This species also showed lower observed heterozygosity as compared with A. darlingi (Ho = 0.065 to 0.086/0.236 to 0.432). For 21 populations of different and incipient species of
Anoph-0.93 0.94 0.95 0.96 0.97 0.98 0.99 1.00
0.93 0.94 0.95 0.96 0.97 0.98 0.99 1.00
A
B
C
D
Figure 2 - Dendrogram resulting from grouping populations on the basis of genetic similarity by the unweighted pairing group method with arithmetic mean
(UPGMA), determined by Nei (1978). A, Ariquemes; B, Cachoeira Porteira; C, Porto Velho/Samuel, and D, Manaus.
eles, Cianchi et al. (1985) detected a wider range of both polymorphism and expected heterozygosity (0.31 ≤ P ≤ 0.78; 0.09 ≤ He ≤ 0.24). The large scope of genetic vari-ability in Anopheles species has been closely related to the very structure of the population, such as differential mating, mutation, selection, and genetic drift.
Considering the values observed for the A. darlingi population studied, there was high heterozygosity with levels close to those for the genus Culex (0.290 ≤ He ≤ 0.375). The same is true for polymorphism (0.526 ≤ P ≤ 0.631). H and P values obtained in the present study con-trast with those reported by Lanzaro et al. (1990) for the A. quadrimaculatus complex in which heterozygosity was much lower (0.10 ≤ H ≤ 0.18). However, polymorphism showed a greater amplitude of variation (0.32 ≤ P ≤ 0.60).
Genetic structure and population differentiation
The disequilibrium resulting from excess homozy-gotes was observed in strains of A. stephensi (Van Driel et al., 1987), in which Fisvalues were higher than Fst values for most of the loci analyzed. Mean fixation among the different loci was low (Fit = 0.107). However, locus Gpdh of A. stephensi and locus AO1 of A. darlingi had high fixa-tion indexes (Fit = 0.831 and 0.663, respectively). The loci, especially Gpdh and A01, did not make an equal contribu-tion in either species. For A. darlingi, the fixation index indicated the occurrence of some type of isolation in most of the loci analyzed, which interferred with random mat-ing within each population.
A. quadrimaculatus (Narang et al., 1990) was observed, as indicated by the Fst value of 0.219. Genetic divergence between populations can be observed when a certain de-gree of reproductive isolation has already become estab-lished in the populations, as described by Narang et al. (1990).
The genetic distance and similarity between the four A. darlingi populations indicate that these populations are genetically similar (0.976 ≤ I ≤ 0.990) although they are geographically isolated. The genetic distance of these popu-lations was very small (0.010 ≤ D ≤ 0.024), with Ariquemes showing the smallest genetic distance (0.010) compared to Cachoeira Porteira. However, this difference was not significant, so that Ariquemes, Cachoeira Porteira and Porto Velho/Samuel were grouped into the same cluster of the dendrogram.
Comparing these data with those for other mos-quito species shows that genetic similarity and distance are similar, except in interspecific cases. For example, for species of the A. marshalli complex, isoenzyme analysis showed little divergence, with a genetic similarity index of 0.803-0.972 (Lambert, 1983). These values are similar to some pairs of cryptic species in which the genetic dis-tances were D = 0.13 between A. gambiae Giles and A. arabiensis Patton; D = 0.23 between A. melanoon Hackett and A. maculipennis Meigen, and D = 0.17 between spe-cies A and B of A. stephensi strains (Van Driel et al., 1987). These results are similar to the values obtained for the four populations of A. darlingi, although with a lower ampli-tude of variation (0.010-0.024). These data may be inter-preted on the basis of the genetic structure of the popula-tions themselves, in which matings may occur with pref-erential crosses. Thus, considering the present data as a whole, we note that the populations presented greater intrapopulational than interpopulational differentiation in a process that has extended to four Amazonian popula-tions studied. Datas on chromosomal variation in differ-ent samples from Amazonia did not indicate geographi-cally differentiated populations. Samples from the central region of Amazon Basin did, however, present high poly-morphism in relation to the marginal populations, which were mainly monomorphic (Tadei and Santos, 1982; Tadei et al., 1982; Tadei, 1986).
ACKNOWLEDGMENTS
The authors are grateful to Juracy de Freitas Maia for technical assistance. This research was supported in part by CNPq/ELETRONORTE. Publication supported by FAPESP.
RESUMO
Amostras de populações naturais de Anopheles darlingi
foram analisadas para 19 locos, dos quais 12 apresentaram variação, com uma proporção de locos polimórficos de 68,40%. A população de Ariquemes mostrou maior variabilidade, com maior número de alelos por loco (2,26 ± 0,08) e maior polimorfismo (P = 63,15).
Levando-se em conta os níveis de heterozigosidade intraloco observados e esperados, os maiores valores foram observados na população de Manaus (Ho = 0,432 ± 0,11; He = 0,375 ± 0,08) e os menores na população de Cachoeira Porteira (Ho = 0,236 ± 0,09; He = 0,290 ± 0,11). Quando analisados pelas estatísticas F de Wright, os resultados mostraram desequilíbrio decorrente de
excesso de homozigotos, conforme mostram os valores de Fis >
Fst (0,083 > 0,026), denotando uma certa diferenciação
intrapopu-lacional. As quatro populações estudadas foram semelhantes geneticamente, conforme indicam os valores de distância e simi-laridade. As variações cromossômicas de populações da Amazônia não indicaram diferenciação geográfica, e na região central da bacia amazônica, estas foram altamente polimórficas em relação às marginais, que foram predominantemente monomórficas.
REFERENCES
Cabello, P.H. and Krieger, H. (1997). Genioc. Sistema para Análises de
Dados de Genética. FIOCRUZ, Rio de Janeiro.
Cianchi, R., Urbanelli, S., Villani, F., Sabatini, A. and Bullini, L. (1985). Electrophoretic studies in mosquitoes. Recent advances. Paras-sitologia 27: 157-167.
Crouau-Roy, B. (1988). Genetic structure of cave-dwelling beetle
popula-tions: significant deficiencies of heterozygotes. Heredity 60: 321-327.
Harbach, R.E., Roberts, D.R. and Manguin, S. (1993). Variation in the
hindtarsal markings of Anopheles darlingi (Diptera: Culicidae) in Belize. Mosq. Syst. 25: 192-197.
Hii, J.L.K., Chew, M., Sang, V.Y., Munstermann, L.E., Tan, S.G., Panyim, S. and Yasothornsrikul, S. (1991). Population genetic analy-sis of host seeking and resting behaviors in the malaria vector, Anoph-eles balabacensis (Diptera: Culicidae). J. Med. Entomol. 28: 675-684.
Kreutzer, R.D., Kitzmiller, J.B. and Ferreira, E. (1972). Inversion poly-morphism in the salivary gland chromosomes of Anopheles darlingi.
Mosq. News 32: 555-556.
Lambert, M.D. (1983). A population genetical study of the African
mos-quito Anopheles marshallii (Theoband). Evolution 37: 484-495.
Lanzaro, G.C., Narang, S.K. and Seawright, J.A. (1990). Speciation in
an Anopheline (Diptera: Culicidae) mosquito: Enzyme polymorphism and the genetic structure of populations. Ann. Ent. Soc. Am. 83: 578-585.
Lima, L.M.K.S. and Contel, E.P.B. (1990). Electrophoretic analysis of 12
proteins in natural populations of Spodoptera frugiperda (Lepi-doptera: Noctuidae). Rev. Bras. Genet. 13: 711-729.
Narang, G., and Kitzmiller, J.B. (1971). Esterase polymorphism in a natu-ral population of A. punctipennis. II. Analysis of the Est-C system.
Can. J. Genet. Cytol. 13: 771-776.
Narang, S., Santos, J.M.M., Garcia, J.C., Cristakou, H.D. and Narang,
N. (1979). Genética de populações de anofelinos IV. Estudos eletroforéticos das populações naturais de Anopheles nuneztovari e
Anopheles darlingi. Correlação genética entre espécies. Acta Amazonica 9: 529-542.
Narang, S.K., Kaiser, P.E. and Seawright, J.A. (1989). Dichotomus
elec-trophoretic taxonomic key for identification of sibling species A, B and C of the Anopheles quadrimaculatus complex (Diptera: Culi-cidae). J. Med. Ent. 26: 94-99.
Narang, S.K., Seawright, J.A. and Kaiser, P.E. (1990). Evidence for
microgeographic genetic subdivision of Anopheles quadrimaculatus
species C. J. Am. Mosq. Control Assoc. 6: 179-187.
Nei, M. (1978). Estimation of average heterozygosity and genetic distance
from a small number of individuals. Genetics 89: 583-590.
Rosa-Freitas, M.G., Broomfield, G., Priestman, A., Milligan, P.J.M.,
Momen, H. and Molyneux, D.H. (1992). Cuticular hydrocarbons,
isoenzymes and behavior of three populations of Anopheles darlingi
from Brazil. J. Am. Mosq. Control Assoc. 8: 357-366.
morphologi-cal analyses of Anopheles darlingi populations from Brazil (Diptera: Culicidae). Mosq. Syst. 27: 78-99.
Santos, J.M.M., Contel, E.P.B. and Kerr, W.E. (1981). Biologia de
Anofelinos amazônicos. 1. Ciclo biológico, postura e estádios larvais de Anopheles darlingi Root, 1926 (Diptera: Culicidae) da Rodovia Manaus/Boa Vista. Acta Amazonica 11: 789-797.
Santos, J.M.M., Contel, E.P.B. and Kerr, W.E. (1985). Biology of
Ama-zonian mosquitoes. III. Esterase isozymes in Anopheles darlingi. Acta Amazonica 15: 167-177.
Santos, J.M.M., Tadei, W.P. and Contel, E.P.B. (1996). Electrophoretic
analysis of 11 enzymes in natural populations of Anopheles (N.) darlingi Root, 1926 (Diptera: Culicidae) in the Amazon region. Acta Amazonica 26: 97-114.
Scarpassa, V.M. (1988). Estudo do ciclo biológico e de isoenzimas na
ontogênese de Anopheles(Nyssorrhynchus) nuñez-tovari Gabaldon, 1940 (Diptera: Culicidae). Master′s thesis, INPA/FUA, Manaus.
Steiner, W.W.M. and Joslyn, D.J. (1979). Electrophoretic techniques for
the genetic studies of mosquitoes. Mosq. News 39: 35-54.
Sturgeon, K.B. and Mitton, J.B. (1986). Allozyme and morphological
dif-ferentiation of mountain pine beetles Dendroctonus pondersae
Hopkins (Coleoptera: Scolytidae) associated with host tree. Evolu-tion 40: 290-302.
Swofford, D.L. and Selander, R.B. (1981). Biosys-1: A Fortran program
for the comprehensive analysis of electrophoretic data in population genetics and systematics. J. Hered. 72: 281-283.
Tadei, W.P. (1986). Estudos em espécies de Anopheles. Desempenho e rumos
da Genética no Brasil. Rev. Bras. Genét. IX (Anais): 221-223.
Tadei, W.P. and Santos, J.M.M. (1982). Biologia de anofelinos amazônicos. VII. Estudo da variação de freqüência das inversões cromossômicas de Anopheles darlingi Root (Diptera: Culicidae). Acta Amazonica 12: 759-785.
Tadei, W.P., Santos, J.M.M. and Rabbani, M.G. (1982). Biologia de
anofelinos amazônicos. V. Polimorfismo cromossômico de Anoph-eles darlingi Root (Diptera: Culicidae). Acta Amazonica 12: 353-369.
Van Driel, J.W., Sluiters, J.F. and Van Der Kaay, H.J. (1987). Allozyme
variation in Anopheles stephensi Liston from Pakistan (Diptera: Cu-licidae). Biochem. Genet. 25: 789-802.