Karina Yuri Harada, Julieta Gonçalves Silva Simone Schenkman, Eliana Tiemi Hayama Francisco Roberto Gonçalves Santos Mariângela Cainelli de Oliveira Prado Regina Helena Petroni Pontes
Original Article
REVISTA PA ULISTA DE M EDIC IN A
Medical Journal
S ã o Pa u l oINTRODUCTION
The Healthcare Center (HCC) o f the area where the Esco la Paulista de Medicina (EPM) is lo cated is staffed by pro fessio nals qualified fo r pro mo ting actio ns aimed at health and disease prevention, with the possibility of effective referral and co unter-referral mechanisms with the São Paulo Ho spital, linked to the Federal University o f São Paulo (UN IFESP). Ho wever, there is no recent scientific literature studying the resident po pulatio n in its healthcare co verage area. The drawing up o f adequate Public Health actio n p la nning to a d d re ss the true ne e d s o f the p o p ula tio n w o uld inc re a se the c ha nc e s o f e ffe c tive ne ss a nd d e c re a se unne c e ssa ry expenses. Kno wledge o f the po pulatio n is thus o f fund a me nta l imp o rta nc e a nd fo rms the o bjective o f this study.
The epidemio lo gic study perfo rmed in the city o f São Paulo in 1 9 8 4 by Ramo s et al 1 was o f great impo rtance, co nducted o n a co mmunity-based sample o f peo ple o ver 6 0 years o f age and stratified acco rding to the so cio -eco no mic status o f perso ns respo nsible fo r them. So me subsequent studies were co nducted in an attempt to characterize the po pulatio n o f the city o f São Paulo, most of them with participation of the IBG E
De limitation of homoge ne ous re gions in the
UNIFESP/EPM he althcare ce nte r cove rage are a
base d on sociode mographic indicators
Centro de Saúde Escola, Departamento de Medicina Preventiva,Universidade Federal
de São Paulo/Escola Paulista de Medicina, São Paulo, Brazil
ABSTRACT
Contex t: The drawing up o f adequate Public Health
actio n planning to address the true needs o f the po pulatio n wo uld increase the chances o f effectiveness and decrease unnecessary expenses.
O bjective: To identify ho mo geneo us regio ns in the UN IFESP/ EPM healthcare center (HCC) co verage area based o n so cio demo graphic indicato rs and to relate them to causes o f deaths in 1 9 9 5 .
Design: Seco ndary data analysis.
Setting: HCC co verage area; primary care.
Sa m ple: So cio demo graphic indicato rs were o btained
fro m special tabulatio ns o f the Demo graphic Census o f 1 9 9 1 .
M a in m ea sures: Pro po rtio n o f children and elderly in the po pulatio n; family pro viders’ educatio n level (maximum: >1 5 years, minimum: <1 year) and inco me level (maximum: > 2 0 minimum wages, minimum: <1 minimum wage); pro po rtio nal mo rtality distributio n.
Results: The maximum inco me permitted the co nstructio n
o f fo ur ho mo geneo us regio ns, acco rding to inco me ranking. Altho ugh the pro po rtio n o f children and o f elderly did no t vary significantly amo ng the regio ns, minimum inco me and educatio n sho wed a statistically significant (p<0 .0 5 ) difference between the first regio n (least affluent) and the o thers. A clear trend o f increasing maximum educatio n was o bserved acro ss the regio ns. Mo rtality also differed in the first regio n, with deaths generated by po ssibly preventable infectio ns.
Conclusion: The inequalities o bserved may co ntribute to
primary health preventio n.
(Brazilian Institute o f G eo graphy and Statistics) and the SEADE 2 (State System for Data Analysis) Fo undatio ns.
This study so ught to identify ho mo geneo us reg io ns within the EPM HCC co verag e area based o n so cio demo graphic indicato rs. It also aimed to relate the causes o f death in 1 9 9 5 with the delimitatio n o f these ho mo geneo us regio ns a nd to d e sc rib e the d istrib utio n o f its so cio demo graphic indicato rs.
METHODS
For this study, sociodemographic indicators were o btained fro m special tabulatio ns o f the Demographic Census of 1991. The IBGE database offers the information grouped into census sections of approximately 1000 residents each. The first step was to identify the 7 0 census sectio ns belonging to the EPM HCC coverage area, defining them by the streets that serve as their boundaries. Six variables of interest were compiled for studying the population of each section, as follows:
- pro po rtio n o f elderly: percentage o f peo ple aged 6 0 and o ver;
- proportion of children: percentage of children between 0 and 4 years;
- maximum educatio n: percentage o f family pro viders with mo re than 1 5 years o f study; - minimum educatio n: percentage o f family pro viders with less than 1 year o f study; - maximum inco me: percentag e o f family p ro vid e rs w ith inc o me g re a te r tha n 2 0 minimum wages; and
- minimum inc o me: perc enta g e o f fa mily providers with income below 1 minimum wage. So cial characterizatio n o f each census sectio n is so ught via these facto rs, but they do no t specifically address the relatio nship between health and disease. Altho ugh it seems clear that the area with the lo west educatio nal and inco me levels will present wo rse co nditio ns o f health than o ther areas, and therefo re different Public Health actio ns sho uld be directed to wards them, it was decided that the relatio nship between so cial level and health co nditio ns sho uld be o bjectively
investig a ted. Thus, c o rrela tio ns were ma de between info rmatio n o n causes o f death in the area during 1 9 9 5 , o btained fro m the PRO -AIM (p ro g ra m fo r imp ro ve me nt o f mo rta lity info rmatio n in the city o f São Paulo ), and the so c io d e mo g ra p hic va ria b le s fro m the co rrespo nding census sectio ns.
C ha ra c te riz ing e a c h c e nsus se c tio n acco rding to the pro po rtio ns o f elderly peo ple and children, and the educatio nal and inco me levels, pro vided the basic data fo r analyzing which o f these parameters differentiated the sectio ns better, so that similar census sectio ns co uld be gro uped to fo rm ho mo geneo us regio ns. To evaluate the behavio r o f the o ther so cio demo graphic variables and to verify the structure o f the causes o f death in different so cial districts o f the EPM HCC co verage area, the 7 0 census sectio ns were characterized by ranking the pro po rtio ns o f maximum inco me (abo ve 2 0 minimum wages). The pro po rtio ns o f elderly and children were equivalent in all sectio ns, thus no t b e ing g o o d ind ic a to rs fo r d isting uishing
ho mo g e ne o us re g io ns. N o r d id minimum e duc a tio n a nd inc o me disting uish b e twe e n sectio ns, since the percentage o f family pro viders in tho se co nditio ns was equally lo w. Maximum educatio n and maximum inco me maintain a pro po rtio nal and direct relatio nship to each o ther (the higher the educatio n level, the higher the family inco me). O f these indicato rs, maximum inco me exhibited substantial co ntrasts amo ng the sections and it distinguished between those which were simila r to ea c h o ther fo r defining the ho mo g eneo us reg io ns. The hig her the cut-o ff po int o f the variable, the better the discriminative po wer o f the indicato r was (fo r areas with similar socioeconomic levels), as in the case of maximum inco me, a po sitive indicato r.
The results are presented in the fo rm o f boxplots: graphs that present the distribution of the values, using the median as the reference. Thus, the “boxes” are drawn with the median represented by a line inside them. These “boxes” represent the values of the interquartile intervals that relate to the values included between the 2 5 th and 7 5 th
percentiles. Thus, 50% of the central values of the distribution around the median are included. So-called “fences” are traced out, extending from the tops and bases of these boxes, representing the up p e r a nd lo w e r limits o f the d istrib utio n, respectively. The upper limit is calculated from the sum of the 75th percentile value and 1.5 times the value of the interquartile interval (p25 to p75), being traced only as far as the highest value in the database that meets this condition. The lower limit, by analogy, is calculated by the subtraction of 1.5 times the value of the interquartile interval from the 25th percentile, and is traced as far as the lowest value in the database. Any value outside of these limits is represented by a small circle and classified as an outlier, i.e. a value very distant from the median and therefore rare.
O nce the homogeneous regions of EPM HCC coverage area were defined, the structure of causes of death was examined in these areas, following the main guidelines of the ICD-1975 (International Classification of Diseases, ninth revision). This first glance at the area would allow different mortality structures to be identified which would not have been recognized at first, when the data was consolidated in great heterogeneous areas.
RESULTS
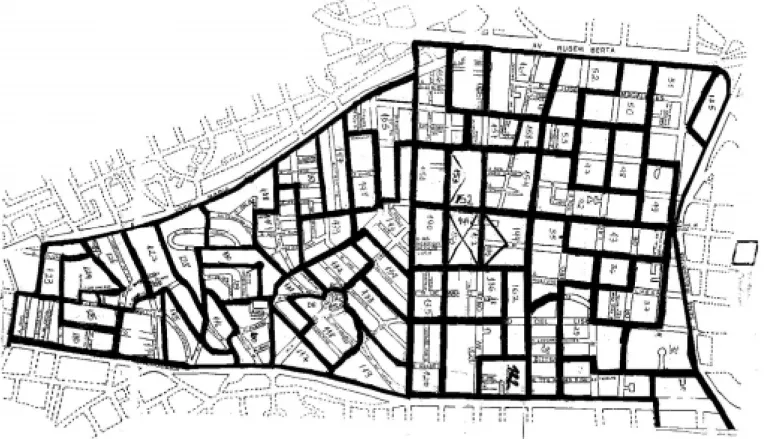
The total HCC coverage area (Figure 1), containing small parts of the Vila Mariana and Saude
Administrative Districts (Municipal Law no. 10,932 o f January 1 5 , 1 9 9 1 ) has a g enerally g o o d socioeconomic and cultural level, above the average for the total population of the city of São Paulo.
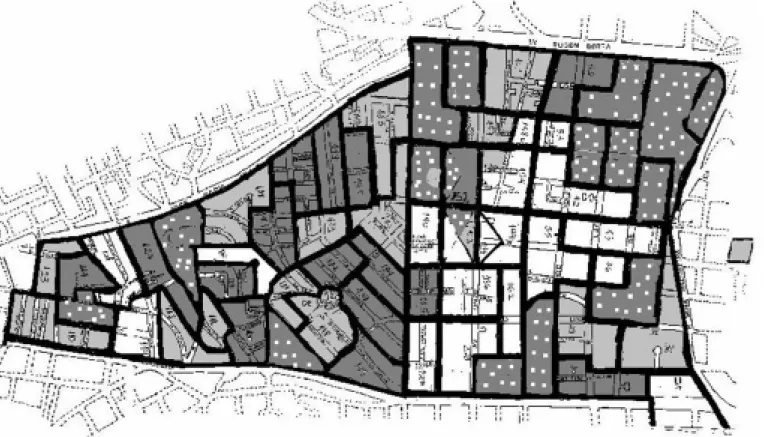
Graph 1 was compiled in accordance with the pro po rtio ns o f family pro viders with inco mes greater than 2 0 minimum wages, dividing the co verage area into fo ur regio ns with the same number o f sectio ns (quartiles). The first quartile (ho mo geneo us regio n I) is made up o f sectio ns in which the pro po rtio n o f family pro viders with maximum income was below 1 2 .5 %. The second quartile (ho mo geneo us regio n II) co ntains the sections in which the proportion of family providers with maximum income varied between 12.5% and 1 7 %. The third quartile (ho mo geneo us regio n III) co ntains the sectio ns in which the percentage o f family pro viders with maximum inco me varied between 1 7 % and 2 4 %, and the fo urth quartile (ho mo geneo us regio n IV) is made up o f sectio ns in which the percentage o f family pro viders with maximum inco me was o ver 2 4 %. Thus, a map co uld be drawn indicating the ho mo g eneo us regio ns (Figure 2 ).
W hen the pro po rtio n o f elderly peo ple is analyzed fo r each o f the fo ur areas, it can be verified that there is no statistically significant difference amo ng them. The elderly presented a median pro po rtio n o f 1 6 % in the to tal po pulatio n o f the fo ur regio ns (G raph 2 ).
The same pheno meno n is seen with the
Graph 1 - Distribution of proportions of family providers with monthly income of more than 20 minimum wages among the four homogeneous regions. UNIFESP/EPM Healthcare Center coverage area, 1996.
pro po rtio n o f children aged 0 to 4 years, which maintains a median o f aro und 5 % o f the to tal po pulatio n in the fo ur regio ns (G raph 3 ).
Reg arding minimum inco me, it can be seen that o nly the first quartilediffers statistically fro m the o thers, presenting a median o f 8 % o f family pro viders with inco me inferio r to o ne minimum wage; in the other quartiles, the median was estimated to be aro und 5 % (G raph 4 ).
Minimum education is distributed similarly: the first quartile includes the sectio ns who se distribution represents a median of 2.5% of family providers with less than a year of study; in the other quartiles, the median of the providers with minimum education is from 0.9% to 1.3%. Thus, a statistically significant difference between the first and the other quartiles was observed (Graph 5).
Differently, the graph that describes the distribution of the percentage of family providers with maximum education demonstrates a clearly increasing trend fro m the first to the fo urth homogeneous region. The first region includes those sections where the median of family providers with more than 15 years of study is 30.5%, and in the second region, 32%. In the third and fourth regions the median only varied slightly: 47.1 and 48.3% respectively, but with one difference: in the fourth region the distribution of the sections was more concentrated around the median, that is to say, the distribution was less dispersed than that of the third region (Graph 6).
W ith regard to the death data (PRO -AIM, 1 9 9 5 ), it co uld again be verified that the first region differed from the others. W hile the leading causes o f death in the seco nd, third and fo urth re g io ns w e re c a rd io va sc ula r d iso rd e rs, neoplasms, external causes and AIDS (not always in that same o rder), as is the o verall pattern in the city o f São Paulo , in the first area respirato ry diso rders were the seco nd big g est cause o f death, preceding neo plasms and these being fo llo wed by deaths fro m no n-alco ho lic cirrho sis. It is also interesting to o bserve that AIDS do es no t appear as an impo rtant cause o f death in the first regio n. Amo ng the respirato ry diso rders, 7 0 % w e re d ue to b ro nc ho p ne umo nia a nd tuberculo sis. As fo r no n-alco ho lic cirrho sis, it was no ticeable that it was especially due to viral he p a titis a ffe c ting ma inly c hild re n a nd newlybo rns (G raphs 7 to 1 0 ).
DISCUSSION
Sociodemographic indicators were studied in order to characterize the resident population in the UNIFESP HCC coverage area. For this purpose, various criteria3 were employed in choosing these indicato rs, such as: validity (adaptatio n o f the indicator to characterize the population), reliability (reproducibility of the data in new measurements), re pre se nta tivity (g ua ra nte e o f ha ving g o o d coverage of the area), as well as being attentive to
Graph 3 - Distribution of proportions of children aged 0-4 years among the four homogeneous re-gions. UNIFESP/EPM Healthcare Center coverage area, 1996.
ethical considerationsmatters (ensuring that data collection would not result in harm to the population and that confidentiality towards individuals was ma inta ine d). Thus, the ide ntific a tio n o f the proportions of children and of the elderly in the area was the first pertinent classification, since reg io ns with predo minantly yo ung o r elderly populations may need different health actions. All census sections had similar proportions of these age groups, whose sizes were close to the values seen in the developed world, with proportions of children between 3% and 5% and proportions of the elderly between 20% and 25%.
Ano ther indicato r that seemed o f great relevance was the degree o f educatio n amo ng the po pulatio n, because it may be inferred that educatio nal level and awareness o f risk facto rs in disease preventio n maintain a pro po rtio nal and direct relatio nship.3 Thus, the pro po rtio ns o f family pro viders with minimum and maximum educatio n revealed a go o d educatio nal level in the vast majo rity o f sectio ns, with the number o f family pro viders with tertiary educatio n (mo re than 1 5 years o f study) reaching almo st half o f the to tal and the pro po rtio n o f pro viders with less than o ne year o f study no t reaching 5 %. The indicato r also revealed a small gro up o f sectio ns where such characteristics were no t valid. In spite o f the differences it revealed, this indicato r did no t pro ve itself sensitive eno ugh to
d e fine ho mo g e ne o us re g io ns, sinc e the educatio nal level o f the area is rather unifo rm.
Stud ying the re la tio nship b e tw e e n educatio n and inco me in the area, a stro ng statistically significant co rrelatio n (r = 0 .7 1 8 3 ; p <0 .0 0 0 1 ) betweeen these two indicato rs was verified. In the evaluatio n o f minimum inco me a similar pattern to that o f educatio n was no ticed. A small gro up o f sectio ns stand o ut fro m the rest o f the po pulatio n because o f larger pro po rtio ns o f family pro viders witho ut educatio n and with minimum inco me. O n the o ther hand, the pattern o f the p ro p o rtio n o f fa mily p ro vid e rs w ith maximum inco me differed fro m all the o ther indicato rs, exhibiting an increasing trend acro ss the fo ur gro ups o f sectio ns.
The fundamental step in this study was to cho o se the best so cio demo grahic indicato r fro m among the available ones in order to discriminate b e tw e e n se c tio ns a nd g ro up the m into ho mo g e ne o us re g io ns. The p ro p o rtio n o f pro viders with maximum inco me turned o ut to be the mo st adequate indicato r fo r this purpo se. W hen the o ther indicato rs were analyzed in relatio n to maximum inco me, it was no ticed that the patterns fo und thro ugho ut the HCC co verage area repro duced themselves when divided into ho mo g e ne o us re g io ns (G ra p h 1 1 ), g iving suppo rt to the idea that this was mo st appro priate so c io e c o no mic ind ic a to r fo r the inte nd e d
Graph 5 - Distribution of proportions of family pro-viders with education less than one year of study among the four homogeneous regions. UNIFESP/EPM Healthcare Center coverage area, 1996.
divisio n. It can be o bserved that the distributio n o f maximum inco me presents a larger dispersio n o f va lue s a ro und the me d ia n, o nly b e ing e xc e e d e d b y the d istrib utio n o f ma ximum educatio n. Ho wever, the distributio n by inco me presented values as lo w as 0 % at its lo wer limit, different fro m the distributio n by educatio n, with values aro und 3 0 % at its lo wer limit. Thus, a po sitive indicato r was cho sen, with significant dispersio n o f values aro und its median and c o nta ining va lue s with g o o d disc rimina tive po wer between sectio ns, pro vided these were not outliers, as in the case of maximum education. A fte r d ivid ing the a re a into fo ur ho mo geneo us regio ns acco rding to maximum inco me, we defined the subdivisio ns o n the map o f the UN IFESP HCC co verage area (Figure 2 ). The first reg io n (reg io n I), least affluent, with larger pro po rtio ns o f pro viders witho ut educatio n and with minimum inco me had a pattern o f diffuse g eo g ra phic a l distrib utio n, g a thering to gether the sectio ns where the Mário Cardim, Jo sé Maria W hitaker (no lo nger in existence) and O nze de Junho slums were lo cated, as well as o ther sectio ns, mainly mo re distant fro m the EPM and the UN IFESP HCC.
The seco nd regio n (regio n II) is lo cated clo se to reg io n I and has a similarly diffuse distributio n pattern.
The third re g io n (re g io n III) is ve ry co ncentrated aro und EPM, clo se to the UN IFESP HCC, and jo ins with census sectio ns lo cated predo minantly in the Vila Clementino district.
The fo urth regio n (regio n IV), with larger p ro p o rtio ns o f ma ximum e d uc a tio n a nd maximum inco me, is co ncentrated clo se to Av. Se na Ma d ure ira , w he re the b e st d w e lling co nditio ns are lo cated. The N eide So lito slum is a lso lo c a te d in this re g io n a nd the b e st explanatio n fo r this fact is that census data fro m apartment blo cks aro und the slum cause the c ha ra c te riz a tio n o f tha t se c tio n a s hig h educatio nal and inco me level. The N eide So lito slum is in fact mo re o rganized in relatio n to o ther slums; it has ho uses built with co ncrete, electric po wer, water supply and availability o f sewers, c e rta inly no t pre se nting so c io de mo g ra phic
Graph 7 - Distribution of the principal causes of death in the first homogeneous regions. UNIFESP/EPM Healthcare Center coverage area, 1996.
Graph 8 - Distribution of the principal causes of death in the second homogeneous region. UNIFESP/EPM Healthcare Center coverage area, 1996.
Graph 9 - Distribution of the principal causes of death in the third homogeneous region. UNIFESP/EPM Healthcare Center coverage area, 1996.
indicato rs like tho se o f o ther slums in the area belo nging to the ho mo geneo us regio n I.
Health and disease are co mplex co ncepts that invo lve no t o nly physical but also mental a nd so c ia l3 w e ll-b e ing ; thus the re ma y b e difficulties in measuring disease. Mo rbidity is a generic term used for designating groups of cases o f a given disease, hazards o r the sum o f health pro blems that invo lve a gro up o f peo ple.4 If o n the o ne hand mo rbidity tends to be the best indicato r fo r evaluating a po pulatio n’s health c o nd itio ns (b ring ing d ire c t info rma tio n o n d ise a se s w itho ut the e xa mine r’ s4 p e rso na l co nclusio ns), o n the o ther hand, great limitatio ns impeded its use in this study. The so urces fo r mo rb idity me a sure me nts a re ro utine he a lth servic e reg istra tio ns (g iving info rma tio n o n a tte nda nc e re q uire me nts, se rvic e usa g e o r c linic a l e xa m re sults), surve illa nc e syste m registratio ns and disease no tificatio ns,3 and the po pulatio n’s enquiries abo ut health pro blems.
Besides its high cost due to the involvement o f qualified health pro fessio nals, an enquiry that takes into acco unt diagno stic co mplexity and types o f health hazards can have its validity co mpro mised by co mmunicatio n deficiencies, o missio ns o r inaccuracies in disease diagno sis (especially fo r chro nic diseases, which may be difficult to co nfirm o n a single visit, like arterial hypertensio n and diabetes melitus).3
Sample variatio n and the co verage o f the po pulatio n are o ther facto rs that place the use o f mo rbidity at a disadvantage, bo th in primary data co llectio n fo r studies and in research o f seco ndary data thro ug h ro utine reg istratio ns, since the demand fo r the UN IFESP HCC canno t be characterized as a rando m sample o f the sick po pulatio n: the po pulatio n o f the nearest sectio ns has easiest access; the po pulatio n o f sectio ns with b etter ec o no mic levels pro b a b ly seeks private clinics o r the facilities o f health insurance schemes, avo iding public services.
Ano ther impo rtant issue that hinders the re a l re p re se nta tio n o f mo rb id ity is tha t relatio nships between need, demand and o ffer have multiple combinations and the interpretation o f the results o f mo rbidity studies depends o n data collection being population-based, on health service demand registratio n, o r o n clinical results registratio n.3
Histo ric a lly, mo rta lity w a s the first indicato r used in evaluating co llective health. The greatest limitatio n o n this indicato r is that it do es no t give a glo bal visio n o f the po pulatio n’s health co nditio ns. As death represents the last event in the health-disease pro cess, the mo rtality statistics re fle c t a n inc o mple te pic ture o f the he a lth situatio n.3 In spite o f this limitatio n, mo rtality data are still used mo re frequently than o ther so urces o f data to day. This can be explained by the o bligatio n o f death registratio n, attributing go o d co verage and representativity to the data.3 The reliability o f the info rmatio n is reinfo rced by the PRO -AIM, a pro g ram that no t o nly mo nito rs mo rtality data, but also requires quality data, returning to the physician erro neo usly filled-o ut death declaratio ns and/ o r tho se in which there remain do ubts abo ut the causes o f death, which might have arisen fro m previo us co nditio ns, such as AIDS, pregnancy o r childbirth.
Co nsidering that death data may help in und e rsta nd ing lo c a l situa tio ns a nd c o nseq uently in a iding the dec isio n-ma king pro cess reg arding measures to be applied fo r the benefit o f the po pulatio n, the mo rtality pro file o f the po pulatio n o f the HCC co verag e area was investigated. The results strikingly indicated
a g rea t numb er o f dea ths in the first a rea , g enerated by infectio ns that co uld have been p re ve nte d o r tre a te d e a rlie r, suc h a s tub e rc ulo sis, p ne umo nia a nd he p a titis, sug g esting either a lack o f early health care, perhaps o n acco unt o f access difficulties, o r lack o f q ua lity in he a lth se rvic e s. A re the re a lterna tive sta nc es reg a rding risk situa tio ns g enerating these health haz ards? Are there a lte rna tive c o nc e p ts a nd p e rc e p tio ns co ncerning the health-disease pro cess? These are impo rtant discussio n to pics pro po sed fo r further study after a mo re pro fo und investigatio n o f the po pulatio n under the respo nsibility o f the UN IFESP HCC.
CONCLUSION
The present study o ffered the o ppo rtunity to describe in detail the UNIFESP HCC co verage area. It can be co ncluded that, even tho ugh it is a privileged area, when submitted to inco me d istrib utio n a na lysis, ine q ua litie s c a n b e o bserved and they are reflected in the mo rtality data, the final event of the health-disease process. The d e line a tio n o f the a re a into sma lle r, ho mo geneo us regio ns makes it po ssible to adapt and prio ritize the HCC’s actio ns, so as to attempt to mo dify the health-disease pro cess, aiming at the primary preventio n o f health hazards.
REFERENCES
1. Ramo s LR, Go ihman S. Geo graphical stratificatio n by so cio eco -no mic status: metho do lo gy fro m a ho useho ld survey with elderly peo ple in São Paulo , Brazil. Rev Saúde Públ 1989;23:478-92. 2. Bussab WO, Dini NP. Pesquisa de emprego e desemprego SEADE/
DIEESE: regiõ es ho mo gêneas da Grande São Paulo . Rev Fund SEADE 1985;1(3):5-11.
3. Pereira GP. Epidemio lo gia: teo ria e prática. Rio de Janeiro : Edito ra Guanabara Ko o gan; 1995.
4. Laurenti R, et al. Estatísticas de saúde. São Paulo : Edito ra EPU; 1985.
Fro m Centro de Saúde Esco la, Departamento de Medicina Preventiva,Universidade Federal de São Paulo / Esco la Paulista de Medicina, São Paulo , Brazil
RESUMO
O bjetivo: Delimitar regiõ es ho mo gêneas na área de abrangência do Centro de Saúde-Esco la-EPM/ UNIFESP (CSE) co m base
em indicado res so cio demo gráfico s, bem co mo relacio ná-lo s às causas de mo rtalidade de 1 9 9 5 .
Tipo de estudo: Análise de dado s secundário s.
Loca liza çã o: Área de abrangência do CSE; atenção primária.
Va riá veis estuda da s: Populacionais: proporções de crianças e idosos; chefes de família: instrução (máxima: >1 5 anos;
mínima: <1 ano) e renda (máxima: > 2 0 salários mínimos; mínima: <1 salário mínimo). Distribuição de mortalidade proporcional
Resulta dos: A renda máxima permitiu a co nstrução de quatro regiõ es ho mo gêneas, de aco rdo co m sua escala po r po sto s.
Embo ra a pro po rção de crianças e ido so s não tenha variado significantemente entre as regiõ es, a renda e instrução mínimas apresentaram uma diferença estatisticamente significante (p<0 ,0 5 ) entre a primeira região (meno s favo recida) e as demais. G radiente crescente fo i igualmente o bservado (instrução mínima). A mo rtalidade também diferiu na primeira região , co m ó bito s po r causas preveníveis.
Conclusões: As desigualdades o bservadas po dem co ntribuir para a prevenção primária da saúde.
Authors
Ka rina Yuri Ha ra da - Medical student.
Julieta Gonça lves Silva - Medical student.
Sim one Schenk m a n - Do cto r, MSc in epidemio lo gy,
superviso r o f residency in preventive and so cial medicine.
Elia na Tiem i Ha y a m a - Psycho lo gist.
Fra ncisco Roberto Gonça lves Sa ntos - Assistant
pro fesso r and head o f discipline.
M a riâ ngela Ca inelli de O liveira Pra do - Assistant
pro fesso r and PhD fro m FSP/ USP.
Regina Helena Petroni Pontes - Educato r in public
health and PhD fro m FSP/ USP.
Sources of Funding: No t declared
Conflict of interest: No t declared
La st received: 2 1 May 1 9 9 8
Accepted: 3 0 July 1 9 9 8
Address for correspondence:
Karina Yuri Harada - A/ C Dra. Simo ne Schenkman Disc.Epidemio lo gia, Deptto . de Medicina Preventiva Rua Pedro de To ledo , 6 7 5