Article/Artigo
1. Departamento de Medicina Social, Faculdade de Medicina de Ribeirão Preto, Universidade de São Paulo, Ribeirão Preto, SP. 2. Centro de Métodos Quantitativos, Faculdade de Medicina de Ribeirão Preto, Universidade de São Paulo, Ribeirão Preto, SP.
Address to: Dr. Edson Zangiacomi Martinez. Depto Medicina Social/FMRP/USP. Av. Bandeirantes 3.900, 14049-900 Ribeirão Preto, SP, Brasil.
Phone: 55 16 3602-2569 e-mail: [email protected] Received in 29/06/2010 Accepted in 22/02/2011
A SARIMA forecasting model to predict the number of cases of dengue
in Campinas, State of
São Paulo
, Brazil
Um modelo SARIMA para predição do número de casos de dengue em Campinas,
Estado de São Paulo
Edson Zangiacomi Martinez
1, Elisângela Aparecida Soares da Silva
2and Amaury Lelis Dal Fabbro
1ABSTACT
Introduction: Forecasting dengue cases in a population by using time-series models can provide useful information that can be used to facilitate the planning of public health interventions. he objective of this article was to develop a forecasting model for dengue incidence in Campinas, southeast Brazil, considering the Box-Jenkins modeling approach.
Methods: he forecasting model for dengue incidence was performed with R sotware using the seasonal autoregressive integrated moving average (SARIMA) model. We ited a model based on the reported monthly incidence of dengue from 1998 to 2008, and we validated the model using the data collected between January and December of 2009. Results: SARIMA (2,1,2) (1,1,1)12 was the model with the best it for data. his model indicated that the number of dengue cases in a given month can be estimated by the number of dengue cases occurring one, two and twelve months prior. he predicted values for 2009 are relatively close to the observed values. Conclusions: he results of this article indicate that SARIMA models are useful tools for monitoring dengue incidence. We also observe that the SARIMA model is capable of representing with relative precision the number of cases in a next year.
Keywords: Dengue. SARIMA. Time series analysis. Statistics.
RESUMO
Introdução: A predição do número de casos de dengue em uma população utilizando modelos de series temporais pode trazer informações úteis para um melhor planejamento de intervenções públicas de saúde. O objetivo deste artigo é desenvolver um modelo capaz de descrever e predizer a incidência de dengue em Campinas, sudeste do Brasil, considerando a metodologia de Box e Jenkins. Métodos: O modelo seasonal autoregressive integrated moving average (SARIMA) para os dados de incidência de dengue em Campinas, foi implementado no programa R. Ajustamos um modelo baseado na incidência mensal notiicada da doença de 1998 a 2008 e validado pelos dados de janeiro a dezembro de 2009. Resultados: O modelo SARIMA (2,1,2) (1,1,1)12 foi o mais adequado aos dados. Este modelo indicou que o número
de casos de dengue em um dado mês pode ser estimado pelo número de casos ocorridos há um, dois e doze meses. Os valores preditos para 2009 são relativamente próximos aos valores observados. Conclusões: Os resultados deste artigo indicam que os modelos SARIMA são ferramentas úteis para o monitoramento da incidência da dengue. Observamos ainda que o modelo SARIMA é capaz de representar com relativa precisão o número de casos de dengue em um ano consecutivo à série de dados usada no ajuste do modelo.
Palavras-chaves: Dengue. SARIMA. Análise de séries temporais. Estatística.
INTRODUCTION
Dengue is a disease of great importance for public health in tropical and sub-tropical areas of the world. he disease is transmited by the bites of infected
Aedes mosquitoes, and its symptoms, which include headache and muscle and joint pain, are very similar to those of fever-causing illnesses. It is estimated that between 50 and 100 million cases of dengue fever occur each year1,2,and about two-thirds of the
world's population live in areas infested with dengue vectors3. In the irst decade of the 21st century, Brazil
ranked among the countries with the highest dengue incidence in the world4. In Brazil, more than three
million cases were reported from 2000 to 2005, comprising approximately 70% of reported dengue fever cases in the Americas5.
Dengue can be caused by any of the four serotypes of dengue virus, designated DEN-1, DEN-2, DEN-3, and DEN-4. In Brazil, the first laboratory-conirmed dengue outbreak was reported in 1981-1982 in the State of Roraima6, and no further
dengue activity was reported until 1986 with the introduction of DEN-1 in the State of Rio de Janeiro7.
The DEN-2 serotype was introduced in 1990 in Rio de Janeiro during a period of DEN-1 serotype circulation8. In the following years, the DEN-2
serotype spread to other Brazilian regions, with more severe clinical presentations9. In 1994, DEN-3 virus
was reintroduced in the Americas ater an absence of 16 years, and in 2000, it was introduced in Rio de Janeiro, causing a large epidemic of dengue fever10,11.
he irst report of DEN-4 in Brazil was in the State of Roraima in 198212.
Mathematical and statistical models can provide substantial contributions to the understanding of the dynamics of dengue transmission and the trends of growth in the number of cases of the disease. Recently, statistical tools such as time series analyses13,14 have been used by several authors to
describe and forecast the number of cases of dengue in speciic populations15-19. Among these models, the
Martinez EZ et al - Forecasting the number of cases of dengue in Campinas
METHODS
RESULTS
(SARIMA) model is useful in situations when the time series data exhibit seasonality-periodic luctuations that recur with about the same intensity each year. his characteristic makes the SARIMA model adequate for studies concerning monthly dengue data, given that the number of dengue cases in a population tends to be subject to seasonal variations, with a maximum in the rainy season and a minimum during the dry season.
he objective of this study was to develop time series models to forecast the monthly dengue incidence in Campinas, a city located in the State of São Paulo, Brazil, on the basis of reported incidence rates available from 1998 to 2008; these models were then validated using the data collected between January and December of 2009. Forecasting dengue cases in a population using time-series models can provide useful information that can be used to facilitate the planning of public health interventions.
Campinas is a city of nearly one million inhabitants and is located in the southeastern part of Brazil, in the State of São Paulo. Campinas is 100km from the City of São Paulo, which is the state capital and the largest metropolitan area in Brazil. The economic and demographic growth in the last decades has transformed the city into an important industrial and commercial center. The city has an international airport, several universities and an extensive public health network. According to the 2000 Brazilian Demographic Census (IBGE Foundation), Campinas has a Gini index of relative inequality of 42% and a poverty incidence of 9.8%. In Campinas, dengue transmission was identified for the first time in 199620.
he monthly number of conirmed cases of dengue in Campinas was obtained from the Municipal Health Secretary of Campinas (available in htp://2009.campinas.sp.gov.br/saude/). he dataset was divided into two parts: the data observed from January 1998 to December 2008, which were used to develop the time series model, and the monthly number of dengue cases during the year 2009, which was used to validate the model.
Let Y´ = (Y1, Y2, …,Yn) be a time series of data. A seasonal ARIMA
model13,14,21,22 (SARIMA) with S observations per period, denoted by
SARIMA(p,d,q)(P,D,Q)S, is given by Φ(LS)φ(L) (1 – L)d (1 – LS)
DY
t = Θ(L
S) θ(L) ε
t , where L is the lag operator given by L
k = Y
t – k/
Yt, φ(L) = 1 – φ1 L1 – φ 2 L
2 – ….– φ
pL
p is an autoregressive (AR)
polynomial function of order p with vector of coeicients φ´ = (φ1, φ2,…, φp), θ(L) = 1 + θ1L1 + θ
2L
2 + … + θ
q L
q isa moving average
(MA) polynomial of order q with vector of coeicients θ´ = (θ1,
θ2,…, θq), Φ(LS) = 1 – φ
S,1 L
S – φ
S,2 L
2S – ….– φ
S,PL
PS and Θ(LS) = 1
+ θ S,1L
S + θ
S,2L
2S + … + θ
S,Q L
QS are seasonal polynomial functions
of order P and Q, respectively, that satisfy the stationarity and invertibility conditions, d is the number of diferencing passes needed to stationarize the series, D is the number of seasonal diferences and
εt are error terms assumed to be independent identically distributed
random variables sampled from a distribution with a mean equal to zero and the variance σ2
ε. In time series analyses, the variables εt are
commonly referred to as white noises, and they are interpreted as an exogenous efect that the model is not able to explain. Considering the time series of monthly dengue incidence, this white noise can be, for example, an efect of climatic variables, eventual campaigns
of prevention and education, the introduction/reintroduction of a dengue serotype in a susceptible population or random factors.
hus, in the present article, we used the statistical sotware R23
to it SARIMA models to dengue incidence from 1998 to 2008 in Campinas using the Box-Jenkins modeling approach24. he adequacy
of the each model was veriied by plots of the histogram and an autocorrelation (ACF) of the standardized residuals and the Ljung-Box test25, which is a test for hypotheses of no correlation across a
speciied number of time lags. ACF of the residuals and Ljung-Box statistics are useful for testing the randomness of the residuals. he Akaike information criterion (AIC)26was employed to compare
the goodness-of-it of diferent models. Lower AIC values indicate beter it.
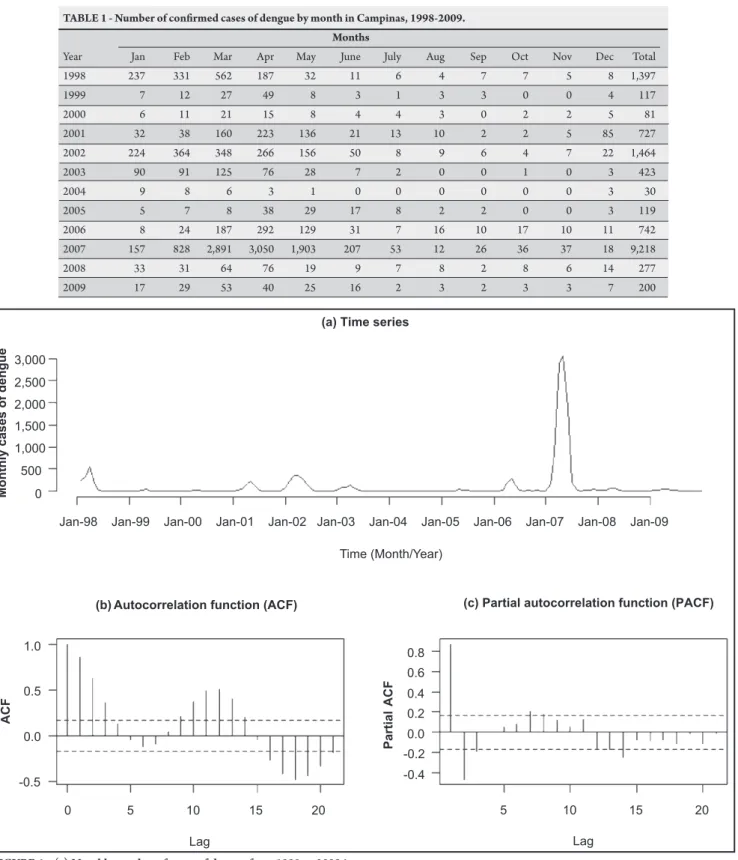
Table 1 and panel (a) of Figure 1 show the monthly number of dengue cases in Campinas between 1998 and 2009. Observing the graph in panel (a) of Figure 1, we note a peak in the dengue incidence in 1998, followed by two non-epidemic years. In 2001 and 2002, there were two yearly peaks, followed by one small yearly peak and two non-epidemic years (2004 and 2005). he large number of cases observed in 2001 and 2002 coincides with the introduction of dengue virus serotype 3 (DEN-3). his virus serotype was introduced in 2000 5,27,
and it led to a large and severe epidemic of the disease in Brazil28, with
more than 1.2 million cases reported in 2001 and 2002 in addition to the circulation of DEN-1 and DEN-2. A relatively large number of cases of dengue was observed in Campinas in 2007 (9,218 cases), again followed by two non-epidemic years (2008 and 2009). Considering the time series in Table 1, March and April are of particular interest, because these are the months with the highest number of dengue cases.
We generated logarithms of the data exhibited in Table 1 to induce constant variance. hus, Y´ = (Y1, Y2, …, Yn) is the vector of
the natural logarithms of the monthly number of cases of dengue from 2000 to 2008, in which we added 1 to deal with the logarithm of zero values in cases of non-occurrence of dengue in a given month. Considering a plot of the series Y1, Y2, …,Yn against time (not shown here), we note that there is still some trend, but we should be able to obtain a more stationary series from irst diferencing. hus, we consider d = 1.
Panels (b) and (c) of Figure 1 show graphs of the estimated auto correlation function (ACF) and partial auto correlation function (PACF) of the transformed series using data from 1998 to 2008. he ACF of the logarithmically transformed series exhibits periodicity of length S = 12. his result was expected, because the dengue incidence shows a seasonal cycle. he PACF suggests that p should be equal to 2, given that partial autocorrelations are near to zero at all lags that exceed 2, and the ACF suggests a moving-average of order q equal to 2 or 3, given that its autocovariances are close to zero at lags that exceed 3.
Table 2 shows values of AIC and the estimates for the variance
σ2
ε for the SARIMA models ited to the monthly number of cases
of dengue from 2000 to2008, considering diferent choices of p and
TABLE 1 - Number of conirmed cases of dengue by month in Campinas, 1998-2009. Months
Year Jan Feb Mar Apr May June July Aug Sep Oct Nov Dec Total
1998 237 331 562 187 32 11 6 4 7 7 5 8 1,397
1999 7 12 27 49 8 3 1 3 3 0 0 4 117
2000 6 11 21 15 8 4 4 3 0 2 2 5 81
2001 32 38 160 223 136 21 13 10 2 2 5 85 727
2002 224 364 348 266 156 50 8 9 6 4 7 22 1,464
2003 90 91 125 76 28 7 2 0 0 1 0 3 423
2004 9 8 6 3 1 0 0 0 0 0 0 3 30
2005 5 7 8 38 29 17 8 2 2 0 0 3 119
2006 8 24 187 292 129 31 7 16 10 17 10 11 742
2007 157 828 2,891 3,050 1,903 207 53 12 26 36 37 18 9,218
2008 33 31 64 76 19 9 7 8 2 8 6 14 277
2009 17 29 53 40 25 16 2 3 2 3 3 7 200
TABLE 2 - Akaike information criterion values considering diferent SARIMA (p,1,q)(1,1,1)12 models and estimates for σ2
ε.
Model AIC value Estimate for σ2
ε
(2,1,2)(1,1,1)12 269.08 0.4139
(2,1,1)(1,1,1)12 275.60 0.4193
(1,1,2)(1,1,1)12 276.27 0.4227
(1,1,1)(1,1,1)12 277.13 0.4344
(2,1,3)(1,1,1)12 273.52 0.3918
(1,1,3)(1,1,1)12 276.91 0.4174
SARIMA: seasonal autoregressive integrated moving average, AIC: Akaike information criterion.
FIGURE 1 - (a) Monthly number of cases of dengue from 1998 to 2009 in Campinas, Southeast Brazil (Source: http://2009.campinas.sp.gov.br/ saude/). Autocorrelation (b) and partial autocorrelation (c) functions calculated using the log-transformed number of cases of dengue from 1998 to 2008 in Campinas. he dashed horizontal lines are 95% conidence limits assuming a white noise input.
3,000
2,500
2,000
1,500
1,000
500
0
1.0
0.5
0.0
-0.5
Lag Lag
Partial
ACF
0.8
5 10 15 20 0.6
0.4 0.2
0.0 -0.2
-0.4
0 5 10 15 20
Time (Month/Year)
(b) Autocorrelation function (ACF) (c) Partial autocorrelation function (PACF)
ACF
Jan-98 Jan-99 Jan-00 Jan-01 Jan-02 Jan-03 Jan-04 Jan-05 Jan-06 Jan-07 Jan-08 Jan-09
Monthly cases of dengue
(a) Time series
the autoregressive parameters φ1 and φ2were estimated to be 1.62 (standard error, SE, 0.01) and -0.99 (SE 0.02), respectively, and the moving-average parameters θ1 and θ2were estimated to be -1.66 (SE 0.04) and 1.00 (SE 0.04), respectively. he seasonal components
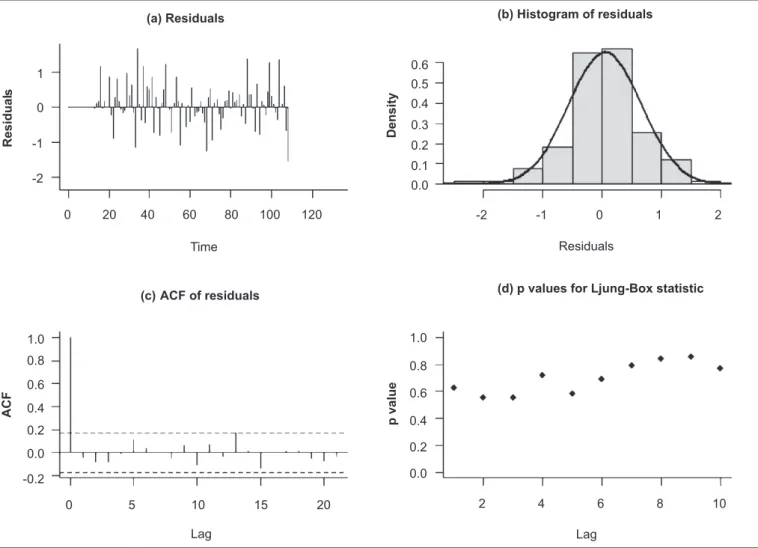
After estimating the parameters of this model, we assessed their adequacy by analyzing their residuals. Figure 2 shows the standardized residuals, their histogram, the respective ACF graph and
p-values for the Ljung-Box statistic. Panel (a) of Figure 2 suggests that the standardized residuals estimated from this model should behave as an independent and identically distributed sequence with a mean of zero and a constant variance. he histogram in panel (b) of
Figure 2 shows that the standardized residuals for the model approximated a normal distribution. In addition, the Kolmogorov-Smirnov test gives no reason to reject the assumption that the distribution of residuals is normal (p-value 0.21). he ACF of the residuals showed in Panel (c) suggests that the autocorrelations are
close to zero. his result means that the residuals did not deviate significantly from a zero mean white noise process. Panel (d) shows p-values for the Ljung-Box statistic. Given the high p-values associated with the statistics, we cannot reject the null hypothesis of independence in this residual series. hus, we can say that the SARIMA (2,1,2)(1,1,1)12 model its the data well.
Out-of-sample predicted values for 2009 considering the SARIMA (2,1,2)(1,1,1)12 model are shown in Table 3, where we compare these values with the observed number of dengue cases. he predicted values are relatively close to the observed values; this result indicates that the model provides an acceptable it to predict the number of dengue cases.
1
1.0 1.0
0.8 0.8
0.6
0.6 0.4
0.4 0.2
0.2 0.0
0.0 -0.2
0.6 0.5 0.4
0.3 0.2 0.1 0.0
-2 -1 0 1 2
Time
Lag Lag
2 4 6 8 10 Residuals
(d) p values for Ljung-Box statistic (a) Residuals
(c) ACF of residuals
(b) Histogram of residuals
Residual
s
ACF
p value
Density
0
0 20 40 60 80 100 120 -1
-2
0 5 10 15 20
FIGURE 2 - Graphical diagnostics for assessing the SARIMA (2,1,2)(1,1,1)12 model it: (a) the standardized residuals, (b) histogram of the standardized residuals, (c) the respective ACF graph and (d) p-values for the Ljung-Box statistic. SARIMA: seasonal autoregressive integrated moving average, ACF: autocorrelation functions.
TABLE 3 -Observed number of dengue cases in 2009 in Campinas, and the respective out-of-sample predicted values obtained from the SARIMA (2,1,2)(1,1,1)12 model.
Months
Year Jan Feb Mar Apr May June July Aug Sep Oct Nov Dec Total
Observed 17 29 53 40 25 16 2 3 2 3 3 7 200
Predicted 36.1 47.1 77.6 74.3 33.1 12.1 7.0 6.5 5.8 6.4 5.2 9.8 320.9
he authors declare that there is no conlict of interest.
CONFLICT OF INTEREST
FINANCIAL SUPPORT
REFERENCES DISCUSSION
In this study, the SARIMA (2,1,2)(1,1,1)12 model well relected the trend in the incidence of dengue in Campinas. We showed that the number of dengue cases in a given month can be estimated by the number of dengue cases occurring 1, 2 (p = 2) and 12 (S = 12 and
p = 1) months prior, and we found that a moving-average component of order q equal to 2 is adequate for the data. he highest peaks from the time series observed in Figure 1, panel (a), can be a direct consequence of the introduction or reintroduction of diferent serotypes, but we noted that the SARIMA model produced good estimates for each month, even though the time series contains periods with relatively large numbers of dengue cases. his result suggests that the model its the data adequately, despite the introduction and reintroduction of diferent viral serotypes within the studied period.
When we used this model to produce out-of-sample predictions of the number of dengue cases in Campinas, we observed that the SARIMA model was capable of representing the number of cases in a subsequent year with relative precision. However, these predictions may not be credible for forecasting the number of dengue cases in epidemic years, when the observed monthly incidence is signiicantly higher than the expected number of new cases for that period. his large number of cases may be a consequence of the lack of immunity in the population, because many people in these circumstances are exposed to a dengue viral serotype for the irst time.
hese results indicate that statistical time series models should lead to a beter understanding of the disease mechanismand that they can assist in the planning of public health programs and interventions. In addition, considering the potential impacts of climate changes on dengue transmission, more accurate predictions could be made by introducing meteorological variables such as temperature, pressure, humidity and rainfall into the model, and these variables should be taken into account in a future study. hese variables are known to be associated with an increase in the number of available breeding places for Aedes aegypti, and with that, the risks for transmission for dengue.
his work was supported by FAEPA (Fundação de Apoio, Ensino, Pesquisa e Assistência, Hospital das Clínicas, Faculdade de Medicina de Ribeirão Preto, Universidade de São Paulo). E.Z.M. had investigator grants from CNPq.
1. Gubler DJ. Epidemic dengue/dengue hemorrhagic fever as a public health, social and economic problem in the 21st century. Trends Microbiol 2002; 10:100-103. 2. Guzman MG, Kouri G. Dengue and dengue hemorrhagic fever in the Americas:
lessons and challenges. J Clin Virol 2003; 27:1-13.
3. Pinheiro FP, Corber SJ. Global situation of dengue and dengue haemorrhagic fever, and its emergence in the Americas. World Health Stat Q 1997; 50:161-169. 4. Teixeira MG, Costa MC, Barreto F, Barreto ML. Dengue: twenty-ive years since
reemergence in Brazil. Cad Saude Publica 2009; 25 (supl 1):7-18.
5. Siqueira Jr JB, Martelli CM, Coelho GE, Simplicio AC, Hatch DL. Dengue and dengue hemorrhagic fever, Brazil, 1981-2002. Emerg Infect Dis 2005; 11:48-53. 6. Osanai CH, Travassos da Rosa AP, Tang AT, Amaral AS, Passos AD, Tauil PL. Outbreak of dengue in Boa Vista, Roraima. Preliminary report. Rev Inst Med Trop 1983; 25:53-54.
7. Schatzmayr HG, Nogueira RM, Travassos da Rosa AP. An outbreak of dengue virus at Rio de Janeiro. Mem Inst Oswaldo Cruz 1986; 81:245-246.
8. Nogueira RM, Miagostovich MP, Lampe E, Souza RW, Zagne SMO, Schatzmayr HG. Dengue epidemic in the state of Rio de Janeiro, Brazil, 1990-1: co-circulation of dengue 1 and dengue 2 serotypes. Epidemiol Infect 1993; 111:163-170. 9. Costa Vasconcelos PF, Menezes DB, Melo LP, Pessoa P, Rodrigues SG, Travassos
da Rosa E, et al. A large epidemic of dengue fever with dengue hemorrhagic cases in Ceará State, Brazil, 1994. Rev Inst Med Trop Sao Paulo 1995; 37:253-255. 10. Figueroa R, Ramos C. Dengue virus serotype 3 circulation in endemic countries
and its reappearance in America. Arch Med Res 2000; 31:429-430.
11. Nogueira RM, Schatzmayr HG, Filippis AM, Santos FB, Cunha RV, Coelho JO, et al. Dengue virus type 3, Brazil, 2002. Emerg Infect Dis 2005; 11:1376-1381. 12. Figueiredo RM, Naveca FG, Bastos MS, Melo MN, Viana SS, Mourão MP, et al.
Dengue virus type 4, Manaus, Brazil. Emerg Infect Dis 2008; 14:667-669. 13. Hamilton JD. Time series analysis. Princeton: Princeton University Press; 1994. 14. Tsay RS. Analysis of inancial time series. 2nd edition. New York: John Wiley &
Sons; 2005.
15. Luz PM, Mendes BV, Codeço CT, Struchiner CJ, Galvani AP. Time series analysis of dengue incidence in Rio de Janeiro, Brazil. Am J Trop Med Hyg 2008;79:933-939.
16. Promprou S, Jaroensutasinee M, Jaroensutasinee K. Forecasting dengue haemorrhagic fever cases in Southern hailand using ARIMA Models. Dengue Bull 2006; 30:99-106.
17. Wongkoon S, Pollar M, Jaroensutasinee M, Jaroensutasinee K. Predicting DHF incidence in Northern hailand using time series analysis technique. Proc World Acad Sci Eng Technol 2007; 26:216-220.
18. Silawan T, Singhasivanon P, Kaewkungwal J, Nimmanitya S, Suwonkerd W. Temporal paterns and forecast of dengue infection in Northeastern hailand. Southeast Asian J Trop Med Public Health 2008; 39:90-98.
19. Choudhury MAHZ, Banu S, Islam MA. Forecasting dengue incidence in Dhaka, Bangladesh: A time series analysis. Dengue Bull 2008; 32:99-106.
20. Lima VL, Rangel O, Andrade VR, Silveira NY, Oliveira SS, Figueiredo LT. Dengue: sero-epidemiological survey and virological surveillance in Campinas, São Paulo, Brazil. Cad Saude Publica 2007; 23:669-680.
21. Enders W. Applied econometric time series. 3rd edition. New York: Wiley; 2009. 22. Latorre MRDO, Cardoso MRA. Time series analysis in epidemiology: an introduction to methodological aspects. Rev Bras Epidemiol 2001; 4:145-152. 23. Ihaka R, Gentleman R. R: A language for data analysis and graphics. J Comput
Graph Statist 1996; 5:299-314.
24. Box G, Jenkins G. Time series analysis: Forecasting and control. 4th ed. New York: John Wiley & Sons; 2008.
25. Ljung GM, Box GEP. On a measure of lack of it in time series models. Biometrika 1978; 65:297-303.
26. Burnham KP, Anderson DR. Model selection and multimodel inference: a practical information-theoretic approach. 2nd ed. New York: Springer; 2002. 27. Nogueira RM, Araújo JM, Schatzmayr HG. Dengue viruses in Brazil, 1986-2006.
Rev Panam Salud Publica 2007; 22:358-363.