ABSTRACT The aim was to analyze clinical performance through the application of Hospital Standardized Mortality Ratio (HSMR) and its variation according to admissions payment sources and hospitals financing arrangements. Secondary data was used and diagnoses that account for 80% of hospital deaths were analyzed, adjusted by patient risk. Performance ob-served was worse than expected in public and mixed-public hospitals, and in SUS (Unified Health System) hospitalizations. The relation between source of payment and HSMR may in-dicate differences in clinical practice or in the severity of cases. This methodology contributes to the monitoring of hospital quality, directing public policies and regulations.
KEYWORDS Outcome assessment (health care). Hospital mortality. Hospital administration. Health systems. Supplemental health.
RESUMO O objetivo foi analisar o desempenho clínico por meio da aplicação da Razão de Mortalidade Hospitalar Padronizada (RMHP) e sua variação segundo fonte de pagamento da internação e arranjo de financiamento do hospital. Foram utilizados dados secundários e anali-sadas as causas responsáveis por 80% dos óbitos hospitalares ajustadas por risco. Desempenho pior que o esperado foi observado em hospitais públicos e públicos mistos e em internações SUS (Sistema Único de Saúde). A relação entre fonte de pagamento e RMHP pode indicar diferenças de prática clínica ou de gravidade dos casos. A metodologia aplicada contribui para o acompan-hamento da qualidade hospitalar no País, direcionando políticas públicas e regulamentações.
PALAVRAS-CHAVE Avaliação de resultados (cuidados de saúde). Mortalidade hospitalar. Administração hospitalar. Sistemas de saúde. Saúde suplementar.
Sources of payment for hospitalization and
clinical performance: the case of hospitals in
São Paulo, Brazil
Fontes de pagamento das internações e desempenho clínico: o caso
dos hospitais do estado de São Paulo, Brasil
Juliana Pires Machado1, Mônica Martins2, Iuri da Costa Leite3
1 Agência Nacional de Saúde Suplementar (ANS), Diretoria de Desenvolvimento Setorial – Rio de Janeiro (RJ), Brasil. [email protected]
2 Fundação Oswaldo Cruz (Fiocruz), Escola Nacional de Saúde Pública Sergio Arouca (Ensp), Departamento de Administração e Planejamento em Saúde – Rio de Janeiro (RJ), Brasil. [email protected]
Introduction
Performance assessment of health systems and services has been used to guide deci-sion-making aiming at the implementation of changes and improvements in the differ-ent dimensions that compose this concept. In this area, methodologies are necessary to achieve reliable data analysis and therefore guarantee spending transparency, regulate care delivery, control care costs, deliver ef-fective, safe, adequate, and equitable care, and also reduce variations in clinical practice (CHASSIN ET AL., 2010; FUNG ET AL., 2010; MULLEY, 2009). This is a demand in the agenda of various players, including financing agents, provid-ers, professionals, and patients.
In the sphere of hospital care, studies have been demonstrating meaningful varia-tions in clinical performance associated with the public or private nature of hospitals and whether they are not-for-profit or for-profit, with advantages for the latters (BRAND ET AL., 2012; FUNG ET AL., 2010; DEVEREAUX ET AL., 2002). Disparities between these types of hospitals may occur due to differences related to the organiza-tion’s resources, the spectrum of available strategies, and the relationship with the exter-nal context, especially regarding dependency on governmental or private health insurance financing (MEDICI, 2011; LA FORGIA; COUTTOLENC, 2009). In Brazil, the possible combinations between sources of admission payment adopted by hospitals (Unified Health System – SUS, health insurance plans, and/or private-pay), named ‘financing arrangement’, are charac-terized as a structural element that may affect care outcomes (MACHADO, 2014).
Hospital mortality, a traditional indicator used to measure care outcomes, is often de-scribed in performance variations analyses, in the scientific literature and reports from inter-national agencies (BRAND ET AL., 2013; SHAHIAN ET AL., 2012; CAMPBELL ET AL., 2012). Despite the advantage of being a unique event and mandatorily reg-istered, adding accuracy to its use, and ideally
process, the relationship between mortality and quality of care are not entirely comprehended, exempt from measure errors, and applicable to many diagnoses (SHAHIAN ET AL., 2012; CIHI, 2007). In this context, there are important method-ological issues whose definition are necessary to broaden the reliability of the analyses, such as: definition of sample population, cases to be selected, risk-adjustments necessary to have a fair comparison between hospitals, and ways of interpreting variations observed between them (BRAND ET AL., 2013).
In this debate, among the methodologies proposed for the analysis of hospital mor-tality as an indirect measure of the quality of care (FUNG ET AL., 2010), the one developed by Jarman (JARMAN ET AL., 1999; JARMAN ET AL.,
2010), based on the Hospital Standardized Mortality Ratio (HSMR) was outstand-ing and has been included in monitoroutstand-ing systems of several countries (SHAHIAN ET AL., 2012). Jarman’s proposal, when analyzing the diagnoses responsible for 80% of hospital deaths, considered a ‘global’ methodology, presents the advantage of using a unique and generic measure, as the standardized general mortality coefficient. Furthermore, this approach enables the assessment of a larger amount of providers, comprising hos-pitals with varied case profiles.
Therefore, considering the international importance given to Jarman’s approach, this study aimed to analyze clinical performance by means of the application of Hospital Standardized Mortality Ratio (HSMR) and its variation according to admission source of payment and hospital financing arrangement.
Methods
Design
accumulated knowledge on the quality of data, this study is circumscribed to the state of São Paulo, in the period between 2008 and 2010. An adaptation of the methodology pro-posed by Jarman (JARMAN ET AL., 1999; JARMAN ET AL., 2010) was carried out, having HSMR as an indicator of hospital clinical performance.
Setting
The analysis comprised 426 general hos-pitals, selected for presenting at least 1,095 acute admissions, with length of stay in hos-pital up to 30 days, of adults aged between 18 and 99 years, between 2008 and 2010, with at least one death in the period. Only ad-missions whose end was discharge or death were included (excluded were continuities, transfers, and administrative discharge). The selection criteria adopted aimed at the exclusion of hospitals with low volume of admissions in the study period, because not only have studies demonstrated that hospitals with higher admissions volume tend to present better results regarding the care delivered (LUFT, 1990), but also hospitals with a small number of admissions might distort the estimates obtained. By restrict-ing the period of hospitalization, the objec-tive was to exclude the cases of long length of stay, because it jeopardizes the causal validity between process and outcome of care (DONABEDIAN, 2002), when the measure of quality used is intra-hospital mortality.
From the total of 5,784,280 admissions, those with primary diagnosis referring to non-specific groups of causes were exclud-ed, i.e., those in which the first digit of the International Classification of Diseases (ICD-10) was R, T, V, X, Y or Z. Admissions for other causes were selected, including only the causes responsible for 80% of hospital deaths, based on ICD-10 with three digits. The re-maining 2,001,522 admissions were grouped in 71 distinct diagnoses codes, in steps developed according to the methodology proposed by Jarman (JARMAN ET AL., 1999; JARMAN ET AL., 2010).
Data sources
This study has used open access data on hospitals from the databases of the National Register of Health Institutions (NRHI) (Cadastro Nacional de Estabelecimentos de Saúde – CNES). Data on private admis-sions were extracted from the Hospital Admission Register (HAR) (Comunicação de Internação Hospitalar – CIH) and data on public admissions were extracted from the Hospital Data System (HDS) (Sistema de Informações Hospitalares – SIH).
Data analyses
The analyses used the volume of admissions by sources of payment to classify hospitals according to the financing arrangement. Hospitals were categorized according to the combination of volume of admissions by source of payment – public (financed by SUS or philanthropy) and private (financed by private or public health insurance, or pri-vate-pay) – in five categories: (1) public (no private admissions); (2) mixed-public (up to 25% of private admissions); (3) mixed (25% to 75% of private admissions); (4) private-mixed (75% to 99% of private admissions); (5) private (100% of private admissions).
To measure clinical performance, the study used the HSMR, a dependent variable calculated by means of the division between the number of deaths observed and expected (Ratio O/E), and multiplying this result by 100. The number of deaths observed was calculated in function of patients’ risk factor. In the cases when HSMR was below 100, performance was considered better than ex-pected; when equal to 100, performance was equal to expected; and above 100, hospital performance was lower than expected.
base (AYLIN; BOTTLE; MAJEED, 2007). This measure indicates the probability of death risk in a randomly selected patient who died, com-pared to the probability of death risk in a ran-domly selected patient who survived. Values under 0.7 indicate poor discrimination; between 0.7 and 0.8 reasonable discrimina-tion; and above 0.8 good discrimination.
The base model, the first to be tested, com-prised the variables gender (male or female) and age (in years), which was classified in six categories: 18-49, 50-59, 60-69, 70-79, 80-89, and 90-99. Then, step by step, the variables related to patient risk were included. In model 2, the primary diagnosis with three digits was included (three digits codes ac-cording to the International Classification of Diseases – 10th edition – ICD-10); in model 3, there was the inclusion of the Charlson co-morbidity index (CI) score (SHARABIANI; AYLIN; BOTTLE, 2012; QUAN ET AL., 2005), that was created based on the secondary diagnosis data, clas-sified in three categories: 0, 1, and ≥ 2; in model 4, there was the inclusion of the oc-currence of other morbidity not included in the CI; and in model 5, there was the inclu-sion of the length of stay (in days) classified in seven categories: 1, 2-5, 6-10, 11-15, 16-20, 21-25, 26-30. Thus, the latter, adopted as final model, was composed of the following variables: gender, age group, primary diag-nosis, CI score, occurrence of other morbid-ity not included in the CI, and length of stay. These variables were selected based on the literature on the theme (CAMPBELL ET AL., 2012; SHARABIANI; AYLIN; BOTTLE, 2012; AYLIN; BOTTLE; MAJEED, 2007) and their availability in the databases used in the study. Among those widely used in similar studies, only the type of admission (emergency/elective) could not be used for not being available at HAR.
The analyses were carried out by using the
Statistical Package for the Social Sciences (SPSS).
The study was approved by the Research Ethics Committee of Sergio Arouca National School of Public Health/Oswaldo Cruz Foundation (Ensp/Fiocruz) (Certificate of Submission for Ethics Report nr 02234312.3.0000.5240; Report number 78617, of August 23rd, 2012).
Results
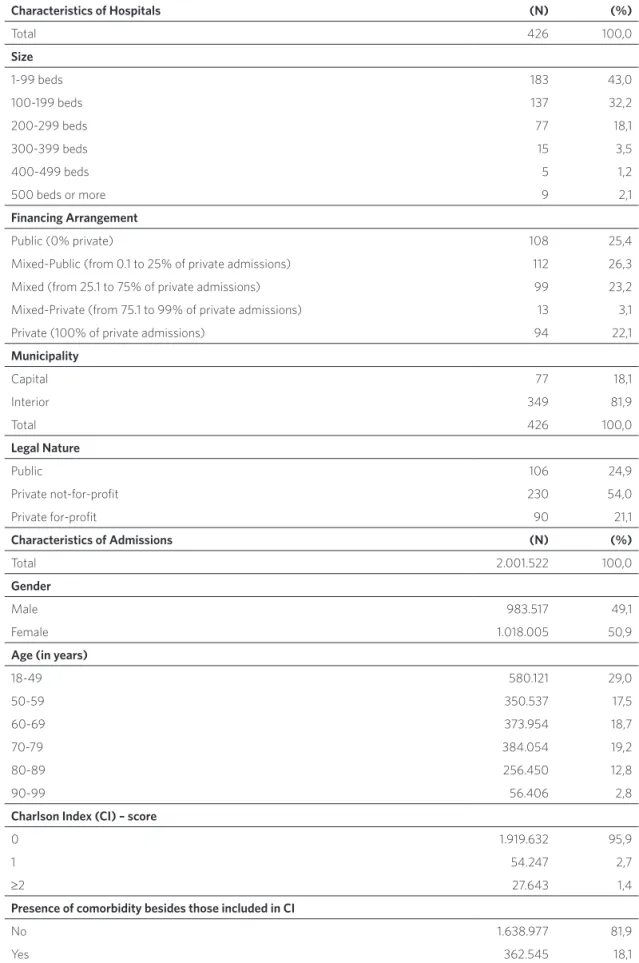
Table 1. Characteristics of hospitals and admissions – São Paulo, 2008 to 2010
Characteristics of Hospitals (N) (%)
Total 426 100,0
Size
1-99 beds 183 43,0
100-199 beds 137 32,2
200-299 beds 77 18,1
300-399 beds 15 3,5
400-499 beds 5 1,2
500 beds or more 9 2,1
Financing Arrangement
Public (0% private) 108 25,4
Mixed-Public (from 0.1 to 25% of private admissions) 112 26,3
Mixed (from 25.1 to 75% of private admissions) 99 23,2
Mixed-Private (from 75.1 to 99% of private admissions) 13 3,1
Private (100% of private admissions) 94 22,1
Municipality
Capital 77 18,1
Interior 349 81,9
Total 426 100,0
Legal Nature
Public 106 24,9
Private not-for-profit 230 54,0
Private for-profit 90 21,1
Characteristics of Admissions (N) (%)
Total 2.001.522 100,0
Gender
Male 983.517 49,1
Female 1.018.005 50,9
Age (in years)
18-49 580.121 29,0
50-59 350.537 17,5
60-69 373.954 18,7
70-79 384.054 19,2
80-89 256.450 12,8
90-99 56.406 2,8
Charlson Index (CI) – score
0 1.919.632 95,9
1 54.247 2,7
≥2 27.643 1,4
Presence of comorbidity besides those included in CI
No 1.638.977 81,9
Source: Cadastro Nacional de Estabelecimentos de Saúde (CNES), Sistema de Informações Hospitalares (SIH) of SUS and Comunicação de Internação Hospitalar (CIH).
Length of Stay (in days)
1 359.830 18,0
2-5 974.744 48,7
6-10 400.189 20,0
11-15 145.826 7,3
16-20 64.944 3,2
21-25 35.083 1,8
26-30 20.906 1,0
Primary Diagnosis
J18 – Pneumonia from non-specified organism 205.490 10,3
I50 – Heart Failure 155.901 7,8
K80 – Cholelithiasis 140.751 7,0
I20 – Angina Pectoris 92.065 4,6
K81 – Cholecystitis 88.082 4,4
N39 – Other disorders of urinary system 85.677 4,3
I64 – Stroke, not specified as haemorrhage or infarction 80.153 4,0
I10 – Essential (primary) hipertension 68.947 3,4
I21 – Acute myocardial infarction 58.867 2,9
S72 – Fracture of femur 58.848 2,9
Other 966.741 48,3
Use of ICU
Yes 166.279 8,3
No 1.835.243 91,7
Type of Procedure
Clinical 1.532.611 76,6
Surgical 468.911 23,4
Financing Arrangement
Public (0% private) 559.227 27,9
Mixed-Public (from 0.1 to 25% of private admissions) 476.313 23,8
Mixed (from 25.1 to 75% of private admissions) 545.070 27,2
Mixed-Private (de 75,1 a 99% of private admissions) 75.218 3,8
Private (100% of private admissions) 345.694 17,3
Source of Payment at Admission
SUS 1.381.569 69,0
Health Insurance Plan 565.095 28,2
Private-pay 54.858 2,7
Outcome of care
Discharge 1.770.871 88,5
Obit 230.651 11,5
The predictive capacity of the final model, the best one among the five models tested, was equal to 0.815 (CI 95%: 0.814-0.816), adding discriminant strength when com-pared to the base model composed only of
variables age and gender, whose C-statistics was 0.651 (CI 95%: 0.650-0.652). Graph 1 shows the evolution of C-statistics in func-tion of the entry of each risk variable in the tested models.
Graph 1. Evolution of C-statistics of assessed risk-adjusted models – São Paulo, 2008 to 2010
0,0 0,0 0,6
0,2 0,8
0,4 1,0
0,4 0,8
0,2 0,6 1,0
Sensitivit
y
ROC Curve
Model 1 (Base: Gender, Age Group) C=0,651 (0,650-0,652)
Model 2 (Model 1 + Principal Diagnosis) C=0,795 (0,794-0,796)
Model 3 (Model 2 + CI) C=0,796 (0,795-0,797)
Model 4(Model 3 + Other Comorbidity) C=0,798 (0,798-0,799)
Model 5 (Final: Model 4 + Lenght of stay) C=0,815 (0,814-0,816)
Source: Sistema de Informações Hospitalares (SIH) of SUS and Comunicação de Internação Hospitalar (CIH).
The final logistic regression model used for the prediction of expected deaths (available with the authors) indicated greater chance of obit for male patients, in higher age groups, with CI above zero, with another morbidity, and with one day length of stay in hospital (results not presented). It is noteworthy that the chance of obit presented an important variation, according to the primary diagnosis.
The gross hospital mortality rate corre-sponded to 11.5%, varying between 0.3 and 26.9% in the hospitals included in the study; the standardized mortality rate was 11%, but
Graph 2 shows HSMR variation accord-ing to categories of financaccord-ing arrangements. The distribution of hospitals presented im-portant heterogeneity, indicating that even in the group of public arrangement hospi-tals, where the performance was worse than
expected, there are hospitals in which the results were better than expected; as well as in the private hospitals, where the per-formance was better, there are hospitals in which the results were worse than expected.
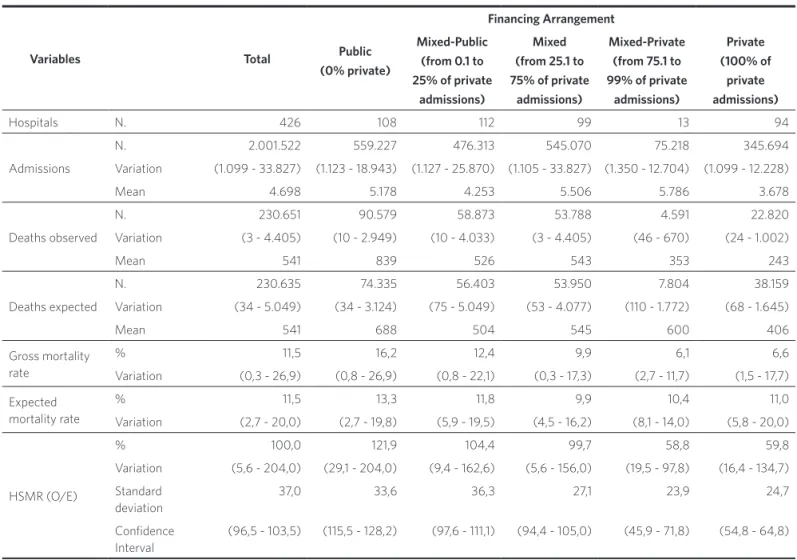
Table 2. Classification of hospital performance, according to hospital standardized mortality ratio (HSMR) – São Paulo, 2008 to 2010
Variables Total
Financing Arrangement
Public (0% private)
Mixed-Public (from 0.1 to 25% of private
admissions)
Mixed (from 25.1 to 75% of private
admissions)
Mixed-Private (from 75.1 to 99% of private
admissions)
Private (100% of
private admissions)
Hospitals N. 426 108 112 99 13 94
Admissions
N. 2.001.522 559.227 476.313 545.070 75.218 345.694
Variation (1.099 - 33.827) (1.123 - 18.943) (1.127 - 25.870) (1.105 - 33.827) (1.350 - 12.704) (1.099 - 12.228)
Mean 4.698 5.178 4.253 5.506 5.786 3.678
Deaths observed
N. 230.651 90.579 58.873 53.788 4.591 22.820
Variation (3 - 4.405) (10 - 2.949) (10 - 4.033) (3 - 4.405) (46 - 670) (24 - 1.002)
Mean 541 839 526 543 353 243
Deaths expected
N. 230.635 74.335 56.403 53.950 7.804 38.159
Variation (34 - 5.049) (34 - 3.124) (75 - 5.049) (53 - 4.077) (110 - 1.772) (68 - 1.645)
Mean 541 688 504 545 600 406
Gross mortality rate
% 11,5 16,2 12,4 9,9 6,1 6,6
Variation (0,3 - 26,9) (0,8 - 26,9) (0,8 - 22,1) (0,3 - 17,3) (2,7 - 11,7) (1,5 - 17,7)
Expected mortality rate
% 11,5 13,3 11,8 9,9 10,4 11,0
Variation (2,7 - 20,0) (2,7 - 19,8) (5,9 - 19,5) (4,5 - 16,2) (8,1 - 14,0) (5,8 - 20,0)
HSMR (O/E)
% 100,0 121,9 104,4 99,7 58,8 59,8
Variation (5,6 - 204,0) (29,1 - 204,0) (9,4 - 162,6) (5,6 - 156,0) (19,5 - 97,8) (16,4 - 134,7)
Standard deviation
37,0 33,6 36,3 27,1 23,9 24,7
Confidence Interval
(96,5 - 103,5) (115,5 - 128,2) (97,6 - 111,1) (94,4 - 105,0) (45,9 - 71,8) (54,8 - 64,8)
When analyzing the cases by sources of payment at admission, higher HSMR is observed in the SUS cases, in all financ-ing arrangements. However, for the group of hospitals classified as mixed-private or private, the performance was better than expected (HSMR < 100) regardless of the
payment source. In the hospitals of public, mixed-public, or mixed arrangements, HSMR indicates worse performance than expected only for SUS patients, while the other cases were classified as better perfor-mance than expected (graph 3).
Graph 2. Boxplot of Hospital Standardized Mortality Ratio (HSMR) variation, according to hospitals financing arrangements – São Paulo, 2008-2010
Source: Sistema de Informações Hospitalares (SIH) of SUS and Comunicação de Internação Hospitalar (CIH). 250
200
150
100
50
0
0
0
0
0
Public Mixed-public
Arrangement
HSMR
Mised Mixed-private Private
121,9
61,4 56,5
107,9
67,0 59,3
114,0
60,2
21,8 89,6
60,4 47,3
75,1
0 20 40 60 80 100 120 140
SUS
Public Mixed-public Mixed Mixed-private Private
SUS SUS SUS SUS
Health
Insurance Private InsuranceHealth Private InsuranceHealth Private InsuranceHealth Private
Graph 3. Hospital Standardized Mortality Ratio (HSMR) by admission source of payment, according to hospital financing arrangements – São Paulo, 2008-2010
Discussion
The results indicated that the methodology proposed by Jarman (JARMAN ET AL., 1999; JARMAN
ET AL., 2010) is applicable to the Brazilian da-tabases, having as an important benefit the possibility of assessing a higher number of providers considering that differently from the analysis by specific causes, this approach allows for the inclusion of hospitals with varied profiles of cases. The specificity of the Brazilian databases and the need to achieve adaptations in the applied methodology hinder the comparison of the results with those from other countries (JARMAN ET AL., 2010; CIHI, 2007; IHI, 2003). However, the adaptation of the intrinsic concepts of this methodology to the data available in each place is a common feature of several studies (BURNETT ET AL., 2013). In this study, the risk model adopted using data registered on the database of the state of São Paulo presented good discriminative capacity (C = 0.815) (AYLIN; BOTTLE; MAJEED, 2007), a result that is above other studies that ana-lyzed specific conditions in Brazilian admin-istrative data (MARTINS, 2010). If on one hand the good predictive capacity and the inclusion of various providers in the analyses constitute an advantage of the methodology used, on the other hand it should be stressed that it may also be considered less accurate due to the inclusion of cases of varied natures with heterogeneous risk, allowing for questioning on causal and attributable validity (VAN GESTEL
ET AL., 2012; DONABEDIAN, 2002).
In this specific study, it is noteworthy that the delimitation used for the inclusion of hospitals, according to the volume of ad-missions and deaths observed, was inferior to that adopted by Jarman et al. (1999), thus enabling the inclusion of smaller institu-tions, which are important in the Brazilian hospital network (MACHADO; MARTINS; LEITE, IN PRINT). For the same reason, the setting was not restricted to hospitals with emergency services, as originally proposed.
number of expected deaths used variables similar to those included in other studies (CAMPBELL ET AL., 2012; SHARABIANI; AYLIN; BOTTLE, 2012). However, the information on comorbid-ity and composite indexes are less used in Brazilian studies due to under-registration and incomplete data, jeopardizing the ad-justment and limiting the accuracy of results (MARTINS, 2010). In face of this reality, the use of primary diagnosis in the risk-adjusted model refined the measure of severity of the case.
The limits of this study are mainly due to the low quality and completeness of data used for the analyses, the limited approach of the gravity of cases, and the use of global mortality as clinical performance measure. These questions are intertwined, limiting the analysis of results, since the validity of hospital mortality is associated with the risk-adjustment adequacy and this depends on the quality and comprehensiveness of data composing the patient’s severity and may help in the identification of the progno-sis. Precisely due to problems in the quality and sufficiency of data on hospital produc-tion this study has been circumscribed to the state of São Paulo.
When considering the changes in the demographic and epidemiologic profile re-sulting from population aging and the sub-sequent increase of patients with prevalence of multiple chronicle morbidities, it is of utmost importance to broaden those data. In this sense, in December 2015 new data fields were opened for multiple comorbidi-ties in the Hospital Data System (Sistema de Informações Hospitalares – SIH) of SUS. However, it does not seem like actions have been taken to stimulate it being informed. Furthermore, the Hospital and Outpatient Data Register (Comunicação de Informação Hospitalar e Ambulatorial – CIHA) system used to report private admissions needs qualification in order to broaden its com-pleteness and reliability.
Conclusion
The comparison between the analyzed hospitals highlights the strong HSMR variations, with disadvantages for public and mixed-public hospitals, as well as for patients whose source of payment at ad-mission is SUS, regardless of the hospital financing arrangement. The discrepancies
observed according to sources of payment at admission in hospitals in the five types of financing arrangements illustrate the risk of aggravation of social inequities; they also show the mix public-private overlap-ping the Brazilian hospital network. In this sense, the performance assessment achieved in this study drawing on the HSMR meth-odology has shown its viability to subsidize strategies for quality and management im-provement of the Brazilian health system. However, analyses of organizational factors involved in clinical practice differences must be added, and in-depth knowledge should be achieved regarding the degree of severity of patients at admission; both aspects have not been captured in face of the variables avail-able at Brazilian databases. Though there is space for refinement of the methodol-ogy and despite the limitations hereby dis-cussed, the application of this methodology for the assessment of hospital clinical per-formance may contribute to the monitoring of the country’s installed network, thus con-stituting a fundamental instrument for the support and guidance of public policies and regulations in Brazil.
Collaborators
Juliana Pires Machado and Mônica Martins performed the development of the study and wrote the article; Iuri da Costa Leite par-ticipated in the data analysis and the critical review of the document.
Acknowledgements
AYLIN, P.; BOTTLE, A.; MAJEED, A. Use of administrative data or clinical databases as predictors of risk of death in hospital: comparison of models.
BMJ, Londres, v. 19, p. 334-1044, 2007.
BRAND, C. et al. Hospital Mortality Indicator (HMI) Review (2013). Melbourne: The Australian Commission on Safety and Quality in Health Care, 2013.
BRAND, C. A. et al. A review of hospital characteristics associated with improved performance. Int. J Qual. Health Care, Oxford, v. 24, n. 5, p. 483-494, 2012.
BURNETT, S. et al. Prospects for comparing European hospitals in terms of quality and safety: lessons from a
comparative study in five countries. Int. J Qual. Health
Care, Oxford, n. 1, p. 1-7, 2013.
CAMPBELL, M. J. et al. Developing a summary
hospital mortality index: retrospective analysis in English hospitals over five years. BMJ, Londres, v. 344, n. e1001, 2012.
CANADIAN INSTITUTE FOR HEALTH
INFORMATION (CIHI). HSMR: a new approach for measuring hospital mortality trends in Canada. Ottawa: CIHI, 2007.
CHASSIN, M. R. et al. Accountability measures: using measurement to promote quality improvement. N Engl. J Med., Londres, v. 363, n. 7, p. 683-688, 2010.
DEVEREAUX, P. J. et al. A systematic review and metanalysis of studies comparing mortality rates of private for-profit and private not-for-profit hospitals.
Can. Med. Assoc. J, Ottawa, v. 166, n. 11, p. 1399-1406, 2002.
DONABEDIAN, A. An introduction to quality assurance in health care. Oxford: Oxford University Press, 2002.
FUNG, V. et al. Meaningful variation in performance: a systematic review. Med. Care, Filadélfia, v. 48, n. 2, p.
140-148, 2010.
INSTITUTE FOR HEALTHCARE IMPROVEMENT (IHI). Move your dot: measuring, evaluating, and reducing hospital mortality rates (Part 1). Cambridge: IHI, 2003.
JARMAN, B. et al. Explaining differences in English hospital death rates using routinely collected data.
BMJ, Londres, v. 318, p. 1515-1520, 1999.
JARMAN, B. et al. The hospital standardized mortality ratio: a powerful tool for Dutch hospitals to assess their quality of care? Qual. Saf. Health Care, Londres, v. 19, p.
9-13, 2010.
LA FORGIA, G. M.; COUTTOLENC, B. F. Desempenho hospitalar no Brasil: em busca da excelência. São Paulo: Singular, 2009.
LUFT, H. S. Hospital volume, physician volume, and patient outcomes: assessing the evidence. Ann Arbor: Health Administration Press, 1990.
MACHADO, J. P.; MARTINS, M. S.; LEITE, I. C. Qualidade das bases de dados hospitalares no Brasil:
alguns elementos. Rev. Bras. Epid., São Paulo, (no prelo).
MARTINS, M. Uso de medidas de comorbidades para
predição de risco de óbito em pacientes brasileiros hospitalizados. Rev. Saúde Pública, São Paulo, v. 44, n. 3, p. 448-456, 2010.
MEDICI, A. C. Sistemas de financiamento e gestão hospitalar: uma aplicação ao caso brasileiro. In: VECINA NETO, G.; MALIK, A. M. Gestão em saúde.
Rio de Janeiro: Guanabara Koogan, 2011. p. 50-73.
MULLEY, A. G. Inconvenient truths about supplier induced demand and unwarranted variation in medical practice. BMJ, Londres, v. 339, n. b4073, 2009.
QUAN, H. et al. Coding algorithms for defining comorbidities in ICD-9-CM and ICD-10 administrative data. Med. Care, Filadélfia, v. 43, n. 11, p. 1130-9, 2005.
SHAHIAN, D. M. et al. Hospital-wide mortality as
a quality metric: conceptual and methodological challenges. American J. of Medical Quality, Baltimore, v. 27, n. 2, p. 112-123, 2012.
SHARABIANI, M. T. A.; AYLIN, P.; BOTTLE, A. Systematic review of comorbidity indices for administrative data. Med. Care, Filadélfia, v. 50, n. 12, p. 1109-1118, 2012.
SPENCER, C. S.; GASKIN, D. J.; ROBERTS, E. T. The quality of care delivered to patients within the same hospital varies by insurance type. Health Affairs,
Millwood, v. 32, n. 10, p. 1731-1739, 2013.
VAN GESTEL, Y. R. B. M. et al. The hospital
standardized mortality ratio fallacy: a narrative review.
Med. Care, Filadélfia, v. 50, n. 8, p. 662-667, 2012.
WEISSMAN, J. S.; VOGELI, C.; LEVY, D. E. The quality
of hospital care for Medicaid and private pay patients.
Med. Care, Filadélfia, v. 51, n. 5, p. 389-395, 2013.