The role of K121Q ENPP1 polymorphism in
diabetes mellitus and its complications
C.B. Leitão
1, G.B. Nabinger
1,
A.L. Krahe
2, P.B. Bolson
1, F. Gerchman
1, R. Friedman
1,
J.L. Gross
1and L.H. Canani
11
Serviço de Endocrinologia, Hospital de Clínicas de Porto Alegre, Universidade Federal do Rio Grande
do Sul, Porto Alegre, RS, Brasil
2
Serviço de Medicina Interna, Universidade Luterana do Brasil, Porto Alegre, RS, Brasil
Correspondence to: L.H. Canani, Serviço de Endocrinologia, Hospital de Clínicas de Porto Alegre,
Rua Ramiro Barcelos, 2350, 90035-903 Porto Alegre, RS, Brasil
Fax: +55-51-2101-8777. E-mail: [email protected]
The aim of the present study was to analyze the frequency of K121Q polymorphism in the ENPP1 gene of Brazilian subjects according to ethnic origin and to determine its possible association with diabetes mellitus (DM) and/or diabetic complications. A cross-sectional study was conducted on 1027 type 2 DM patients and 240 anonymous blood donors (BD). Ethnicity was classified based on self-report of European and African descent. The Q allele frequency was increased in African descendant type 2 DM patients (KK = 25.9%, KQ = 48.2%, and QQ = 25.9%) and BD (KK = 22.0%, KQ = 53.8%, and QQ = 24.2%) compared to European descendant type 2 DM patients (KK = 62.7%, KQ = 33.3%, and QQ = 4.1%) and BD (KK = 61.0%, KQ = 35.6%, and QQ = 3.4%). However, there was no difference in genotype distribution or Q allele frequency between diabetic and non-diabetic subjects (European descendants: DM = 0.21 vs BD = 0.21, P = 0.966, and African descendants: DM = 0.50 vs BD = 0.51, P = 0.899). In addition, there were no differences in clinical, laboratory or insulin resistance indices among the three genotypes. The prevalence of DM complications was also similar. In conclusion,K121Q polymorphism is more common among Afro-Brazilian descendants regardless of glycemic status or insulin sensitivity indices. Likewise, insulin sensitivity and DM chronic complica-tions appear not to be related to the polymorphism in this sample.
Key words: ENPP1 polymorphism; Ethnicity; Type 2 diabetes mellitus
Research supported by PRONEX, CNPq, Fundo de Incentivo à Pesquisa, Hospital de Clínicas de Porto Alegre, and CAPES.
Received June 21, 2007. Accepted September 13, 2007
Introduction
The ecto-nucleotide pyrophosphatase/phosphodiester-ase 1 (ENPP1) gene is a member of the ecto-nucleotide pyrophosphatase/phosphodiesterase (ENPP) family. The encoded protein is a type II transmembrane glycoprotein. This protein has broad specificity and cleaves a variety of substrates, including phosphodiester bonds of nucleotides and nucleotide sugars. The ENPP family is involved in a variety of processes that range from bone mineralization to insulin action signaling (1).
Several polymorphisms are located in the ENPP1 gene (2,3), the one most frequently analyzed being located in exon 4 and causing an amino acid change (K121Q). The
individuals with hypertension (10) or obesity (3) and in-creased predisposition to diabetic nephropathy (11).
In addition, the frequency of the Q allele seems to be highly dependent on the ethnic group. Dominican Republic subjects have a higher frequency of the Q allele (>0.50) than Caucasian subjects in other countries (~0.15) (12). North American children of African ancestry have an in-creased prevalence of the Q allele compared to North American children of European ancestry (13). Similar find-ings were reported recently for African-American adults and adults of Hispanic descent (14). The increased fre-quency of the Q allele in these ethnic groups might explain their higher risk of developing DM (15) and their higher insulin resistance compared to individuals of European descendent (16). This is also true for other American ethnic minorities (16). However, the distribution of this allele and the possible association of K121Q polymor-phism with type 2 DM and its chronic complications in other populations are largely unknown.
Therefore, the aim of this study was to analyze the frequency of the K121Q allele in Brazilian subjects of different ethnic origins, and the possible association of the Q allele with DM and chronic diabetic complications.
Subjects and Methods
Subjects
A total of 1129 patients with type 2 DM (diagnosis of DM after the age of 35 years and without insulin use during the first 5 years after diagnosis) were identifiedfrom a multicentric project aimed at studying risk factors for long-term diabetic complications, which started recruiting pa-tients in the southern Brazilian State of Rio Grande do Sul in 2002. Ethnicity was classified as self-reported skin color and recorded as European descent, African descent, mixed, or “other”. Those reporting “other” ethnic origin (N = 5) as well as those reporting mixed origin (N = 97) were ex-cluded. Therefore, 1027 patients were recruited from the outpatient endocrine clinics of the 4 participating hospitals (Grupo Hospitalar Nossa Senhora da Conceição,Hospital São Vicente de Paula, Hospital Universitáriode Rio Gran-de, and Hospital de Clínicas de Porto Alegre). According to the official Brazilian Census of 2000, the ethnic distribution of the adult population of the South Region is 84.5% of European descent, 3.8% of African descent, and 10.4% of mixed origin (17). The European immigration to the State of Rio Grande do Sul was mainly from Portugal, Spain, Italy, and Germany. The subjects reporting African origins descend from people forcibly brought to Brazil between the 17th and 18th centuries, mainly from Angola and Mozambique.
DNA samples from 240 anonymous blood donors (BD) (European descendants N = 149, African descendants N = 91) were also examined for the K121Q polymorphism. The information available for these subjects consisted of age and sex. None of them reported having DM.
The diabetic patients underwent a standardized evalu-ation consisting of aquestionnaire, physical examination, and laboratory tests. Weight (without shoes, light outdoor clothing) and height were measured,and body mass index (BMI) was calculated. Waist circumference was measured at the narrowest point as viewed from the front. Hyperten-sion was defined as blood pressure ≥140/90 mmHg or current useof antihypertensive medication. An ophthal-mologist performeddirect fundoscopy, and diabetic reti-nopathywas classified as absent, nonproliferative, or pro-liferative.Ischemic heart disease (IHD) was diagnosed as previously described (18). Briefly, IHD was established in the presence of anginaor possible infarct according to the World Health OrganizationCardiovascular Questionnaire and/or the presence of restingelectrocardiogram abnor-malities [Minnesota Codes Q and QS patterns(1.1-2, 1.3); S-T junction (J), and segment depression(4.1-4); T wave items (5.1-3), complete leftbundle block (7.1)], and/or the presence of perfusion abnormalities(fixed or variable) on myocardial scintigraphy at rest andafter iv dipyridamole. Because of the costs and complexity, this evaluation of IHD was carried out in only 642patients. The local Ethics Committees approved the protocoland all diabetic sub-jects signed an informed consent form.
Laboratory analysis
Serum insulin (radioassay, ElecsysR Systems 1010/ 2010/modular analytics E170, Roche Diagnostics, India-napolis, IN, USA) was measured in a subgroup of patients (European descendants: N = 138, African descendants: N = 51) who were not taking insulin or insulin sensitizers and with serum creatinine <1.3 mg/dL. Insulin sensitivity was estimated by homeostasis model assessment-insulin re-sistance (HOMA-IR = fasting insulin (mIU/mL) x fasting glucose (mmol/L)/22.5), as recently validated (20). The mean HOMA-IR value of control subjects in our laboratory is 1.84 ± 1.02 (21).
Molecular analysis
DNA was isolated from lymphocytes using standard procedures (22). Subjects were genotyped for ENPP1 K121Q polymorphism in exon 4 aspreviously described (11). Briefly, a transversion from A to C at the first position of codon121, resulting in an amino acid change from lysine to glutamine(K121Q) was genotyped. PCR was performed using primers:forward 5'-CTGTGTTCACTTTGGACATG TTG-3' and reverse 5' -GACGTTGGAAGATACCAGGTT G-3'.PCR products were digested by the restriction en-zyme AvaII andseparated on agarose gel. The genotypes were confirmed in a second reaction in 5% of the sample. All PCRs were run in a final volumeof 25 µL, containing 50 ng genomic DNA, 20 mmol/L Tris-Cl,pH 8.4, 50 mmol/L KCl, 1.5 mmol/L MgCl2, 0.2 mmol/L dNTPs,1 unit of TaqDNA
polymerase, and 1 µmol/L of specificprimer. The allele encoding the K variantappeared as a single fragment of 238 bp, and the allele encodingthe Q variant appeared as two fragments of 148 and 90 bp each.
Statistical analysis
Continuous data are reported as means ± SD. Cat-egoricaldata are reported as number of subjects and percent ofindividuals affected. The χ2 test and one-way
ANOVA were used to compare genotype groups in terms of clinicaland laboratory characteristics and the Tukey test was usedfor post hoc multiple comparisons. Hardy-Wein-berg equilibriumwas calculated using allele frequencies and the χ2 test. Variables without normal distribution were
log transformed. The power to detect an odds ratio of 1.5 for DM in the presence of the Q allele was 70%, and the power to detect an odds ratio of 1.7 was 90%. AP < 0.05 value (two-sided) was considered to be significant.
Results
Description of the subjects
A total of 1027 patients with type 2 DM (European descendants: N = 830, African descendants: N = 197) and
240 BD (European descendants: N = 149, African descen-dants: N = 91) were included. The patients of European descent with type 2 DM were older (59.3 ± 10.4 vs 54.3 ± 10.5 years, P < 0.001) and had a longer known DM duration (11.6 ± 9.0 vs 8.7 ± 7.2 years, P < 0.001) than patients of African descent. The BMI was similar for the two groups (28.9 ± 5.3 and 28.8 ± 5.4 kg/m2, P = 0.859). Among
BD, mean age was 47 ± 7.8 years and gender distribution was 136 (56.6%) males and 104 (43.4%) females.
Genotype distribution
In both type 2 DM patients and BD, individuals of African descent had a higher frequency of the Q allele as compared to European descendants. In type 2 DM pa-tients, the frequencies of the KK, KQ, and QQ genotypes were 25.9, 48.2, and 25.9% in African descendants, and 62.7, 33.3, and 4.1% in European descendants (P < 0.001). The same pattern was observed in BD (22.0, 53.8, and 24.2% for those of African descent and 61.0, 35.6, and 3.4%, for those of European descent, P < 0.001). However, the genotype distributions (P = 0.808 in European descen-dants and P = 0.653 in African descendescen-dants) and allele frequencies (European descendants: DM = 0.21 vs BD = 0.21, P = 0.966 and African descendants: DM = 0.50 vs BD = 0.51, P = 0.899) did not differ between diabetic and non-diabetic subjects, irrespective of ethnic background. All genotypes were in Hardy-Weinberg equilibrium.
Clinical and laboratory characteristics according to genotype
There were no differences in clinical or laboratory characteristics among the three genotypes (Table 1), ex-cept for DM duration that was longer in European descen-dant heterozygotes (P = 0.033). Systolic and diastolic blood pressure, prevalence of hypertension, glucose and lipid profiles, insulin resistance indices, and renal function did not differ among groups regardless of ethnicity. The prevalence of vascular complications (micro- and macro-vascular) was also similar across genotypes.
Discussion
Table 1. Table 1. Table 1. Table 1.
Table 1. Clinical and laboratory characteristics of patients with type 2 diabetes according to ethnicity and genotype.
European descendants African descendants
KK (N = 520) KQ (N = 276) QQ (N = 34) KK (N = 51) KQ (N = 95) QQ (N = 51)
Age (years) 59.7 ± 10.3 58.9 ± 10.7 56.3 ± 8.8 55.8 ± 9.2 55.0 ± 11.5 55.6 ± 9.7 Diabetes duration (years) 11.0 ± 8.8 12.8 ± 9.5 10.6 ± 7.2 8.7 ± 7.0 8.3 ± 7.3 9.6 ± 7.3 Male sex, N (%) 242 (46.5) 133 (48.2) 17 (50.0) 16 (31.4) 35 (36.8) 20 (39.2) BMI (kg/m2) 29.1 ± 5.4 28.7 ± 5.2 27.3 ± 3.7 27.9 ± 5.2 29.1 ± 5.6 29.2 ± 5.2 Waist circumference (cm) 97.9 ± 12.4 97.4 ± 11.6 93.9 ± 9.4 94.5 ± 14.9 97.7 ± 12.0 98.1 ± 10.5 Systolic blood pressure (mmHg) 143.5 ± 24.0 140.4 ± 22.4 142.3 ± 25.8 141.8 ± 21.5 141.1 ± 24.2 142.3 ± 24.6 Diastolic blood pressure (mmHg) 86.5 ± 12.7 85.2 ± 12.4 84.3 ± 11.8 86.5 ± 13.0 87.4 ± 13.2 87.9 ± 14.4 Hypertension, N (%) 346 (67.7) 181 (66.3) 22 (68.8) 35 (68.6) 67 (72.0) 37 (72.5) A1c test (%) 6.64 ± 1.95 6.65 ± 1.89 6.28 ± 1.47 6.79 ± 1.90 6.94 ± 2.75 6.95 ± 2.51 Fasting plasma glucose (mg/dL) 177.2 ± 78.3 174.7 ± 76.1 177.7 ± 66.4 192.2 ± 69.1 175.0 ± 73.1 195.6 ± 85.3 Total cholesterol (mg/dL) 216.0 ± 45.0 210.0 ± 44.2 228.8 ± 63.4 217.4 ± 53.3 215.8 ± 109.3 209.7 ± 54.7 HDL-cholesterol (mg/dL) 43.3 ± 12.4 43.2 ± 11.0 43.6 ± 10.8 45.8 ± 12.9 47.7 ± 15.4 47.1 ± 12.3 Triglycerides (mg/dL) 156 (27-1470) 145 (26-1236) 156 (56-659) 137 (43-892) 118 (37-640) 126 (47-503) Creatinine (mg/dL) 0.98 (0.40-13.90) 0.93 (0.50-9.60) 1.00 (0.60-6.95) 0.86 (0.50-13.30) 0.80 (0.40-7.00) 0.90 (0.50-13.60) HOMA-IR 4.40 (0.30-30.24) 6.12 (0.32-26.07) 9.52 (1.72-25.71) 4.02 (1.30-20.03) 4.00 (0.61-19.14) 5.65 (1.07-18.97) Ischemic heart disease, N (%) 125 (34.6) 69 (36.5) 12 (50.0) 9 (50.0) 17 (56.7) 10 (50.0)
Stroke, N (%) 22 (6.2) 9 (5.2) 3 (13) 2 (6.9) 4 (7.3) 3 (9.1)
Proliferative retinopathy, N (%) 83 (17.3) 47 (18.7) 7 (22.6) 8 (19.5) 19 (28.4) 8 (20.5) Micro-/macroalbuminuria, N (%) 117/91 (23.0/17.9) 65/55 (23.8/20.1) 19/4 (12.1/30.3) 10/9 (20.8/18.8) 23/12 (31.1/16.2) 7/12 (15.2/26.1)
Data are reported as mean ± SD or median (range). Data are reported for 816 European descendants and 139 African descendants for hypertension, for 574 European descendants and 68 African descendants for ischemic heart disease, for 551 European descendants and 117 African descendants for stroke, and for 762 European descendants and 47 African descendants for proliferative retinopathy. BMI = body mass index; HOMA-IR = homeostasis model assessment-insulin resistance. The χ2 test and one-wayANOVA were used to compare genotype groups and the Tukey test was usedfor post hoc multiple comparisons. P > 0.05 for all comparisons except for diabetes duration in European descendants (P = 0.033 between KQ and QQ genotypes).
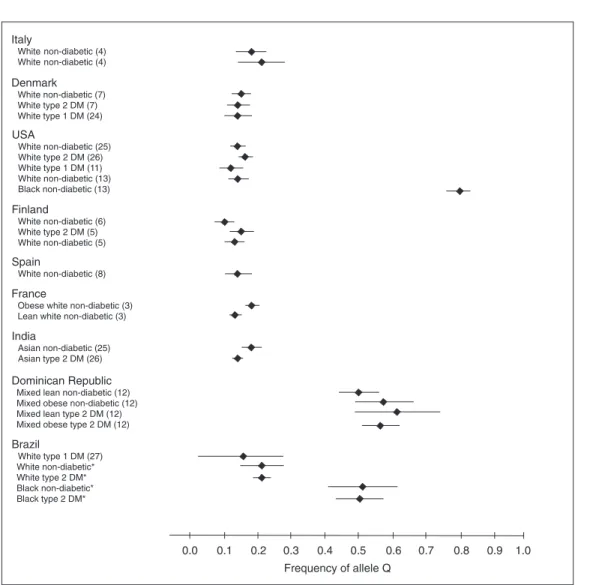
The higher frequency of the Q allele observed among African descendants is in accordance with the few studies that evaluated K121Q polymorphism in different ethnic groups to date (Figure 1). In general, the Q allele is more common in populations of non-European origin (12,13). The Q allele frequency observed in African descendants in this sample (~0.50) is similar to that found in Dominican Republic type 2 DM patients (12). The Dominican Republic is a Caribbean island with a predominantly mixed popula-tion (European descendants: 16%, African descendants: 11%, and mixed descendants: 73%) (23). Unfortunately, the authors do not make any reference to the ethnic distri-bution of the Dominican Republic subjects studied. Based on the available information, we tend to assume that the majority may represent the mixed population. On the other hand, the frequency of the Q allele in the Afro-Brazilian descendants was lower than the frequency described in Afro-North American descendants (~0.80) (13). Among European descendants the frequency of the Q allele is relatively constant in the many different populations ana-lyzed so far, with point estimates ranging from 0.10 to 0.21 (3-8,11,24-27).
We have previously described an association between the Q allele and diabetic nephropathy (11) in European
descendant type 1 DM patients. In that study, the insulin sensitivity indexes were not assessed. However, the Q allele carriers did not differ with regard to phenotypic characteristics of insulin resistance, such as BMI, blood pressure, lipid profile, or A1c test values.
In this larger sample of type 2 DM patients, there was no association between the Q allele and clinical character-istics of insulin resistance, type 2 DM or chronic diabetic complications. Moreover, the indirect index of insulin resis-tance, HOMA-IR, was not different between carriers and non-carriers of the Q allele.
In a previous report, we have also found an excess of cases of end-stage renal disease and IHD in African de-scendant type 2 DM patients (28). The present data show that these excess frequencies cannot be explained by the ENPP1 K121Q polymorphism.
It is not yet clear why some investigators found an association of the polymorphism with insulin resistance and DM chronic complications, and others did not. Even among Europeans, this finding is somewhat heteroge-neous (3-9,24). This suggests that, if the association is real, its effect is small and might depend on other polymor-phisms or gene interactions.
studies involving ethnicity: the classification of different ethnic groups. In spite of the use of patient self-reported classification, there may be some misclassification due to miscegenation. Nevertheless, the population of Southern Brazil has historically fewer inter-ethnic marriages than the rest of the country, probably preserving more of the original genomic ancestry. As a matter of fact, the Q allele preva-lence among European descendants in the present sam-ple is similar to that found in European countries.
The use of an indirect method to measure insulin sensitivity instead of the euglycemic-hyperinsulinemic
Figure 1 Figure 1Figure 1 Figure 1
Figure 1. ENPP1 Q allele frequency according to the ethnic origin. Diamond = mean; horizontal line = 95% confidence interval. *Data from the present study. DM = diabetes mellitus.
clamp may be questioned, since it could reduce the accu-racy of the results. However, HOMA-IR is widely accepted as an insulin action index (20,29), whereas the clamp technique is complex, time-consuming and not cost-effec-tive for the study of large samples (30).
In conclusion, the ENPP1 polymorphism K121Q is more prevalent among Brazilian individuals of African de-scent independent of glycemic status or insulin sensitivity indexes. Likewise, insulin sensitivity and DM chronic com-plications appear not to be related to the polymorphism in this sample.
References
1. Bollen M, Gijsbers R, Ceulemans H, Stalmans W, Stefan C. Nucleotide pyrophosphatases/phosphodiesterases on the
Santagati MG, et al. A cluster of three single nucleotide polymorphisms in the 3'-untranslated region of human gly-coprotein PC-1 gene stabilizes PC-1 mRNA and is associ-ated with increased PC-1 protein content and insulin resis-tance-related abnormalities. Diabetes 2001; 50: 1952-1955. 3. Meyre D, Bouatia-Naji N, Tounian A, Samson C, Lecoeur C, Vatin V, et al. Variants of ENPP1 are associated with child-hood and adult obesity and increase the risk of glucose intolerance and type 2 diabetes. Nat Genet 2005; 37: 863-867.
4. Pizzuti A, Frittitta L, Argiolas A, Baratta R, Goldfine ID, Bozzali M, et al. A polymorphism (K121Q) of the human glycoprotein PC-1 gene coding region is strongly associ-ated with insulin resistance. Diabetes 1999; 48: 1881-1884. 5. Gu HF, Almgren P, Lindholm E, Frittitta L, Pizzuti A, Trischitta V, et al. Association between the human glycopro-tein PC-1 gene and elevated glucose and insulin levels in a paired-sibling analysis. Diabetes 2000; 49: 1601-1603. 6. Kubaszek A, Pihlajamaki J, Karhapaa P, Vauhkonen I,
Laakso M. The K121Q polymorphism of the PC-1 gene is associated with insulin resistance but not with dyslipidemia. Diabetes Care 2003; 26: 464-467.
7. Rasmussen SK, Urhammer SA, Pizzuti A, Echwald SM, Ekstrom CT, Hansen L, et al. The K121Q variant of the human PC-1 gene is not associated with insulin resistance or type 2 diabetes among Danish Caucasians. Diabetes 2000; 49: 1608-1611.
8. Gonzalez-Sanchez JL, Martinez-Larrad MT, Fernandez-Perez C, Kubaszek A, Laakso M, Serrano-Rios M. K121Q PC-1 gene polymorphism is not associated with insulin resis-tance in a Spanish population. Obes Res 2003; 11: 603-605. 9. Bacci S, Ludovico O, Prudente S, Zhang YY, Di Paola R, Mangiacotti D, et al. The K121Q polymorphism of the ENPP1/PC-1 gene is associated with insulin resistance/ atherogenic phenotypes, including earlier onset of type 2 diabetes and myocardial infarction. Diabetes 2005; 54: 3021-3025.
10. Kubaszek A, Markkanen A, Eriksson JG, Forsen T, Osmond C, Barker DJ, et al. The association of the K121Q polymor-phism of the plasma cell glycoprotein-1 gene with type 2 diabetes and hypertension depends on size at birth. J Clin Endocrinol Metab 2004; 89: 2044-2047.
11. Canani LH, Ng DP, Smiles A, Rogus JJ, Warram JH, Krolewski AS. Polymorphism in ecto-nucleotide pyrophos-phatase/phosphodiesterase 1 gene (ENPP1/PC-1) and early development of advanced diabetic nephropathy in type 1 diabetes. Diabetes 2002; 51: 1188-1193.
12. Hamaguchi K, Terao H, Kusuda Y, Yamashita T, Hazoury Bahles JA, Cruz LM, et al. The PC-1 Q121 allele is excep-tionally prevalent in the Dominican Republic and is associ-ated with type 2 diabetes. J Clin Endocrinol Metab 2004; 89: 1359-1364.
13. Morrison JA, Gruppo R, Glueck CJ, Stroop D, Fontaine RN, Wang P, et al. Population-specific alleles: the polymorphism (K121Q) of the human glycoprotein PC-1 gene is strongly associated with race but not with insulin resistance in black and white children. Metabolism 2004; 53: 465-468. 14. Chandalia M, Grundy SM, Adams-Huet B, Abate N. Ethnic
differences in the frequency of ENPP1/PC1 121Q genetic variant in the Dallas Heart Study cohort. J Diabetes Compli-cations 2007; 21: 143-148.
15. Harris MI, Flegal KM, Cowie CC, Eberhardt MS, Goldstein DE, Little RR, et al. Prevalence of diabetes, impaired fasting glucose, and impaired glucose tolerance in U.S. adults. The Third National Health and Nutrition Examination Survey, 1988-1994. Diabetes Care 1998; 21: 518-524.
16. Carter JS, Pugh JA, Monterrosa A. Non-insulin-dependent diabetes mellitus in minorities in the United States. Ann Intern Med 1996; 125: 221-232.
17. IBGE. www.ibge.gov.br. Accessed February 22, 2007. 18. Costa LA, Canani LH, Lisboa HR, Tres GS, Gross JL.
Aggregation of features of the metabolic syndrome is asso-ciated with increased prevalence of chronic complications in type 2 diabetes. Diabet Med 2004; 21: 252-255.
19. Zelmanovitz T, Gross JL, Oliveira JR, Paggi A, Tatsch M, Azevedo MJ. The receiver operating characteristics curve in the evaluation of a random urine specimen as a screening test for diabetic nephropathy. Diabetes Care 1997; 20: 516-519.
20. Bonora E, Targher G, Alberiche M, Bonadonna RC, Saggiani F, Zenere MB, et al. Homeostasis model assess-ment closely mirrors the glucose clamp technique in the assessment of insulin sensitivity: studies in subjects with various degrees of glucose tolerance and insulin sensitivity. Diabetes Care 2000; 23: 57-63.
21. Seligman BG, Biolo A, Polanczyk CA, Gross JL, Clausell N. Increased plasma levels of endothelin 1 and von Willebrand factor in patients with type 2 diabetes and dyslipidemia. Diabetes Care 2000; 23: 1395-1400.
22. Sambrock JFE, Mariatis T. Molecular cloning: A manual laboratory. Cold Spring Harbor: Cold Spring Harbor Labora-tory; 1990.
23. Factbook. www.cia.gov/cia/publications/factbook/geos/ dr.html# People. Accessed December 17, 2005.
24. Jacobsen P, Grarup N, Tarnow L, Parving HH, Pedersen O. PC-1 amino acid variant (K121Q) has no impact on progres-sion of diabetic nephropathy in type 1 diabetic patients. Nephrol Dial Transplant 2002; 17: 1408-1412.
25. Abate N, Carulli L, Cabo-Chan A Jr, Chandalia M, Snell PG, Grundy SM. Genetic polymorphism PC-1 K121Q and ethnic susceptibility to insulin resistance. J Clin Endocrinol Metab 2003; 88: 5927-5934.
26. Abate N, Chandalia M, Satija P, Adams-Huet B, Grundy SM, Sandeep S, et al. ENPP1/PC-1 K121Q polymorphism and genetic susceptibility to type 2 diabetes. Diabetes 2005; 54: 1207-1213.
27. de Azevedo MJ, Dalmaz CA, Caramori ML, Pecis M, Esteves JF, Maia AL, et al. ACE and PC-1 gene polymor-phisms in normoalbuminuric type 1 diabetic patients: a 10-year prospective study. J Diabetes Complications 2002; 16: 255-262.
28. Gerchman F, Burttet L, Nabinger G, Picon P, Zanatta C, Lisboa H, et al. High prevalence of macrovascular and microvascular disease among black patients with type 2 diabetes mellitus. Diabetes 2005; 54: A548.
29. Emoto M, Nishizawa Y, Maekawa K, Hiura Y, Kanda H, Kawagishi T, et al. Homeostasis model assessment as a clinical index of insulin resistance in type 2 diabetic patients treated with sulfonylureas. Diabetes Care 1999; 22: 818-822.