Ana Luiza BierrenbachI Adriana Bacelar Ferreira GomesI
Elza Ferreira NoronhaII Maria de Fátima Marinho de SouzaI
I Secretaria de Vigilância em Saúde. Ministério da Saúde. Brasília, DF, Brasil II Faculdade de Medicina. Universidade de
Brasília. Brasília, DF, Brasil Correspondence:
Ana L Bierrenbach
Esplanada dos Ministérios, Bloco G Edifício Sede, 1º andar, sala 150 70058-900 Brasília, DF, Brasil E-mail: [email protected] Received: 1/30/2007
Approved: 3/27/2007
Tuberculosis incidence and cure
rates, Brazil, 2000-2004
ABSTRACT
OBJECTIVE: To describe the geographical distribution of tuberculosis incidence rates based on a set of epidemiological and operational indicators from information system database.
METHODS: Data from the Sistema de Informação de Agravos de Notifi cação
(Brazilian Information System for Tuberculosis Notifi cation) were collected after removal of improper repeat records and record linkage. Tuberculosis incidence rates were estimated according to geographical unit, age group, sex, clinical manifestation and treatment schedule and standardized for population age group distribution based on 2000 Population Census.
RESULTS: In 2004, in Brazil, tuberculosis incidence rate was 41 per 100,000 inhabitants and 74,540 new cases were notifi ed. Of these, 52.8% were pulmonary tuberculosis with positive bacilloscopy, 24.1% were under supervised treatment, 63.5% were from state capitals or metropolitan areas, and 54.9% were cured cases (complete treatment). After records with missing outcome data were excluded, cure rates were 72.4% for new cases, 47% for new HIV-positive cases, 64.9% for relapses, 64.5% for transfers in/out, and 40% for returns after default. Cure rate for new cases under supervised treatment was 77.1%. A higher proportion of records with missing outcome information was seen in recent years.
CONCLUSIONS: Different incidence rates and treatment outcomes were found in different Brazilian states. To reach the 85% cure goal for new cases and to increase cure in HIV-positive and defaults cases additional efforts are needed by the Brazilian National Tuberculosis Program, including scaling up the Directly Observed Therapy Strategy.
KEY WORDS: Tuberculosis, epidemiology. Incidence. Diseases registries. Epidemiology, descriptive. Brazil.
INTRODUCTION
Tuberculosis (TB) has historically been a public health concern worldwide. As part of the global strategy for TB morbidity and mortality reduction, the World Health Organization (WHO) established a goal of 70% detection of all new bacillary (BK) TB cases and 85% treatment success.7 According to current
WHO estimates, in Brazil, 110,000 new TB cases are reported every year, i.e., an incidence rate of 62 per 100,000 inhabitants, and Brazil ranks 15th of the 22 most affected countries.7
The objective of the present study was to describe the geographical distribution of TB incidence using a set of epidemiological and operational indicators from information system database.
METHODS
For data analysis of TB incidence between 2000 and 2004 data from the Sistema de Informação de Agravos de Notifi cação (Sinan – Brazilian Information System for Tuberculosis Notifi cation), obtained in February 2006, was used after removal of improper repeat records and record linkage.
New TB cases were defi ned according to Sinan gui-delines.* Notifi cation rates were estimated for TB incident cases and referred as incidence rates. Rates were estimated by geographical unit, age group, sex, TB clinical form and treatment schedule. Two different age classifi cation were used, the fi rst was divided into four age groups (children [0–19 years], young adults [20–39 years], adults [40–59 years]; and elderly [over 60 years]) and the second into 11 age groups (0 to 4 years; 5 to 9 years; 10 to 14 years; 15 to 19 years; 20 to 29 years; 30 to 39 years; 40 to 49 years; 50 to 59 years; 60 to 69 years; 70 to 79 years; and 80 years or more). The following geographical units were included in the study: regions, states, 36 metropolitan areas, state capitals and 315 priority municipalities defi ned in PNCT working program for 2004–2007. TB incidence rates were standardized for age distribution in Brazilian states according to the 2000 Population Census.
The number of cases by geographical unit was es-timated based on local case notifi cation except for estimates of incidence rate, which were based on case municipality of residence.
RESULTS
After progressively adding up the number of new TB cases and incidence rate in Brazil for 2000–2003, in 2004, it was found slight case reduction with a total of 74,540 new cases and incidence rate of 41 per 100,000 inhabitants. The observed rates are below WHO esti-mated rates for Brazil, i.e., 110,000 new cases per year and incidence rate of 62 per 100,000 inhabitants. New pulmonary cases and BK pulmonary cases remained relatively steady around 85.6% and 53.1%, respecti-vely, over the study period (Table 1).
In 2004, 75.2% of new cases were notifi ed in 315 priority municipalities, 63.5% in capitals and other municipalities forming metropolitan areas and 43.4%
exclusively in state capitals. These proportions were distinct in the Brazilian regions (Table 2).
The proportion of Brazilian municipalities where not even a single TB case was notifi ed over the study period was variable. It more remarkably decreased between 2000 and 2002 and then remained at 25%. Overall, municipalities where no TB case was notifi ed had small populations. In 2004, 26% of them did not notify any TB case. However, only 1% had a population of 20,000 inhabitants or more. Ponta Grossa (state of Paraná), a PNCT priority municipality, was the single city with more than 100,000 people where no TB cases were notifi ed in 2004.
Table 3 shows new cases, relapses, returns after default, transfers in/out and changes in diagnosis by year of notifi cation. Cases in each category did not vary sig-nifi cantly by year of notifi cation. More than 84% of notifi cations in all years were new cases, and a portion of these diagnoses were changed and no longer were TB cases throughout follow-up.
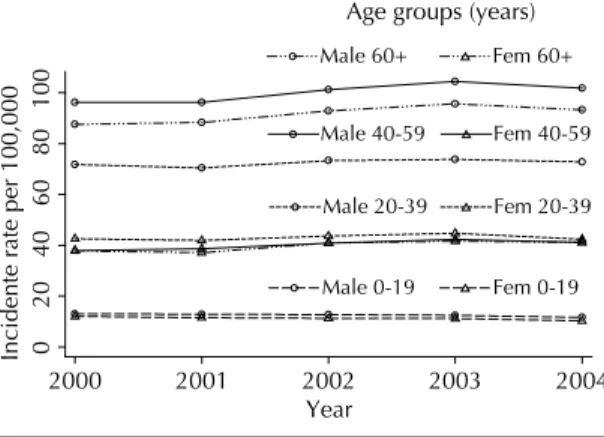
The Figure shows the annual TB incidence rate (all clinical forms) by sex and age groups. A reduction in incidence rates was seen in younger age groups in contrast to increased rates in older age groups. Although there was only slight time variation in each category, a difference could be seen. In men, incidence increased with age while in women it increased in children and young adults but remained constant in those aged 20 to 39 years or more. In 2004, incidence rates were similar in both male and female children (risk ratio=RR=1.1), increased in young adult (RR=1.7) and adult males (RR=2.4), and decreased in elderly males (RR=2.2). With respect to clinical manifestations, in 2004, pul-monary TB was the most prevalent form in all age groups. There was 3% of mixed (pulmonary and
extra-* Ministério da Saúde. Secretaria de Vigilância em Saúde. Sistema de Informação de Agravos de Notifi cação. Normas e rotinas. Brasília; 2004. (Série A: Normas e Manuais Técnicos).
Figure. Tuberculosis incidence rates (all clinical forms) by gender and age group. Brazil. 2000–2004.
0
20
40
60
80
100
Inci
d
ente rate per 100,000
2000 2001 2002 2003 2004
Year
Male 0-19 Male 20-39 Male 40-59 Male 60+
Fem 0-19 Fem 20-39 Fem 40-59 Fem 60+
pulmonary) TB form; ganglionar TB among total new cases was higher up to 14 years of age; and pleural TB increased during childhood and then remained relatively steady. Bone and miliary forms were also more prevalent in children and then declined during adolescence. The proportions were similar in the re-maining years studied.
When only TB cases with HIV co-infection were analyzed, more than 50% of cases had pulmonary TB in all age groups. However, when compared to total cases, HIV-infected TB cases comprised a higher pro-portion of extra-pulmonary cases, i.e., more than 20% in all age groups.
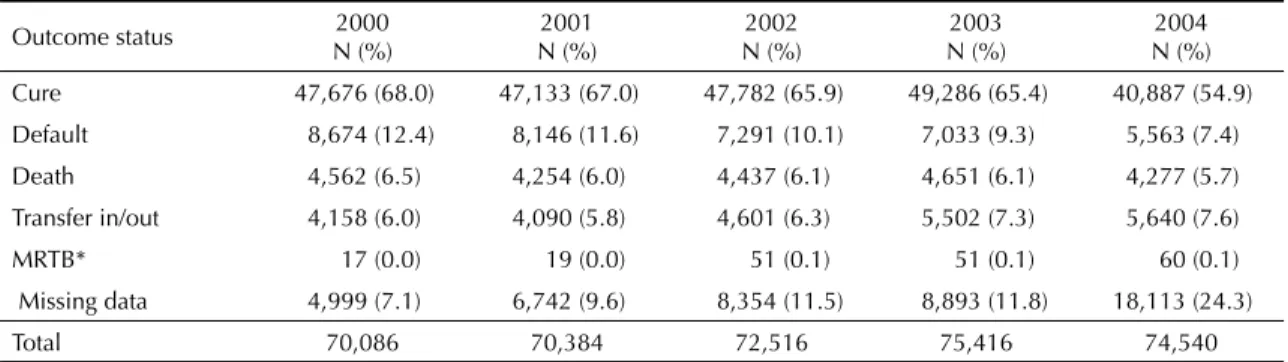
Table 4 shows outcome of new cases by year of notifi -cation. Cure rate was 68.8% in 2000 and 54.9% in 2004 without removing cases with missing outcome informa-tion from the analysis. New cases with missing outcome information increasingly grew over the period studied, which indicates a delay in case follow-up notifi cation. It can also be noted that, while lower than in more recent years, in the year 2000, there were still notifi ed new cases with missing outcome information. Therefore, after removing from the analysis notifi cations with missing outcome information, cure rates were 73.3% and 72.4% in 2000 and 2004, respectively.
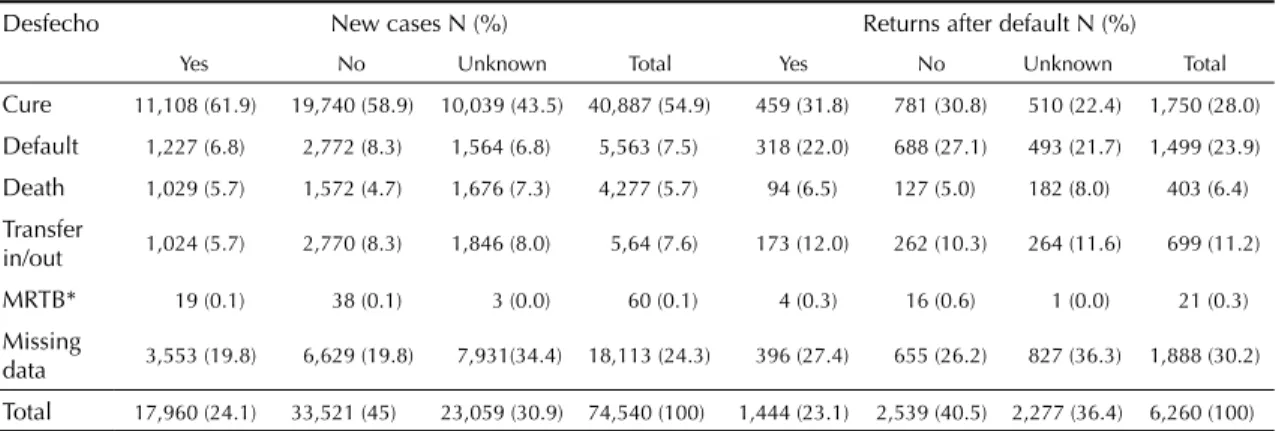
Outcomes were different depending on case status. New BK cases with or without HIV co-infection had higher cure rates than total new cases. Cure rates of new cases with HIV co-infection, relapses and returns were lower than those found for total new cases and cure rate of returns was lower than relapses and even lower than that found in HIV-infected TB cases. Death among new HIV-infected TB cases was about three times higher than that seen in total new cases. Relapses and returns had greater missing outcome data. Defaults were about three times higher for cases previously returning after default compared to total new cases (Table 5). Information on treatment schedule (supervised or self-administered) is still scarce nationwide. This data was missing in 30.9% of new cases, 37.9% of relapses and 36.4% of returns. Table 6 shows higher cure rates and lower default and transfer rates for new cases receiving supervised treatment. A larger number of cases with missing outcome information was seen in records where data on treatment schedule was unknown or missing; and a larger number of deaths was found in supervised compared to self-administered treatment cases. Table 6 also shows outcomes of returns after default by treatment schedule. Similarly to new cases, returns under supervised treatment showed higher cure and death rates as well as lower defaults compared to
Table 1. TB incidence and incidence rate per 100,000 inhabitants (all forms, pulmonary and BK pulmonary) per year of notifi cation. Brazil, 2000–2004.
Year
Incidence Rates*
Total new cases
New pulmonary cases New cases New pulmonary cases
N (%) BK+ N (%) BK+
2000 70,086 60,407 (86.2) 37,560 (53.6) 41.3 35.6 22.1
2001 70,384 60,312 (85.7) 37,260 (52.9) 40.8 35.0 21.6
2002 72,516 61,925 (85.4) 38,402 (53.0) 41.1 35.1 21.8
2003 75,416 64,412 (85.4) 40,269 (53.4) 42.1 36.0 22.5
2004 74,540 63,632 (85.4) 39,373 (52.8) 41.0 35.0 21.7
Source: Sinan
* Excluded records with missing sex, age or code of residence municipality. BK: bacillary.
Table 2. Number and proportion of new TB cases (all forms) notifi ed in capitals, capitals or other municipalities of metropolitan areas and priority PNCT municipalities. Brazil, 2004.
Region Total Priority municipality
N (%)
Metropolitan area N (%)
Capital N (%)
North 6,949 5,123 (73.7) 4,224 (60.8) 3,901 (56.1)
Northeast 21,582 14,739 (68.3) 11,808 (54.7) 9,840 (45.6)
Midwest 3,162 2,047 (64.7) 1,604 (50.7) 1,517 (48.0)
Southeast 34,179 28,578 (83.6) 24,321 (71.2) 14,606 (42.7)
South 8,668 5,587 (64.5) 5,406 (62.4) 2,508 (28.9)
Brazil 74,540 56,074 (75.2) 47,363 (63.5) 32,372 (43.4)
16% in Northern region. It is possible that the ratio of BK cases compared to total new cases may have been affected by the percentage of tests not performed: 53.1% nationwide, ranging from 60.7% in the Northern region to 50.1% in the Southeastern region.
The distribution of new cases according to HIV testing was different in Brazilian regions in 2004; more than 75% of cases in Northern and Northeastern region were not tested for HIV. The proportion of cases with ongoing HIV testing was high, above 10%, in all regions and as high as 26.8% in the Southeastern region. Southern and Southeastern regions shower higher percentage of cases with HIV (either positive or negative) results available, 50.5% and 40.6% res-pectively. While the Northern region had the lowest percentage of cases with results available (9%), it showed the highest rate of positive cases (35%). Of all cases with HIV results available, 24.2% were positive nationwide.
The distribution of new cases by treatment schedule was signifi cantly different in all regions in 2004. Sou-theastern region had the lowest proportion of cases under supervised treatment (14.6%) and the highest with unknown treatment schedule (51.9%). The Mi-returns under self-administered treatment. However,
regardless of treatment schedule, cure was seen in about half of return cases and default was three times as high when compared to new cases.
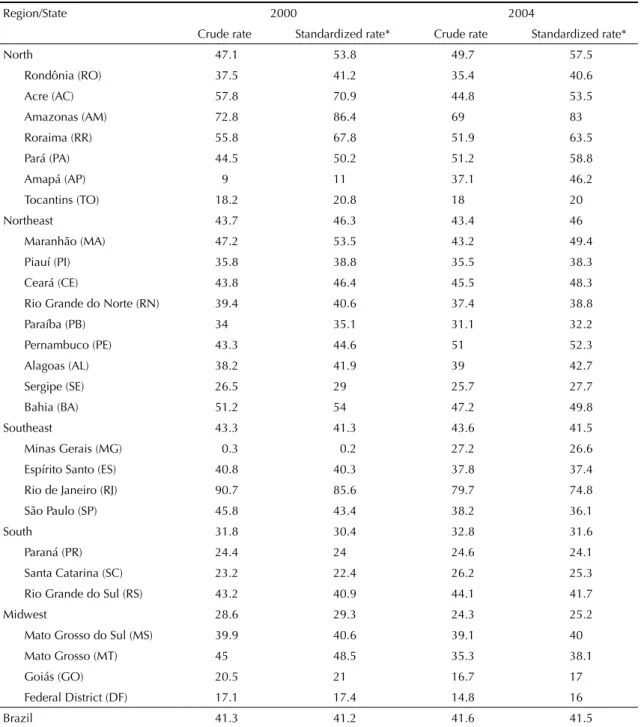
States and regions share to the total number of cases was quite similar except in the states of Minas Gerais and Amapá, where incidence rates signifi cantly in-creased over the study period. In 2004, 45.9% of new cases were notifi ed in the Southeastern region, 29% in Northeastern, 11.6% in Southern, 9.3% in Northern and 4.2% in Midwestern region. Table 7 shows crude and standardized rates (estimated based on municipality of residence) for each state and region. In most Brazilian states there was a difference between the number of cases notifi ed and the number of residents; for instance in the Federal District where there were 36.4% more notifi ed cases than residents. In 2004, those states with more new cases were São Paulo, Rio de Janeiro and Bahia whereas those with higher standardized rates were Amazonas, Rio de Janeiro, and Roraima. Nationwide, 25% of new cases did not undergo sputum bacilloscopy for diagnosis in 2004. This proportion was 27.1% in the Southeastern region, 24.9% in Southern and Northeastern regions, 22.1% in Midwestern, and
Table 4. Outcome of new TB cases. Brazil, 2000–2004.
Outcome status 2000
N (%)
2001 N (%)
2002 N (%)
2003 N (%)
2004 N (%)
Cure 47,676 (68.0) 47,133 (67.0) 47,782 (65.9) 49,286 (65.4) 40,887 (54.9)
Default 8,674 (12.4) 8,146 (11.6) 7,291 (10.1) 7,033 (9.3) 5,563 (7.4)
Death 4,562 (6.5) 4,254 (6.0) 4,437 (6.1) 4,651 (6.1) 4,277 (5.7)
Transfer in/out 4,158 (6.0) 4,090 (5.8) 4,601 (6.3) 5,502 (7.3) 5,640 (7.6)
MRTB* 17 (0.0) 19 (0.0) 51 (0.1) 51 (0.1) 60 (0.1)
Missing data 4,999 (7.1) 6,742 (9.6) 8,354 (11.5) 8,893 (11.8) 18,113 (24.3)
Total 70,086 70,384 72,516 75,416 74,540
Source: Sinan
* MRTB: Multiresistant tuberculosis
Table 3. Category of TB cases notifi ed by year of notifi cation. Brazil, 2000–2004.
Category 2000
N (%)
2001 N (%)
2002 N (%)
2003 N (%)
2004 N (%)
New case 70,086 (84.6) 70,384 (86.8) 72,516 (87.6) 75,416 (89.3) 74,540 (89.9)
Relapse after cure 5,983 (7.3) 5,330 (6.6) 4,842 (5.8) 3,947 (4.7) 3,274 (4.0)
Return after default 4,679 (5.6) 2,896 (3.6) 2,303 (2.8) 1,810 (2.1) 1,525 (1.8)
Transfer in/out 838 (1.0) 698 (0.8) 1,663 (2.0) 1,667 (2.0) 2,047 (2.5)
Change in diagnosis* 1,212 (1.4) 1,287 (1.6) 1,377 (1.7) 1,565 (1.8) 1,423 (1.7)
Missing data 54 (0.1) 534 (0.6) 107 (0.1) 38 (0.1) 45 (0.1)
Total 82,852 81,129 82,808 84,443 82,854
Source: Sinan
dwestern region had the highest proportion of cases under supervised treatment (40.2%).
Regions differed regarding outcome of new cases. The 85% cure of new cases was not seen in any clinical form. The Southeastern region had the lowest cure rate (39.3%) possibly due to the large number of new cases with missing outcome information.
The states of Rio de Janeiro, São Paulo and Rio Grande do Norte had higher unknown or missing outcome data and thus had the lowest cure rates. The states of Acre, Roraima, Sergipe and Espírito Santo had 80% or more of cure of new cases. Roraima was the single state to reach cure rates above 85% for new cases despite the small proportion of cases with missing outcome information.
Outcomes of cases diagnosed in 2004 in metropolitan areas showed also a heterogeneous pattern for both total new cases and new BK cases. Comparison was hindered between metropolitan areas due to different proportion of cases with missing outcome information.
Of all new cases, including those with missing outcome information, the metropolitan areas of Natal (RN), Vale do Aço (MG), Baixada Santista (SP) and Rio de Janeiro (RJ) had cure rates lower than 31%. In the regions of Núcleo and Expansão do Vale do Itajaí (SC), northern and northeastern Santa Catarina (SC), Vitória (ES) and Expansão de Tubarão (SC) 80% or more cure rate was found. Considering only new BK cases, including those with missing outcome information, besides the afore-mentioned regions, the metropolitan areas of Núcleo de Tubarão (SC) and Petrolina/Juazeiro (PE) had also cure rates of 80% or more.
Table 8 shows that all regions had higher proportion of outcome fi elds left blank in new cases under supervised than self-administered treatment. Of total new cases notifi ed, cure rate of cases under supervised treatment were higher than those found for self-administered treatment cases in the Northern and Northeastern re-gions but were similar in Southeastern, Southern, and Midwestern regions.
Table 5. TB case distribution by outcome and categories. Brazil, 2004.
Outcome status
New case
N (%)
New BK pulmonary
case** N (%)
New HIV case
N (%)
New HIV BK pulmonary
N (%)
Relapse
N (%)
Return
N (%)
Transfer in/out
N (%)
Cure 40,887 (54.9) 35,205 (55.3) 1,849 (34.8) 637 (37.0) 2,649 (46.0) 1,750 (28.0) 1,156 (53.7)
Default 5,563 (7.4) 4,934 (7.8) 537 (10.1) 186 (10.8) 554 (9.6) 1,499 (24.0) 176 (8.2)
Death 4,277 (5.7) 3,561 (5.6) 954 (18.0) 294 (17.1) 390 (6.8) 403 (6.4) 85 (4.0)
Transfer in/out 5,640 (7.6) 4,704 (7.4) 591 (11.0) 197 (11.4) 469 (8.2) 699 (11.2) 369 (17.2)
MRTB* 60 (0.1) 55 (0.1) 3 (0.1) 1 (0.1) 23 (0.4) 21 (0.3) 6 (0.3)
Missing data 18,113 (24.3) 15,173 (23.8) 1,379 (26.0) 408 (23.6) 1,670 (29.0) 1,888 (30.1) 360 (16.6)
Total 74,540 63,632 5,313 1,723 5,755 6,260 2,152
Source: Sinan
*MRTB: Multiresistant tuberculosis ** BK: bacillary
Table 6. Outcome by treatment schedule for new TB cases and returns after default. Brazil, 2004.
Desfecho New cases N (%) Returns after default N (%)
Yes No Unknown Total Yes No Unknown Total
Cure 11,108 (61.9) 19,740 (58.9) 10,039 (43.5) 40,887 (54.9) 459 (31.8) 781 (30.8) 510 (22.4) 1,750 (28.0)
Default 1,227 (6.8) 2,772 (8.3) 1,564 (6.8) 5,563 (7.5) 318 (22.0) 688 (27.1) 493 (21.7) 1,499 (23.9)
Death 1,029 (5.7) 1,572 (4.7) 1,676 (7.3) 4,277 (5.7) 94 (6.5) 127 (5.0) 182 (8.0) 403 (6.4)
Transfer
in/out 1,024 (5.7) 2,770 (8.3) 1,846 (8.0) 5,64 (7.6) 173 (12.0) 262 (10.3) 264 (11.6) 699 (11.2)
MRTB* 19 (0.1) 38 (0.1) 3 (0.0) 60 (0.1) 4 (0.3) 16 (0.6) 1 (0.0) 21 (0.3)
Missing
data 3,553 (19.8) 6,629 (19.8) 7,931(34.4) 18,113 (24.3) 396 (27.4) 655 (26.2) 827 (36.3) 1,888 (30.2)
Total 17,960 (24.1) 33,521 (45) 23,059 (30.9) 74,540 (100) 1,444 (23.1) 2,539 (40.5) 2,277 (36.4) 6,260 (100)
DISCUSSION
The study of TB morbidity and mortality in Brazil is based on data from information health systems mana-ged by the Brazilian Ministry of Health and, in recent years, it has undertaken efforts to improve these infor-mation systems. TB morbidity data confi rm adequate coverage and quality of data from Sinan-TB allowing in-depth epidemiological analyses by geographical region comparisons. This information also supports
decision making in PNCT management at country, state and local level. As a result, regional and state discrepancies and their effect in the analysis of case outcomes became evident especially in the reporting of follow-up variables.
The present study used a database from Sinan-TB after removal of improper repeat records and record linka-ge. It provided lower number of new and retreatment cases and higher cure rates compared to data based
Table 7. Number of new cases and crude and standardized TB incidence rates (all forms) in each region and state by year of notifi cation. Brazil, 2000–2004.
Region/State 2000 2004
Crude rate Standardized rate* Crude rate Standardized rate*
North 47.1 53.8 49.7 57.5
Rondônia (RO) 37.5 41.2 35.4 40.6
Acre (AC) 57.8 70.9 44.8 53.5
Amazonas (AM) 72.8 86.4 69 83
Roraima (RR) 55.8 67.8 51.9 63.5
Pará (PA) 44.5 50.2 51.2 58.8
Amapá (AP) 9 11 37.1 46.2
Tocantins (TO) 18.2 20.8 18 20
Northeast 43.7 46.3 43.4 46
Maranhão (MA) 47.2 53.5 43.2 49.4
Piauí (PI) 35.8 38.8 35.5 38.3
Ceará (CE) 43.8 46.4 45.5 48.3
Rio Grande do Norte (RN) 39.4 40.6 37.4 38.8
Paraíba (PB) 34 35.1 31.1 32.2
Pernambuco (PE) 43.3 44.6 51 52.3
Alagoas (AL) 38.2 41.9 39 42.7
Sergipe (SE) 26.5 29 25.7 27.7
Bahia (BA) 51.2 54 47.2 49.8
Southeast 43.3 41.3 43.6 41.5
Minas Gerais (MG) 0.3 0.2 27.2 26.6
Espírito Santo (ES) 40.8 40.3 37.8 37.4
Rio de Janeiro (RJ) 90.7 85.6 79.7 74.8
São Paulo (SP) 45.8 43.4 38.2 36.1
South 31.8 30.4 32.8 31.6
Paraná (PR) 24.4 24 24.6 24.1
Santa Catarina (SC) 23.2 22.4 26.2 25.3
Rio Grande do Sul (RS) 43.2 40.9 44.1 41.7
Midwest 28.6 29.3 24.3 25.2
Mato Grosso do Sul (MS) 39.9 40.6 39.1 40
Mato Grosso (MT) 45 48.5 35.3 38.1
Goiás (GO) 20.5 21 16.7 17
Federal District (DF) 17.1 17.4 14.8 16
Brazil 41.3 41.2 41.6 41.5
on crude information. The analysis report of record linkage/removal from Sinan-TB database is described elsewhere.1 Whether or not to approve incidence rates
obtained after record linkage/removal process from Sinan-TB database is under discussion in the Ministry of Health. Its approval basically relies on the quality (no improper repeat records) of database routinely sent by municipalities to the central level.
Increased number of new cases notifi ed in the period 2000–2003 can be partially explained by increased TB notifi cations in Sinan. This is evidenced not only by increased number of new cases notifi ed in Minas Gerais but also by a reduction in the ratio and population size of municipalities where no cases were notifi ed during the period studied. The fact that a minority of large-size municipalities did not have any case notifi cation can be suggestive of large – yet in small number – areas of underreporting. This hypothesis needs further in-vestigation in fi eld studies, follow-up of new cases in the next years and result analysis of other database linkage studies.5 In addition, there is a need for studies
to explore spatial distribution of TB cases notifi ed in a municipality to locally detect potential areas of underreporting.6 These studies are needed given the
discrepancy in the rate found in the present study and WHO estimated rate (41 and 62 per 100,000 inhabi-tants, respectively).7 Brazilian Ministry of Health is
required to ascertain consistence and quality stability of data from Sinan-TB regarding coverage, inexistence of improper repeat records and data consistence in order to properly request for a review of WHO estimates on TB incidence rate in Brazil.
The period studied did not allow to evidence a reduction of TB transmission in Brazil. However, the slightly increasing number of new TB cases in younger age groups can be regarded as an indirect evidence of reduced transmission.2 This reduction is aligned with
the trend seen in aggregate data, which have been col-lected and analyzed by state health departments since pre-Sinan implementation. In order to describe the historical trend of TB morbidity in Brazil it is required a comparison of recent data with data from 1980s and 1990s published by the Brazilian Ministry of Health Surveillance Department.3,4
Moreover, it can be noted that 2004 data follows the same trends seen over the last two decades: clustering of TB cases in capitals, metropolitan areas and PNCT priority municipalities, mostly in the states of São Paulo and Rio de Janeiro; high incidence rates in Rio de Janeiro and Amazon states; prevalence of pulmonary forms especially in more advanced age groups; and high prevalence of TB-AIDS comorbidity especially in the Southeastern region.3,4,* The study sought to
stress differences in the proportions of each outcome category when cases with missing outcome information were included or not. These differences were even more remarkable when results were broke down by states. Cases with missing outcome information are likely to have more defaults and transfers than cures. Thus, to prevent bias while generalizing cases with proper outcome record as representative of total cases, it is key to epidemiologically ascertain there are no differences between cases with and without missing information.
Table 8. Outcome of new TB cases by treatment schedule and regions. Brazil, 2004.
Outcome Cure Default Death Transfer
in/out
MRTB* Missing data Total
N (%) N (%) N (%) N (%) N (%) N (%) N
Supervised treatment
North 1,723 (70.2) 215 (8.8) 150 (6.1) 159 (6.5) 2 (0.1) 204 (8.3) 2,453
Northeast 5,030 (70.2) 524 (7.3) 363 (5.1) 400 (5.6) 10 (0.1) 841 (11.7) 7,168
Southeast 2,025 (40.5) 244 (4.9) 229 (4.5) 225 (4.5) 1 (0.0) 2,279 (45.6) 5,003
South 1,437 (69.6) 150 (7.3) 189 (9.1) 141 (6.8) 0 (0.0) 149 (7.2) 2,066
Midwest 893 (70.3) 94 (7.4) 98 (7.7) 99 (7.8) 6 (0.5) 80 (6.3) 1,270
Brazil 11,108 (61.9) 1,227 (6.8) 1,029 (5.7) 1,024 (5.7) 19 (0.1) 3,553 (19.8) 17,960
Self-admi-nistered treatment
North 2,477 (65.3) 331 (8.7) 175 (4.6) 682 (18.0) 6 (0.2) 122 (3.2) 3,793
Northeast 7,103 (66.7) 939 (8.8) 461 (4.3) 1,123 (10.6) 18 (0.2) 1,003 (9.4) 10,647
Southeast 4,686 (40.9) 817 (7.1) 336 (2.9) 486 (4.3) 6 (0.1) 5,120 (44.7) 11,451
South 4,358 (72.1) 528 (8.7) 486 (8.0) 350 (5.9) 8 (0.1) 316 (5.2) 6,046
Midwest 1,116 (70.5) 157 (9.9) 114 (7.2) 129 (8.1) 0 (0.0) 68 (4.3) 1,584
Brazil 19,740 (58.9) 2,772 (8.3) 1,572 (4.6) 2,770 (8.3) 38 (0.1) 6,629 (19.8) 33,521
*MRTB: Multiresistant tuberculosis
Low cure rates of HIV-infected cases and returns after default indicate the need for public policies specifi cally targeting these populations. Directly Observed Treat-ment Strategy (DOTS) was impleTreat-mented in Brazil by the end of 1990s and this strategy has sought to bridge this gap, yet inconsistently and primarily, in many Brazilian municipalities.7 Data on DOTS coverage
are inconsistently collected and sometimes are simply approximate estimates reported by local PNCT teams. The methodological approach usually applied for es-timating DOTS coverage in Brazil reports the number of health units with at least one case under supervised treatment.7 Furthermore, the only supervised treatment
variable from Sinan-TB database has almost one-third of missing information and requires to be validated for inclusion in epidemiological studies. This variable reporting has become mandatory only by the end of 2004 in Sinan-TB version 6.0 but there is still the option “unknown supervised treatment,” which means non-reporting.
There may have been pre-selection of cases referred to supervised treatment. This is probably due to the fact that health units in Brazil do not have available provi-ders generally trained for supervised treatment and/or they are not available in suffi cient number to meet the needs. Outcome must be carefully interpreted for new cases and returns under supervised or self-administered treatment and study authors chose to present these data
to establish parameters for further comparisons. Missing information hinders description of TB-AIDS cases as well. The study data reveal heterogeneity of comorbidity cases in the different regions but the pro-portion of cases with no or “ongoing” HIV testing in the Northern, Northeastern, and Midwestern regions prevents actual comparisons and hinders the analysis on current status of this comorbidity in Brazil. Linkage studies of Sinan-TB database could bridge this gap. Of all Brazilian states, Roraima was the single one to achieve the goal of 85% cure for new BK cases establi-shed by WHO,5 despite missing outcome information in
some cases. Even in a small universe of cases, cure rate achieved in this state is remarkable within the Brazilian national system. Other states and some highly populated metropolitan areas were also able to attain or come close to this goal, indicating that the small number of cases is not a determinant for this achievement.
In conclusion, wide differences were found between states regarding incidence and outcome. In order to achieve the cure goal for new BK cases and increase cure rates of HIV-infected cases and returns additional efforts are required by PNCT. They include surveillance of cases aiming at increasing records with outcome information and timely reporting as well as scaling up directly supervised therapy strategy.
1. Bierrenbach AL, Stevens AP, Gomes ABF, Noronha EF, Glatt R, Carvalho CN, et al. Efeito da remoção de notifi cações repetidas sobre a incidência
da tuberculose no Brasil. Rev Saude Publica.
2007;41(Supl. 1):????
2. Chaimowicz F. Age transition of tuberculosis
incidence and mortality in Brazil. Rev Saude Publica.
2001;35(1):81-7.
3. Centro de Referência Prof. Hélio Fraga. Secretaria de Vigilância em Saúde. Ministério da Saúde. Análise da situação de tuberculose nos anos noventa e início da
década atual. Bol Pneumol Sanit. 2005;13(3):133-87.
4. Coordenação Nacional de Pneumologia Sanitária. Reunião de avaliação operacional e epidemiológica
do programa nacional de controle da tuberculose na
década de 80. Bol Pneumol Sanit. 1993; Spec
No1:1-90.
5. Façanha MC. Tuberculose: subnotifi cação de casos
que evoluíram para óbito em Fortaleza-CE. Rev Bras
Epidemiol. 2005;8(1):25-30.
6. Souza WV, Albuquerque MFM, Barcellos CC, Ximenes RAA, Carvalho MS. Tuberculose no Brasil: construção
de um sistema de vigilância de base territorial. Rev
Saude Publica. 2005;39(1):82-9.
7. World Health Organization. Global tuberculosis control - surveillance, planning, fi nancing. WHO report 2005. Geneva; 2005. (WHO/HTM/ TB/2005.349).
REFERENCES