Rev Odontol UNESP. 2016 Nov-Dec; 45(6): 356-361 © 2016 - ISSN 1807-2577
ORIGINAL ARTICLE
Doi: http://dx.doi.org/10.1590/1807-2577.05816
Volumetric and cephalometric evaluation of the upper airway of
class III patients submitted to maxillary advancement
Avaliação volumétrica e cefalométrica da via aérea superior em pacientes classe III submetidos a
avanço de maxila
hais Mazeu SANTIAGO
a, Lucas Borin MOURA
a*, Marisa Aparecida Cabrini GABRIELLI
a,
Rubens SPIN-NETO
b, Valfrido Antonio PEREIRA-FILHO
aaFaculdade de Odontologia de Araraquara, UNESP – Universidade Estadual Paulista, Araraquara, SP, Brasil bFaculty of Health, Aarhus Univesity, Denmark
Resumo
Introdução: A deficiência anteroposterior da maxila pode estar associada com a diminuição do volume da via
aérea superior. O avanço de maxila por resultar em um aumento do espaço aéreo superior. Objetivo: Correlacionar
mensurações cefalométricas (2D) e volumétricas (3D) da via aérea superior em pacientes classe III tratados por meio
de avanço maxilar. Material e método: Este estudo retrospectivo transversal foi realizado em dez pacientes adultos
submetidos ao avanço de maxila para correção de deficiência anteroposterior de maxila e deformidade classe III. Foram incluídos os dados de tomografias computadorizadas Cone beam em dois períodos: pré-operatório (T1) e pós-operatório de 6 a 8 meses (T2). Os arquivos DICOM foram importados e reconstruídos para avaliação volumétrica e cefalométrica da via aérea superior, dividida em nasofaringe, orofaringe e hipofaringe (Arnett & Gunson FAB
Surgery). Resultado: A idade variou de 26 a 55 anos, com média de 36,3±9,2 anos. Não foram verificadas diferenças
estatisticamente significantes para os parâmetros cefalométricos e volumétricos das três regiões da faringe entre os períodos T1 e T2. Este resultado ocorreu devido à pequena quantidade de avanço maxilar (4,7±1,89mm) necessário para a correção da deformidade na amostra. A correlação entre área e volume não foi estatisticamente significante apenas para as mensurações pré-operatórias da nasofaringe (r=0,30; p=0,40). Nas outras regiões e períodos a correlação
foi estatisticamente significante (p<0,05). Conclusão: Avanços maxilares de pequenas dimensões não resultam em
um aumento significativo das dimensões da via aérea superior.
Descritores: Cirurgia ortognática; remodelação das vias aéreas; maxila.
Abstract
Introduction: Anteroposterior maxillary deficiency can be associated with a decrease of upper airway volume.
Maxillary advancement can improve the upper airway space. Aim: To correlate cephalometric (2D) and volumetric
(3D) measurements of the upper airway in class III patients treated by maxillary advancement. Material and
method: This retrospective transversal study was performed in ten adult patients submitted to maxillary advancement for correction of class III deformity secondary to maxillary anteroposterior deficiency. The Cone beam tomography files included in the medical records were used: (T1) pre-operative and (T2) 6 to 8 months postoperative. The DICOM files were imported and reconstructed for volumetric and cephalometric evaluation of the upper airway, as divided into
nasopharynx, oropharynx and hypopharynx (Arnett & Gunson FAB Surgery). Result: Age ranged from 26 to 55 years
with a mean of 36.3±9.2 years. There were no statistically significant differences for cephalometric and volumetric parameters of the three pharyngeal regions between T1 and T2 periods. This was due to the small amount of maxillary advancement necessary to correct the maxillary deformity in the studied patients (4.7±1.89mm). The correlation between area and volume was not statistically significant only for preoperative measurements of the nasopharynx
(r=0.30, p=0.40). It was significant for the other regions and evaluation periods (p<0.05). Conclusion: Small maxillary
advancements do not result in significant increases in airway dimensions.
INTRODUCTION
Anteroposterior maxillary deiciency can be associated with obstructive sleep apnea syndrome (OSA) as a result of the improper positioning of sot tissues and decreased volume of the upper airway
(UA)1. Orthognathic surgery is used as adjunctive treatment for
OSA through large maxillomandibular advancements of at least 10 mm, aiming to increase the space of the UA by repositioning
the sot tissues2,3.
Class III dentoskeletal deformity usually results from anteroposterior maxillary deiciency and/or mandibular excess. he correction of this deformity by mandibular setbacks alone may cause narrowing of the UA and predisposition to the occurrence of
OSA1,4. herefore, the treatment is preferably performed by isolated
maxillary advancement or bimaxillary surgery, aiming for the anterior repositioning of the sot palate tissues and velopharyngeal
musculature, facial deformity correction, and increased UA space1,5,6.
he evaluation of facial structures and UA can be accomplished using cephalometric radiographs and CT scans. However, the examination of the airways by radiographs has limitations because only basic and permeability measurements can be visualized, and speciically, the size and shape of the UAs can be changed by the
head and patient position7,8. Computed tomography is the gold
standard of examination to visualize the facial skeleton and airspace structures, allowing the measurement of the size and volume of
UA and location of the narrowing areas9,10.
he objective of this study was to correlate (2-dimensional (2D)) cephalometric measurements to (3-dimensional (3D)) volumetric measurements of the preoperative and postoperative upper airways in Class III non-OSA patients treated with maxillary advancement.
MATERIAL AND METHOD
his study was approved by the Research Ethics Committee of the School of Dentistry of Araraquara - University of Sao Paulo State, Brazil, under the registration number CEP 1.363.419.
Sample Selection
A retrospective analysis was performed on the image database of patients submitted to orthognathic surgery, and they were selected in descending chronological order. Included in the sample were medical records of patients with Class-III skeletal deformities submitted to maxillary advancement surgery by Le Fort I osteotomy and ixation with plates and screws and pre- and postoperative cone beam computed tomography (CBCT) scans. Syndromic patients, those presenting orofacial clets, and patients who underwent bimaxillary or segmental surgery or other procedures in addition to the maxillary advancement were excluded.
Data Collection
To evaluate the UA, a single appropriately trained researcher collected data including the medical records and CBCT scans obtained in in two periods as follows: (T1) immediate preoperative
and (T2) postoperative from 6 to 8 months. Data were included in a speciic study table for analysis purposes.
CBCT scans were obtained using a volumetric CT scanner for dentofacial images (I-Cat, KaVo do Brasil Ind. Com. Ltda. - Joinville, SC), for which patients were positioned with the head in a neutral position and told not to swallow during imaging. Data were imported and reconstructed with the sotware Dolphin Imaging 11 (Dolphin Imaging and Management Solutions, Chatsworth, CA, USA) for volumetric (3D) and cephalometric (2D) analysis of the UA, and the 3D volume was positioned according to the anatomical references, allowing the same position for all measurements.
Volumetric Evaluation (3D) of the UA
he images of sagittal sections of the airway were selected, and planes were formulated to deine the upper and lower limits. Using anatomical references, the limits of the upper airway (Figure 1) were determined, and the volumes were split into the following:
• Nasopharynx: he upper limit was determined by a straight
line parallel to the Frankfurt plane passing through point A to a point on the posterior pharyngeal wall. he lower limit was given by a straight line, also parallel to the Frankfurt plane, passing through the upper incisor edge to a point on the posterior pharyngeal wall.
• Oropharynx: he upper limit was determined by a straight
line parallel to the Frankfurt plane passing through the central upper incisor edge to a point on the posterior pharyngeal wall. he lower limit was a straight line, also parallel to the Frankfurt plane, passing through point B to a point on the posterior pharyngeal wall.
• Hypopharynx: he upper limit was determined by a straight
line parallel to the Frankfurt plane passing through point B
to a point on the posterior pharyngeal wall. he lower limit was a straight line, also parallel to the Frankfurt plane, passing through point M to a point on the posterior pharyngeal wall.
From these planes, a volumetric analysis of the area conigured in 3 dimensions was performed using the grey grading scale, determining the airway space. From the sum of the volumes, the sotware performed the 3D calculation, showing the volume in cubic millimeters of the upper airway and its regions.
Cephalometric Evaluation (2D) of the UA
Ater the insertion of DICOM images the CT scanner generated in the sotware, a lateral cephalometric radiograph was generated using the speciic tool. he cephalometric points were plotted on the lateral preoperative and postoperative lateral cephalometric radiograph using the analysis of Arnett-Gunson FAB surgery (Figure 2). he demarcation of the cephalometric points was digitally performed in a low-light environment.
he cephalometric points of interest were the following:
• A/G anterior UA point A - anterior wall of the nasopharynx
passing through bone point A.
• A/G posterior UA point A - posterior wall of the nasopharynx
passing through bone point A.
• A/G anterior UA point S1 - anterior wall of the oropharynx
passing through the central upper incisor edge.
• A/G posterior UA point S1 - posterior wall of the oropharynx
passing through the central upper incisor edge.
• A/G anterior UA point B - anterior wall of the hypopharynx
passing through bone point B.
• A/G UA posterior point B - posterior wall of the hypopharynx
passing through bone point B.
he UA was evaluated with linear measurements at 3 diferent levels: the nasopharynx, oropharynx, and hypopharynx regions. he nasopharynx corresponds to a linear measurement between points A/G anterior UA-point A and A/G posterior UA-point A; the oropharynx corresponds to a linear measurement between points A/G anterior UA-point S1 and A/G posterior UA-point S1. he hypopharynx corresponds to a linear measurement between points A/G anterior UA-point B and A/G posterior UA-point B.
Statistical Analysis
he data evaluated presented normal distribution, and parametric tests were used for inferential statistics. For intra-examiner calibration, measurements were performed in duplicate with an interval of one month between them. Reproducibility was estimated by the intra-class correlation (ICC) coeicient. For correlation analysis between
the cephalometric (mm2) and volumetric (mm3) measurements
of the oropharynx, nasopharynx and hypopharynx regions in the pre- and postoperative periods, the Pearson correlation coeicient
(r) was used, and the signiicance was tested using a paired t-test
at a signiicance level of 95%.
RESULT
he study included 10 patients who had been submitted to maxillary advancement surgery: 6 men and 4 women. he ages ranged from 26 to 55 years old, with an average age of 36.3 ± 9.2 years. he average anteroposterior maxillary advance was 4.7 ± 1.89 mm.
The intra-examiner reproducibility for volumetric and cephalometric analysis in T1 and T2 was high (ICC = 0.99 for volume measures; ICC = 0.96 for area measurements), so the average of the measurements was used as representative sample of each evaluation.
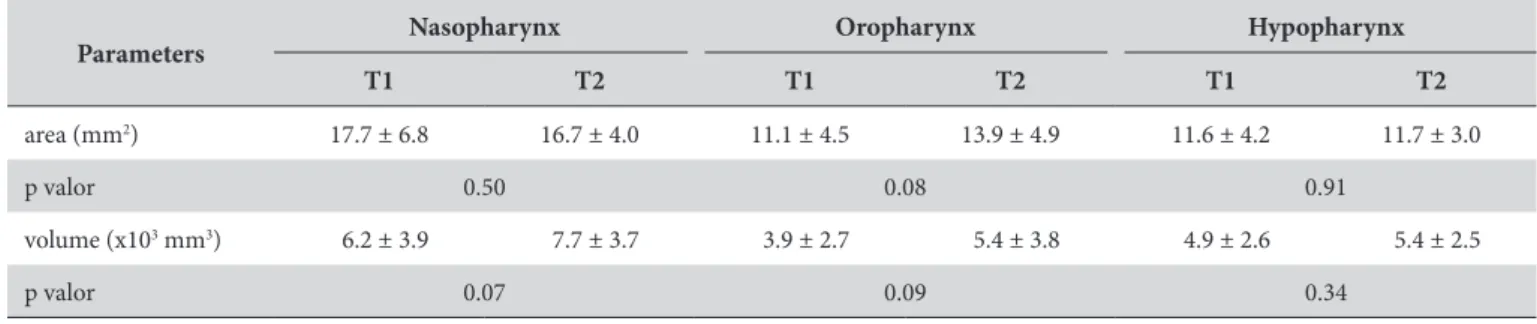
he cephalometric analysis of UA space between the pre-and postoperative periods showed decreased mean values of the nasopharynx; those related to the oropharynx were increased, and those related to hypopharynx were maintained. he volumetric analysis showed an average gain in the values of all regions of the UA (Table 1). However, these diferences were not statistically signiicant.
he correlation between the two evaluation methods was high
and statistically signiicant (p <0.05) for all parameters, except for
the correlation of preoperative values for the nasopharynx (r = 0:30;
p =0.40). he correlation values are shown in Table 2.
DISCUSSION
Treatment of dentoskeletal deformities is performed through orthognathic surgery. Currently, in patients with Class-III deformities, only 10% of cases are treated by mandibular setback procedure alone; in 40% bimaxillary surgery is performed, and in 50% an
isolated maxillary advancement is performed11. One factor that
can explain this distribution is the impact of such procedures on
the UA, as the mandibular setback promotes a decrease of airway space due to anteroposterior narrowing in the oropharynx and
hypopharynx regions12 and can result in an OSA6,13,14.
Lee et al.13 report that the volume of the pharynx and its
3 areas – the nasopharynx, oropharynx, and hypopharynx – are inluenced by changes in the jaw position at the level of the upper sot palate, posterior nose, and nasopharyngeal space regions. he maxillary advancement procedure causes an enlargement of UA in the nasopharyngeal and retropalatal areas and a subsequent
increase in the dimensions and volume of the airway space12.
Although the repositioning is anteroposterior, the increase of
the UA dimensions is mainly in the transverse direction15,16. Per
Pereira-Filho et al’s1 study, the maxillary advancement procedure,
when compared to the mandibular setback and bimaxillary surgery procedures, showed the highest stability in the anteroposterior increase of the UA due to the repositioning of the sot palate tissues and muscles.
he sample evaluated in this study showed no statistically signiicant changes in the airway space and its regions between the pre- and postoperative periods in both the cephalometric and volumetric methods of analysis. here are two possible causes for this result. One factor is the sample size of the retrospective analysis, which may have caused a type-II error without enough statistical power to reject the null hypothesis. he second factor is the small dimension of the maxillary advancement performed in more than 30% of the sample. he patients with more than 6 mm of advancement show a quantitative incensement of UA volume in the nasopharynx region, which suggests that large movements may cause an improvement in UA. However, this result agrees with
Fernández-Ferrer et al.6 review in which the maxillary advancement
procedure does not result in signiicant changes in the oropharynx and hypopharynx regions.
Cephalometric analysis is traditionally used for radiographic evaluation of the UA. Although this method is useful for analysis
Table 1. Mean and standard deviation of cephalometric (area) and volumetric (volume) measurements, paired T test between pre and postoperative measurements, signiicance level of 95%
Parameters Nasopharynx Oropharynx Hypopharynx T1 T2 T1 T2 T1 T2
area (mm2) 17.7 ± 6.8 16.7 ± 4.0 11.1 ± 4.5 13.9 ± 4.9 11.6 ± 4.2 11.7 ± 3.0
p valor 0.50 0.08 0.91
volume (x103 mm3) 6.2 ± 3.9 7.7 ± 3.7 3.9 ± 2.7 5.4 ± 3.8 4.9 ± 2.6 5.4 ± 2.5
p valor 0.07 0.09 0.34
Table 2. Analysis and correlation between cephalometric and volumetric measurements in UA regions pre and postoperative. Maxillary advancement according to patient
P
ati
en
t
Pre-operative Postoperative
M
axi
ll
ar
y A
d-va
nc
eme
n
t (mm)
Nasopharynx Oropharynx Hypopharynx Nasopharynx Oropharynx Hypopharynx Area Volume Area Volume Area Volume Area Volume Area Volume Area Volume
1 36.4 3.37 17.1 7.12 15.7 2.40 25.2 8.31 13.8 4.05 18.1 3.14 7
2 13.7 1.67 8.2 3.32 9.3 4.05 10.4 2.53 10.3 1.53 8.1 4.10 3
3 15.6 1.18 10.5 6.67 8.4 3.28 20.4 11.47 10.2 3.76 10.6 3.45 7
4 18.9 9.78 20.9 16.68 16.8 8.27 18.9 15.18 13.9 8.91 16.8 7.05 2
5 15.8 1.19 5.6 1.77 6.6 2.52 14.5 2.87 7.0 1.77 10.8 3.04 5
6 19.7 6.52 13.0 8.36 19.1 10.28 18.5 8.72 15.1 8.08 18.8 9.66 4
7 18.6 1.73 7.0 5.16 6.0 2.07 14.6 6.98 6.1 1.67 6.2 2.42 6
8 10.5 3.81 9.7 4.46 11.1 4.31 14.5 5.60 13.4 4.29 13.7 6.07 5
9 12.6 3.12 7.8 4.11 10.2 6.12 13.2 5.18 12.9 5.50 12.9 5.30 6
10 15.5 6.26 11.3 4.20 13.3 6.59 17.0 10.37 14.8 14.27 22.8 9.71 2
r= 0.30 0.78 0.76 0.65 0.87 0.78
p= 0.4 0.007* 0.01* 0.04* 0.001* 0.008*
in the sagittal plane, it has limitations, including overlapping of images and difficult delimitation between the structures, and it
does not capture the airway width11,13,15. Computed tomography
is one of the best methods for evaluating 3D structures of the UA
and facial skeleton15-17. Among its advantages is the evaluation
of the regions in the coronal, axial, and sagittal planes; the visualization of soft and hard tissues; and the possibility of
segmentation for volumetric analysis8,11-13. However, image
acquisition in both methods may be impaired due to the position of the head and tongue, breathing, and time necessary for the
scanning procedure8,18,19.
In this sample, there were statistical diferences between cephalometric and volumetric analysis and a positive correlation between the evaluated parameters, except for the preoperative assessment of the nasopharyngeal region. hus, both methods can be used to evaluate the UA space. However, the reported beneits of CT allows analysis in greater detail.
In conclusion, the results showed that the UA volume and area were not modiied by the maxillary advancement procedure. However, the sample size and small maxillary advancement are possible reasons for this result. he evaluation of the UA space through cephalometric and volumetric analysis shows a positive correlation.
REFERENCES
1. Pereira-Filho VA, Castro-Silva LM, de Moraes M, Gabrielli MF, Campos JA, Juergens P. Cephalometric evaluation of pharyngeal airway space changes in class III patients undergoing orthognathic surgery. J Oral Maxillofac Surg. 2011 Nov;69(11):e409-15. PMid:21757274. http://dx.doi.org/10.1016/j.joms.2011.02.132.
2. Doff MH, Jansma J, Schepers RH, Hoekema A. Maxillomandibular advancement surgery as alternative to continuous positive airway pressure in morbidly severe obstructive sleep apnea: a case report. Cranio. 2013 Oct;31(4):246-51. PMid:24308097. http://dx.doi.org/10.1179/ crn.2013.31.4.001.
3. Zinser MJ, Zachow S, Sailer HF. Bimaxillary ‘rotation advancement’ procedures in patients with obstructive sleep apnea: a 3-dimensional airway analysis of morphological changes. Int J Oral Maxillofac Surg. 2013 May;42(5):569-78. PMid:23177930. http://dx.doi.org/10.1016/j. ijom.2012.08.002.
4. Chen F, Terada K, Hua Y, Saito I. Effects of bimaxillary surgery and mandibular setback surgery on pharyngeal airway measurements in patients with Class III skeletal deformities. Am J Orthod Dentofacial Orthop. 2007 Mar;131(3):372-7. PMid:17346593. http://dx.doi. org/10.1016/j.ajodo.2005.06.028.
5. Andrews BT, Lakin GE, Bradley JP, Kawamoto HK Jr. Orthognathic surgery for obstructive sleep apnea: applying the principles to new horizons in craniofacial surgery. J Craniofac Surg. 2012 Nov;23(7 Suppl 1):2028-41. http://dx.doi.org/10.1097/SCS.0b013e31825d05bb. PMid:23154379.
6. Fernández-Ferrer L, Montiel-Company JM, Pinho T, Almerich-Silla JM, Bellot-Arcís C. Effects of mandibular setback surgery on upper airway dimensions and their influence on obstructive sleep apnoea: a systematic review. J Craniomaxillofac Surg. 2015 Mar;43(2):248-53. PMid:25547214. http://dx.doi.org/10.1016/j.jcms.2014.11.017.
7. Güven O, Saraçoglu U. Changes in pharyngeal airway space and hyoid bone position after body ostectomies and sagittal split ramus osteotomies. J Craniofac Surg. 2005 Jan;16(1):23-30. PMid:15699641. http://dx.doi.org/10.1097/00001665-200501000-00007.
8. Guijarro-Martínez R, Swennen GRJ. Cone-beam computerized tomography imaging and analysis of the upper airway: a systematic review of the literature. Int J Oral Maxillofac Surg. 2011 Nov;40(11):1227-37. PMid:21764260. http://dx.doi.org/10.1016/j.ijom.2011.06.017.
9. Alsufyani NA, Al-Saleh MA, Major PW. CBCT assessment of upper airway changes and treatment outcomes of obstructive sleep apnoea: a systematic review. Sleep Breath. 2013 Sep;17(3):911-23. PMid:23344828. http://dx.doi.org/10.1007/s11325-012-0799-7.
10. Barrera JE. Virtual surgical planning improves surgical outcome measures in obstructive sleep apnea surgery. Laryngoscope. 2014 May;124(5):1259-66. PMid:24357526. http://dx.doi.org/10.1002/lary.24501.
11. Gokce SM, Gorgulu S, Gokce HS, Bengi AO, Karacayli U, Ors F. Evaluation of pharyngeal airway space changes after bimaxillary orthognathic surgery with a 3-dimensional simulations and modeling program. Am J Orthod Dentofacial Orthop. 2014 Oct;146(4):477-92. PMid:25263151. http://dx.doi.org/10.1016/j.ajodo.2014.06.017.
12. Giarda M, Brucoli M, Arcuri F, Benech R, Braghiroli A, Benech A. Efficacy and safety of maxillomandibular advancement in treatment of obstructive sleep apnoea syndrome. Acta Otorhinolaryngol Ital. 2013 Feb;33(1):43-6. PMid:23620639.
13. Lee Y, Chun YS, Kang N, Kim M. Volumetric changes in the upper airway after bimaxillary surgery for skeletal class III malocclusions: a case series study using 3-dimensional cone-beam computed tomography. J Oral Maxillofac Surg. 2012 Dec;70(12):2867-75. PMid:22682739. http://dx.doi.org/10.1016/j.joms.2012.03.007.
14. Park SB, Kim YI, Son WS, Hwang DS, Cho BH. Cone-beam computed tomography evaluation of short- and long-term airway change and stability after orthognathic surgery in patients with class III skeletal deformities: bimaxillary surgery and mandibular setback surgery. Int J Oral Maxillofac Surg. 2012 Jan;41(1):87-93. PMid:22024138. http://dx.doi.org/10.1016/j.ijom.2011.09.008.
15. Hsieh YJ, Liao YF, Chen NH, Chen YR. Changes in the calibre of the upper airway and the surrounding structures after maxillomandibular advancement for obstructive sleep apnoea. Br J Oral Maxillofac Surg. 2014 May;52(5):445-51. PMid:24629456. http://dx.doi.org/10.1016/j. bjoms.2014.02.006.
17. Schendel SA, Broujerdi JA, Jacobson RL. Three-dimensional upper-airway changes with maxillomandibular advancement for obstructive sleep apnea treatment. Am J Orthod Dentofacial Orthop. 2014 Sep;146(3):385-93. PMid:25172261. http://dx.doi.org/10.1016/j.ajodo.2014.01.026.
18. Mattos CT, Vilani GN, Sant’Anna EF, Ruellas AC, Maia LC. Effects of orthognathic surgery on oropharyngeal airway: a meta-analysis. Int J Oral Maxillofac Surg. 2011 Dec;40(12):1347-56. PMid:21782388. http://dx.doi.org/10.1016/j.ijom.2011.06.020.
19. Kim MA, Kim BR, Youn JK, Kim YJ, Park YH. Head posture and pharyngeal airway volume changes after bimaxillary surgery for mandibular prognathism. J Craniomaxillofac Surg. 2014 Jul;42(5):531-5. PMid:24080139. http://dx.doi.org/10.1016/j.jcms.2013.07.022.
CONFLICTS OF INTERESTS
he authors declare no conlicts of interest.
*CORRESPONDING AUTHOR
Lucas Borin Moura, Faculdade de Odontologia de Araraquara, UNESP – Universidade Estadual Paulista, Rua Humaitá, 1680, 14801-903 Araraquara - SP, Brasil, e-mail: [email protected]