CLINICAL SCIENCE
Growth of very low birth weight infants fed with
milk from a human milk bank selected according to
the caloric and protein value
Marisa da Matta Aprile,1Rubens Feferbaum,2,3Nerli Andreassa,1Claudio Leone4
1Pediatric Department, ABC Medical School - Sa˜o Bernardo do Campo/SP, Brazil.2Faculdade de Medicina da Universidade de Sa˜o Paulo - Sa˜o Paulo/SP, Brazil.3Nutrinfancia - Sa˜o Paulo/SP, Brazil.4Public Health Department, Universidade de Sa˜o Paulo - Sa˜o Paulo/SP, Brazil.
OBJECTIVE:To describe growth and clinical evolution of very low birth weight infants fed during hospital stay with milk from a human milk bank according to the caloric-protein value.
METHOD:Forty very low birth weight infants were included: 10 were fed milk from their own mothers (GI), and 30 (GII) were fed human milk bank.700 cal/L and 2 g/dL of protein. Growth curves were adjusted using nonlinear regression to the measured growth parameters.
RESULTS:full enteral diet was reached in 6.3 days by GI and in 10.8 by GII; a weight of 2 kg was reached in 7.3 weeks for GI and in 7.8 for GII. In GI, 3/10 (33.3%) and in GII, 7/30 (23.3%) developed sepsis. Necrotizing enterocolitis did not occur in GI, but in 3/30 (10.0%) in GII. GI presented with urinary calcium . 4 mg/L in 1/10 (10.0%), urinary phosphorus (Pu) ,1 mg/L in 10/10 (100%), and Ca/Cr .0.6 ratio in 1/10 (10.0%) of the cases; in GII, no
children presented alterations of the urinary calcium or the Ca and Cr ratio, and Puwas,1 mg/L in 19/30 (63.3%). In
terms of growth the 50thpercentile for GI was a weight gain of 12.1 g/day (GI) vs. 15.8 g/day (GII), a length gain of
0.75 cm/week (GI) vs. 1.02 cm/week (GII), and a head circumference gain of 0.74 cm/week (GI) vs. 0.76 cm/week (GII).
CONCLUSIONS:Human milk bank allowed a satisfactory growth and good clinical evolution for very low birth weight infants.
KEYWORDS: Premature infants; Human milk; Human milk bank; Infant nutrition; Enteral nutrition.
Feferbaum R, Leone C, Aprile MM, Andreassa N. Growth of very low birth weight infants fed with milk from a human milk bank selected according to the caloric and protein value. Clinics. 2010;65(8):751-756.
Received for publication onApril 27, 2010;First review completed onApril 29, 2010;Accepted for publication onMay 3, 2010
Email: [email protected]
Tel.: 55 11 3069-8590
INTRODUCTION
Maternal milk (HM) is considered the gold standard to nourish very low birth weight infants (VLBWIs).
VLBWIs benefit from the immunological and nutritional composition of HM, which, during the period of four to six weeks post-birth, has a higher concentration of proteins, lipids, calories, sodium and IgA and smaller concentration of lactose than the mature milk making it adapted for premature needs. The more premature, the higher the protein and lipid contents of the HM.1
With the evolution of lactation, there is a reduction of the immunologic factors, caloric-protein and mineral concentra-tion in HM, especially calcium and phosphorus,2a fact that makes some researchers question its indication for VLBWIs, especially for those with birth weights lower than 1500 g.3-5
With the aim of obtaining benefits from HM for VLBWIs feeding, various studies were developed using HM supple-mented with heterologous protein, energy and minerals, especially calcium, phosphorous and sodium, confirming higher weight, linear growth and head circumference (HC) gains as well as a lesser incidence of osseous metabolic disease.5-8 However, HM with additives and the use of formulas designed for preterm infants are not exempt from complications such as necrotizing enterocolitis (NEC) nor, in the long run, from the accelerated growth especially in the first weeks of life that can cause obesity in childhood and future metabolic syndromes.9
The institution of human milk banks has created a new perspective for VLBWI nutrition. With the lack of mother’s milk, the donor’s milk can be a good alternative for VLBWIs, and donor’s milk has advantages in comparison to the use of formulas, especially in terms of a smaller risk of infection, NEC, metabolic disorders and better feeding progres-sion.10,11 However, there are few studies in the literature on VLBWIs fed with donated milk.
Due to the variations in each donated milk sample and in the nutritional needs of each VLBWI, we studied the use of Copyrightß2010CLINICS– This is an Open Access article distributed under
milk from a human milk bank that was selected according to the caloric and protein value (HMB) for VLBWI feeding. Herein, we describe the postnatal growth of these children until they reach two kilograms of weight during their hospital stay and their clinical-laboratorial evolution during internment.
MATERIALS AND METHODS
Studied cases included 40 VLBWIs (birth weight#1500 g), without intrauterine growth restriction according to the Kramer criteria.12 VLBWIs using medications that alter protein metabolism, corticosteroids and/or diuretic medica-tion for more than two weeks, those not able to receive enteral feeding for more than a week, and those with major malformations in multiple organs or system dysfunctions were excluded from the study.
The VLBWIs were classified into two study groups: Group I (GI) included 10 VLBWIs who received milk from their own mothers, either drawn and raw or pasteurized. Group II (GII) included 30 VLBWIs with a birth weight
# 1500 g, without intrauterine growth restriction, who received human milk from a bank previously classified for containing more than 60% protein and calories of the total ingested value. The division of the study groups occurred naturally according to the mother’s milk produc-tion and the need for complementaproduc-tion with HMB. The study was approved by the ethical Board of Sa˜o Paulo University Clinics Hospital and University Hospital of Sa˜o Bernardo do Campo (HMU). The milk used in this research study to GI was the milk from the infants’ own mothers, raw or pasteurized, and to GII was mainly transition or mature donated milk from the HMB with a caloric value.700 kcal/L and a protein value.2.0 g/dl. For those VLBWIs that received minimal enteral feeding, the selected milk as preferably the raw colostrums or pasteurized milk from their mothers. In the lack of mother’s milk, pasteurized colostra from the milk up to 600 kcal/L and with protein contents varying from 2 to 3 g/dL, were offered. In terms of collection, storage, pasteurization and quality control, the milk used in this protocol complies with Brazilian legislation, i.e., the administrative rules of the Ministry of Health regulating the implementation and operation of HMB.13
The HMB caloric value was determined through the crematocrit technique,14and the protein value was carried out through the Biuret technique.15
In the study period, 15,283 samples of HM were analyzed, out of which 1370 (8.9%) were selected for protein concentration dosing for having more than 700 kcal/L; out of these, 623 (45.4%) had more than 2 g/dL of proteins.
The milk samples were selected with the aim of offering the VLBWIs 120 kcal/kg/day and 2.5 to 3.5 g/kg/day protein. This proposal is based on the Polberger study,6 which considers that an offer above this caloric-protein density has no growth advantage and only causes higher fat deposition. The referred values are close to those proposed by Tsang et al.16and by the Nutrition Committee of the European Society of Pediatrics, Gastroenterology and Nutrition.17 The initial offered volume ranged from 10 to 20 mL/kg/day and was increased according to the tolerance of each child.
During the hospital stay, feeding progression and clinical events such as incidence of sepsis, NEC and bronchopul-monary dysplasia were analyzed. Additionally, calcium and
phosphorus (serum and urine), urea, creatinine, hemoglobin (HB) and hematocrit (Hct) were dosed.18-21
Statistical analysis
The type of study was prospective, observational and sequential with VLBWIs cut type outlining during the hospital stay.
Parametric and nonparametric tests were utilized when the obtained sample was relatively small or presented data variability. The Shapiro-Wilk test was utilized to verify the normality and the Mann-Witney test to compare the nonparametric variables medians.
Elaboration of growth curves
From data regarding weight, HC and length, nonlinear regression equations that were best adjusted to the individual growth parameters for each infant were established.
Utilizing the CurvExpertH 1.3 software, various models were selected to mimic the growth tendency that each child presented and to obtain a high correlation coefficient allied to a smaller formula standard error. In this manner, the following equations were selected:
N
Third-degree polynomial: Y = a+bx+cx2+dx3N
Fourth-degree polynomial: y = a+bx+cx2+dx3+ex4N
Fifth-degree polynomial: y = a+bx+cx2+dx3+ex4+fx5N
Heat Capacity Model: Y = a+bx+c/x2N
Sinusoidal: Y = a+bcos(cx+d)N
Count = a+bx+clogxN
Hyperbolic: y = a+b/xN
Exponential: y = ae b/xFrom the equation defined for each VLBWI, through interpolation, the values of weight, length and HC were estimated at weekly intervals, from 28 until 39 exact weeks of corrected GA. Utilizing these data, for each exact age (weeks), each parameter’s mean value was calculated. Based on the mean values, regression curves that were better adjusted to the VLBWI group growth as a whole were established by utilizing the same software and the same described criteria. This is able to smooth out the erratic character that is usually observed in curves based on actual values.
The best adjustment curve for the three parameters in the different ages was a third-degree polynomial.
Results
In the study period, 11,342 children were born in the hospital HMU, and 1051 of them with GA less than 37 weeks, out of which 195 weighed,1500 g; of these, 57 (29.2%) were characterized as not having intrauterine growth restriction. Seventeen VLBWI were excluded from the study according to the established exclusion criteria.
Table 1 shows the GI and GII distribution according to birth weight. The groups were similar in terms of birth weight range (1251 g to 1500 g); however, 42.5% of infants in GII weighed less than 1250 g, while this was true for only 20.0% of infants in GI.
parenteral nutrition, and most of them had a good caloric-protein ingestion (Table 1).
As shown in Table 1, there were few complications and no differences related to oral feeding such as NEC and other complications associated with prematurity. Otherwise, the incidence of sepsis was low in both groups.
Laboratory assessment (Table 1) of hemoglobin and hematocrit showed no correlation between the use of human milk and the evolution of anemia in the studied cases. Serum urea and creatinine were higher and signifi-cant (p = 0,0246) in GII which could indicates a greater amount of ingested protein.
The study also monitored possible laboratory phos-phorous deficiency21 and when necessary, corrected it through the use of a calcium and phosphorous manipulated formula. As shown in Table 2, there was no evidence of Osseous Metabolic Disease, but we did observe phosphorus deficiency.
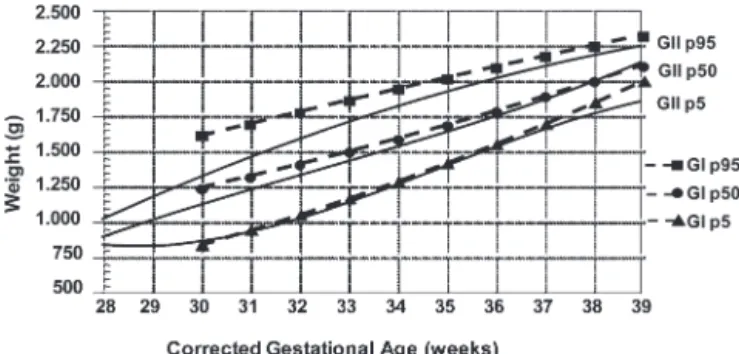
The values obtained in the VLBWI growth parameters of both groups in regard to weight, length and HC expressed in percentiles, for each GA, are shown in Tables 3 (GI) and 4 (GII). The graphs corresponding to these tables for the 5th, 50thand 95thpercentiles are shown for weight, length and HC in Figures 1, 2 and 3, respectively.
Tables 3 and 4 show values obtained in length and HC of both groups (GI and GII) are virtually the same for all percentiles. In regards to weight, the same tables show that
the median weight achieved in the corresponding age of 39 weeks of gestation is almost the same; however, the GII had a wider range of values between the median and the extreme percentiles than were observed in GI.
Nevertheless, when considering growth during the study period, Figures 1, 2 and 3 show that both groups presented equal trends and that the gain in weight ( p = 0,0002) and length ( p = 0,0038) was higher and significant in GII than GI.
DISCUSSION
Currently, the consensus is that HM is the better nutrient for VLBWIs. However, there are doubts about its adequacy after the 3rdweek from birth, especially for those with birth weights below 1250 g.8,22
The nutritional strategies currently utilized are formulated to increase human milk caloric-protein, mineral and vitamins value, or complement the human milk with formulas appropriate for premature infants. With the lack of HM, or when its complementation is necessary, HMB can be a good option;23 however, according to some authors,24,25 this product might not be nutritionally appropriate. This was shown by studies utilizing HMB during the mature milk stage that came from full-term newborn mothers, which displayed protein and mineral contents insufficient to allow a growth similar to the intrauterine growth in VLBWI.26
However, it is worth mentioning that these studies developed with donor HM did not detail the quality control of samples, such as the cold chain and titratable acidity, which are important in the reduction in loss of immunolo-gical components and in the maintenance of nutrients. Moreover, these studies did not analyze the protein and caloric contents of the offered HM. It should also be considered that donated HM is obtained through milk-drawing that is done according to the donor need: some use relief milk-drawing, i.e., after milking, due to large milk production, breasts are emptied to avoid ingurgitation. This procedure favors the collection of more caloric milk that is mainly composed of the emulsion fraction; on the other
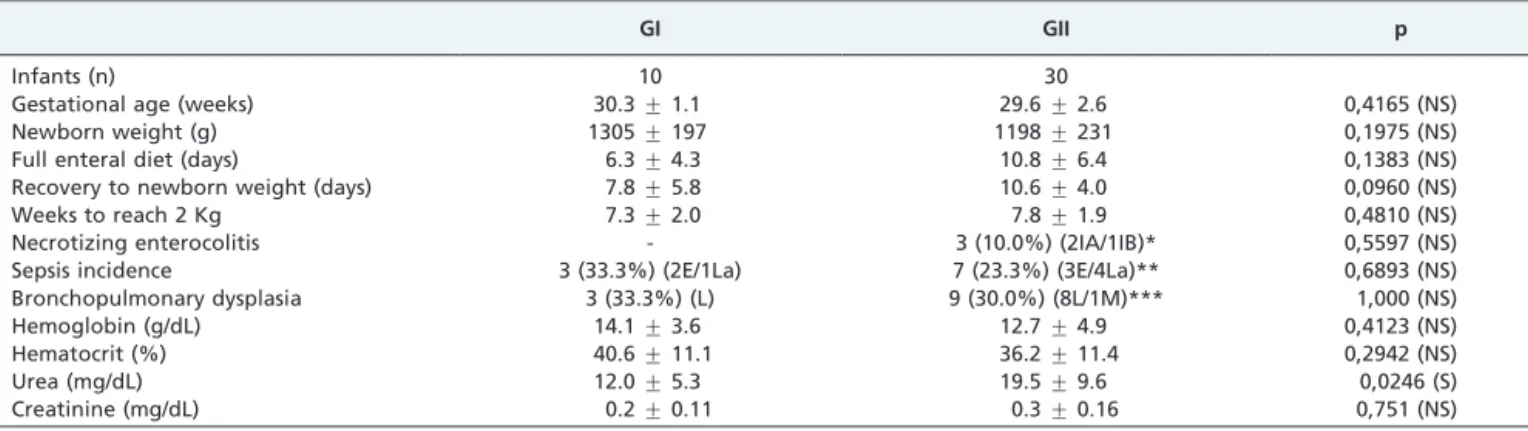
Table 1 -Group I and Group II studied cases in regards to weight, enteral progression and clinical - laboratory data.
GI GII p
Infants (n) 10 30
Gestational age (weeks) 30.3¡1.1 29.6¡2.6 0,4165 (NS)
Newborn weight (g) 1305¡197 1198¡231 0,1975 (NS)
Full enteral diet (days) 6.3¡4.3 10.8¡6.4 0,1383 (NS)
Recovery to newborn weight (days) 7.8¡5.8 10.6¡4.0 0,0960 (NS)
Weeks to reach 2 Kg 7.3¡2.0 7.8¡1.9 0,4810 (NS)
Necrotizing enterocolitis - 3 (10.0%) (2IA/1IB)* 0,5597 (NS)
Sepsis incidence 3 (33.3%) (2E/1La) 7 (23.3%) (3E/4La)** 0,6893 (NS)
Bronchopulmonary dysplasia 3 (33.3%) (L) 9 (30.0%) (8L/1M)*** 1,000 (NS)
Hemoglobin (g/dL) 14.1¡3.6 12.7¡4.9 0,4123 (NS)
Hematocrit (%) 40.6¡11.1 36.2¡11.4 0,2942 (NS)
Urea (mg/dL) 12.0¡5.3 19.5¡9.6 0,0246 (S)
Creatinine (mg/dL) 0.2¡0.11 0.3¡0.16 0,751 (NS)
Normal laboratory values:30
Hemoglobin: 9.0–14.0 g/dL Hematocrit: 28–42% Urea: 5–18mg/dL Creatinine: 0.2–0.4mg/dl
*Necrotizing enterocolitis (NEC) - Bell criterion modified by Walsh and Kliegmann, 198619 **Sepsis – Bone et al. criteria, 199118
***Bronchopulmonary dysplasia - Ehrenkranz, 200520
E – early; La – late; L – light; and M – moderate NS = no significant, S = significant
Table 2 -Serum and urinary values of Ca, P, FA, and Ca/Cr ratio in GI (n = 10) and in GII (n = 30).
Group I Group II
p
Variable n % n %
Blood Ps,3.6 mg/dL 3 30.0 16 53.3 0,2812(NS)
FA.900 UL 7 70.0 17 56.6 0,7110(NS)
Urine *CaU.4 mg/L 1 10.0 - - 0,2500(NS)
*PU,1 mg/L 10 100.0 19 63.3 0,0381(S)
hand, when the donor draws milk between milking or uses dripping milk, the caloric value is lower because this is the solution fraction.27Therefore, the nutritional and immuno-logical composition of the donated HM can be modified due to various factors including period of lactation.
HMB samples were selected as described to meet the medical prescription according to the needs of the VLBWIs and their evolution period. The initial offered volume ranged from 10 to 20 mL/kg/day and was increased according to the child’s tolerance. When possible, the mother’s own HM was utilized. In this manner, the group
division naturally occurred according to the need for supplementation with HMB.
Enteral feeding had an early start, and the time to reach full enteral feeding in the stable growth phase in GI was 6.3¡
4.3 days and was 10.8¡6.4 days in GII (Table 01). A relevant comparison was the difference found by Schanler et al.28who observed an elapsed time of 28¡7 days to reach full enteral feeding utilizing supplemented HM and 36¡ 17 days in children fed with formula for premature infants.
When comparing the birth weight recovery time in GI and GII, we observed, on average, 7.8 ¡ 5.8 days in GI and
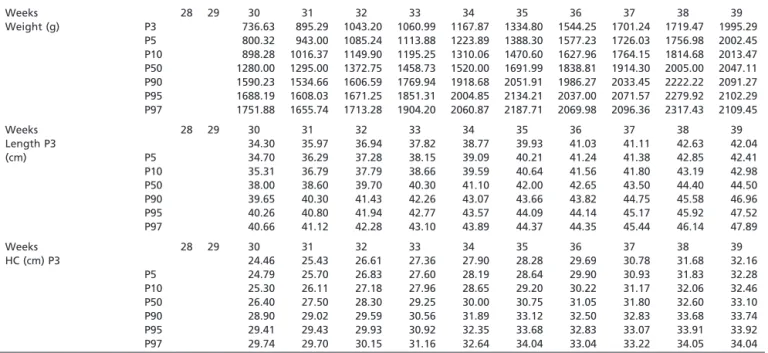
Table 3 -Evolution of Weight (w), Length (l) and Head Circumference (HC) percentiles (P3 to 97), according to the corrected gestational age, estimated through interpolation from the equation defined for each VLBWI of GI (n = 10).
Weeks 28 29 30 31 32 33 34 35 36 37 38 39
Weight (g) P3 736.63 895.29 1043.20 1060.99 1167.87 1334.80 1544.25 1701.24 1719.47 1995.29
P5 800.32 943.00 1085.24 1113.88 1223.89 1388.30 1577.23 1726.03 1756.98 2002.45
P10 898.28 1016.37 1149.90 1195.25 1310.06 1470.60 1627.96 1764.15 1814.68 2013.47 P50 1280.00 1295.00 1372.75 1458.73 1520.00 1691.99 1838.81 1914.30 2005.00 2047.11 P90 1590.23 1534.66 1606.59 1769.94 1918.68 2051.91 1986.27 2033.45 2222.22 2091.27 P95 1688.19 1608.03 1671.25 1851.31 2004.85 2134.21 2037.00 2071.57 2279.92 2102.29 P97 1751.88 1655.74 1713.28 1904.20 2060.87 2187.71 2069.98 2096.36 2317.43 2109.45
Weeks 28 29 30 31 32 33 34 35 36 37 38 39
Length P3 34.30 35.97 36.94 37.82 38.77 39.93 41.03 41.11 42.63 42.04
(cm) P5 34.70 36.29 37.28 38.15 39.09 40.21 41.24 41.38 42.85 42.41
P10 35.31 36.79 37.79 38.66 39.59 40.64 41.56 41.80 43.19 42.98
P50 38.00 38.60 39.70 40.30 41.10 42.00 42.65 43.50 44.40 44.50
P90 39.65 40.30 41.43 42.26 43.07 43.66 43.82 44.75 45.58 46.96
P95 40.26 40.80 41.94 42.77 43.57 44.09 44.14 45.17 45.92 47.52
P97 40.66 41.12 42.28 43.10 43.89 44.37 44.35 45.44 46.14 47.89
Weeks 28 29 30 31 32 33 34 35 36 37 38 39
HC (cm) P3 24.46 25.43 26.61 27.36 27.90 28.28 29.69 30.78 31.68 32.16
P5 24.79 25.70 26.83 27.60 28.19 28.64 29.90 30.93 31.83 32.28
P10 25.30 26.11 27.18 27.96 28.65 29.20 30.22 31.17 32.06 32.46
P50 26.40 27.50 28.30 29.25 30.00 30.75 31.05 31.80 32.60 33.10
P90 28.90 29.02 29.59 30.56 31.89 33.12 32.50 32.83 33.68 33.74
P95 29.41 29.43 29.93 30.92 32.35 33.68 32.83 33.07 33.91 33.92
P97 29.74 29.70 30.15 31.16 32.64 34.04 33.04 33.22 34.05 34.04
Table 4 -Evolution of Weight (w), Length (l) and Head Circumference (HC) percentiles (P3 to P97), according to the corrected gestational age, estimated through interpolation from the equation defined for each VLBWI of GII (n = 30).
Weeks 28 29 30 31 32 33 34 35 36 37 38 39
Weight (g) p3 837.28 745.19 815.65 894.21 1008.68 1079.76 1185.11 1312.30 1441.05 1625.25 1799.29 1756.75 p5 843.23 771.65 859.17 931.70 1045.57 1118.34 1224.50 1350.36 1478.73 1656.02 1821.34 1791.76 p10 852.40 812.35 926.13 989.38 1102.31 1177.68 1285.09 1408.92 1536.69 1703.35 1855.26 1845.62 p50 887.50 940.50 1145.00 1193.70 1330.50 1395.00 1505.00 1609.30 1728.80 1849.40 1987.20 2106.70 p90 917.10 1099.85 1399.03 1396.74 1503.10 1596.85 1713.09 1822.52 1946.06 2037.69 2094.83 2226.02 p95 926.27 1140.55 1465.98 1454.41 1559.84 1656.20 1773.68 1881.07 2004.02 2085.02 2128.75 2279.88 p97 932.22 1167.01 1509.51 1491.91 1596.74 1694.78 1813.07 1919.14 2041.70 2115.79 2150.80 2314.89
Weeks 28 29 30 31 32 33 34 35 36 37 38 39
Length (cm) p3 31.58 33.25 34.28 34.72 35.84 36.65 37.64 38.33 39.17 39.80 41.25 43.03
p5 31.94 33.55 34.65 35.10 36.18 37.00 37.98 38.68 39.56 40.23 41.56 43.26
p10 32.48 34.01 35.22 35.68 36.72 37.53 38.49 39.22 40.16 40.89 42.04 43.61
p50 33.80 35.25 37.00 37.40 38.50 39.50 40.20 41.00 42.25 43.20 44.10 45.10
p90 36.36 37.26 39.26 39.80 40.47 41.31 42.14 43.07 44.38 45.57 45.42 46.07
p95 36.90 37.72 39.83 40.38 41.01 41.84 42.65 43.61 44.97 46.23 45.89 46.42
p97 37.26 38.01 40.21 40.76 41.35 42.19 42.99 43.97 45.36 46.66 46.20 46.65
Weeks 28 29 30 31 32 33 34 35 36 37 38 39
HC (cm) p3 23.50 22.34 23.83 24.87 25.46 26.13 26.94 27.83 28.71 29.58 30.63 32.00
p5 23.58 22.67 24.16 25.15 25.75 26.41 27.22 28.10 28.97 29.82 30.81 32.09
p10 23.70 23.17 24.67 25.58 26.19 26.84 27.64 28.51 29.36 30.17 31.08 32.24
p50 24.15 24.60 27.00 27.10 27.65 28.30 28.95 29.80 30.80 31.20 31.90 32.60
p90 24.55 26.76 28.31 28.62 29.32 29.89 30.65 31.44 32.16 32.68 32.99 33.29
p95 24.67 27.27 28.83 29.05 29.76 30.33 31.08 31.86 32.56 33.04 33.26 33.44
10.6¡4.0 days in GII (Table 01). Gross et al.26compared the
weight gain of the three VLBWI groups with GA between 27– 33 weeks and birth weight,1500 g. One group was fed with the first week’s milk (colostra and transition milk) obtained from VLBWI mothers, another group was fed with mature milk from full-term newborn mothers, and a third group was fed with lacteal formula. Those fed with lacteal formula recovered their birth weight in 10.3¡0.8 days, those fed with
VLBWI mother’s milk recovered in 11.4¡0.8 days, and those
using mature milk recovered in 18.8¡1.7 days. In this study, the authors utilized a pool of human milk from various donors stored until a year after pasteurization, a procedure that is not utilized in Brazil.13It should be noted that the components of HMB obtained through the pool are medianly distributed, and therefore the children receiving it do not benefit from the changes in composition of drawn milk.
In regard to the time elapsed to reach 2 kg, there was no difference between groups. On average, GI took 7.3 ¡
2 weeks and GII took 7.8¡1.9 weeks (Table 1).
These results are similar to the results from a study by Schanler et al.28, which compared VLBWIs fed with supple-mented HM and preterm formula. They found an average time to reach 2 kg of 8.4 ¡ 1.8 weeks with the use of
supplemented HM and 7.2 ¡ 1.7 weeks with formula for
VLBWIs. The results suggest that the early introduction of pasteurized HM or HMB allows for a good enteral feeding progression and a very appropriate average time to reach 2 kg. As for clinical events, in GII, 3/30 (10.0%) children had suspect light NEC with good clinical evolution, and there were no cases of NEC in GI. In regard to sepsis, there were 3/10 (33.3%) cases in GI and 7/30 (23.3%) cases in GII (Table 1). Schanler et al.29found a 6% incidence of NEC in the group of children fed with donor HM, 11% in the group of preterm formula, and 6% in the HM group; sepsis incidence was 29% in the group of children fed with donor milk, 23% in the maternal milk group, and 30% in the group using formula.
The incidence of sepsis in the group using HMB was the same found in the group using HM, similar to what was previously described by Schanler et al.28
Bronchopulmonary dysplasia (BD), occurred in 3/10 (30.0%) cases in GI and GII 9/30 (30.0%) cases in: 1/30 (3.3%) presented moderate and 8/30 (26.6%) presented light BD (Table 01).
In the studied cases, there was no significant difference of clinical complications when comparing HMB and the mother’s own milk probably due to the preservation of donated HMB protection factors, resulting from quality control techniques used in the National HMB Network.13
This study monitored the phosphorous deficiency21 and corrected it when necessary through the use of a calcium and phosphorous manipulated formula (Table 2). GI presented urinary calcium . 4 mg/L in 1/10 (10.0%), urinary phosphorus,1 mg/L in 10/10 (100%), and Ca/Cr ratio.0.6 in 1/10 (10.0%) of the cases; in GII, none of the children presented alterations in urinary calcium values, although 19/30 (63.3%) presented urinary phosphorus
,1 mg/L. This made us conclude that the urinary excretion of phosphorus was more prolonged and intense in GI than in GII (p = 0,0381), which evolved more adequately, show-ing economy in phosphorous excretion.
These results suggest that HMB with higher caloric value mostly composed of the suspension and emulsion fraction than the solution fraction has more casein in the colloidal solution with calcium and phosphorus, which causes a higher concentration of these ions. In spite of this, the phosphorous serum level was found to be low in 3/10 (30.0%) of the GI children and in 16/30 (53.3%) of group II, and the alkaline phosphatase was.900 UL in 7/10 (70.0%) of GI children and 17/30 (56.6%) of GII children (Table 2). These results show the need for continuous Osseous Metabolic Disease monitoring through the control of serum and urinary calcium and phosphorus when indicated by laboratorial parameters.
The growth analysis shows that for GI, the anthropo-metric data for the construction of curves were computed from the value that each child presented in the 30thweek of CGA; when analyzed between the 30th and 39th week of CGA, we verified an average weight gain of 12.1 g/day, length of 0.75 cm/week and HC of 0.74 cm/week in the 50th percentile (p50) of the curve (Table 3; Figures 1, 2 and 3).
As for GII, from the 28th to the 39th week of CGA, in regard to p50, the average weight gain was 15.8 g per day;
Figure 1 -Estimated values of 5th, 50thand 95thpercentiles of GI
and GII VLBWIs (in g).
Figure 3 -Estimated values of 5th, 50thand 95thpercentiles of GI
and GII VLBWI Head Circumference (HC in cm).
Figure 2 -Estimated values of 5th, 50thand 95thpercentiles of GI
however, if we stratify this period, we verified that the weight gain was 14.5 g/day between the 28thand the 31st week of CGA, 11.6 g/day between the 32nd and the 34th week, and 17.7 g/day between the 35th and 39th week (Table 4 and Figure 1). The phase of lesser weight gain between the 32ndand 34thweek coincides with the moment when non-nutritive breast milk suction started, which might have caused an energetic expenditure above that when the nursing bottle or little cup was used.
In regards to the length of GII, the increase was 1.02 cm/ week, and the HC growth was 0.76 cm/week (Table 4 and Figure 2,3).
In 2005, Schanler et al.29observed a weight gain of 17.1¡
5.0 g/kg/day, length of 1.2¡0.8 cm/week and HC of 0.9¡
0.9 cm/week in the group fed milk from donor mothers. In the group fed preterm formula, the weight gain was 20.1¡
6.7 g/kg/day, length was 1.0¡1.0 cm/week and HC was
0.9¡0.8 cm/week. The maternal milk group gained 18.8¡
5.8 g/kg/day in weight, length of 0.6 ¡ 0.4 cm/week
and CP of 0.8 ¡ 0.5 cm/week. In another study,28 by
utilizing HM with additives, the obtained weight gain was 22¡7 g/kg/day, length was 0.79¡0.27 cm/day and HC
was 0.88¡0.26 cm/day. Compared with the studied cases,
the weight gain was superior in all groups; however, children in the present study took 7 weeks on average to reach 2 kg in weight and had very similar gains in length and HC, which means that the smaller weight losses soon after birth and the faster recovery of birth weight compen-sated for the smaller weight gain later on.
An important aspect observed in this study are the growth curves with proportionality in the three studied parameters (weight, length and HC), showing the adequacy of the offered diet (Figures 1, 2 and 3).
Studies with donated HMB in general utilize HM pools, which are extremely vulnerable products with few con-trolled studies of its physical-chemical quality and caloric and protein value, which are indispensable aspects. Without this information, there are great possibilities of offering a product that does not meet the VLBWI nutritional needs.7,13,29
By determining the properties of each milk sample, despite the period of lactation (colostra, transition or mature milk), we have the possibility to individualize the VLBWI needs and offer a more appropriate HMB in regard to its caloric-protein composition for each phase of the child’s growth. Quality control of donated human milk established by the Brazilian laws governing human milk bank13allows for a better quality product with minimal immunologic and nutritional loss. The usual determination of crematocrit plus that of protein makes the HMB choice economically feasible, for the crematocrit cost is insignificant and the protein dosage is about US$0.50/sample.
We conclude that HMB utilization is an important strategy in the nutrition of VLBWIs to promote a satisfactory growth with good clinical evolution and should be considered in neonatology services structured with a human milk bank.
REFERENCES
1. Cazacu A, Fraley JK, Schanler RJ. We are inadequately nourishing health low birth weight infants( Abstract). Pediatr Res. 2001;49:343A 2. Schanler RJ, Hurst NM, Lau C. The use of human milk and beastfeeding
in premature infants. Clin Perinatol. 1999;26:379-98.
3. Schanler RJ, Atkinson AS. Effects of nutrients in human milk on the recipient premature infant. J Mammary Gland Biol Neoplasia. 1999;4:297-307, doi: 10.1023/A:1018754014330.
4. O’Connor DL, Jacobs J, Hall R, Adamkin D et al. Growth and development of premature infants fed predominantly with premature infant formula or a combination of human milk and premature formula. J Pediatr Gastroenterol Nutr. 2003;37:437-446, doi: 10.1097/00005176-200310000-00008.
5. Porcelli P, Shanler R, Greer F, Chan G, Gross S, Mehta N, et al. Growth in human fed very low birth weight infants receiving a new human fortifier. Ann Nutr Metab. 2000;44:2-10, doi: 10.1159/000012814. 6. Polberger S, Raiha NCR, Juvonen P, Moro GE, Minoli I, Warm A.
Individualized protein fortification of human milk for pretem infant. Comparison of ultrafiltrated human milk protein and a bovine whey fortifier. J Pediatr Gastroenterol Nutr. 1999;29:332-8, doi: 10.1097/ 00005176-199909000-00017.
7. Schanler RJ. Suitability of human milk for the low birth weight infant. Clin Perinatol. 1995;22:207-22.
8. Schanler RJ, Shulman RJ, Lau C. Feeding strategies for premature infants: beneficial outcomes of feeding fortified human milk versus preterm formula. Pediatrics. 1999;103:1150-7, doi: 10.1542/peds.103.6.1150. 9. Horta BL, Martines JC, Victora CG. Evidence on the long-term effects of
breastfeeding: systematic reviews and meta-analises. Geneva: World Health Organization; 2007. 57p.
10. Lucas A, Cole TJ. Breast milk and neonatal necrotizing enterocolitis. Lancet. 1990;336:1519-23, doi: 10.1016/0140-6736(90)93304-8.
11. Mcguire W, Anthony MY. Donor human milk versus formula for preventing entercolitis in preterm infants: systematic review. Arch Dis Child Fetal Neonatal Ed. 2003;88:11-4, doi: 10.1136/fn.88.1.F11. 12. Kramer MS, Olivier M, McLean FH, Dougherty GE, Willis DM, Usher
RH. Determinants of fetal growth and proportionality. Pediatrics. 1990;86:18-26.
13. Ministe´rio da Sau´de. RNBLH Manual de processamento e controle de qualidade. Brası´lia: Ministe´rio da Sau´de; 1999. Disponible in: htpp:// www.fiocruz.br/redeblh.
14. Lucas A, Gibbs JAH, Lyster RLJ, Baum JD. Crematocrit: simple clinical technique for estimating fat concentration and energy value of human milk. Br Med J. 1978;1:1018-20, doi: 10.1136/bmj.1.6119.1018.
15. Henry RJ, Cannon DC, Winkelman JW. Clinical chemistry: principles and technics. 2nded. New York: Harper Row; 1974.
16. Tsang RC, Uauy R, Koletzko B, Zlotkin S. Nutrition of preterm infant: scientific basis and pratical guidelines. 2nded. Ohio: Digital educational
Publishing; 2005. 427p.
17. Committee on Nutrition of Preterm Infant. European Society of Pediatric Gastroenterology and Nutrition. Nutrition and feeding of preterm infants. Acta Paediatr Scand. 1987;336:2-14.
18. Bone RC. The patoghenesis of sepsis. Ann Intern Med. 1991;115:457-69. 19. Walsh MC, Kliegmann RM. Necrotizing enterocolitis: treatment basead
on staging criteria. Pediatr Clin North Am.1986;33:179-201.
20. Ehrenkranz RA, Walsh MC, Vohr BR, Jobe AH, Wright LL, Fanaroff MB, et al. Validation of the National Institutes of Health Consensus Definition of Bronchopulmonary Dysplasia. Pediatrics. 2005;116;1353-60, doi: 10. 1542/peds.2005-0249.
21. Catache MM, Leone CR. Critical analysis of pathophysiological diagnosis and therapeutic aspects of metabolic bone disease in very low birth weight infants. J Pediatr. (Rio J) 2001;77:53-62
22. Kashyap S, Schulze KF, Forsyth M, Dell RB, Ramakrishnan R, Heird WC. Growth, nutrient retention and metabolic response of very low-birth-weight infants fed supplemented and unsuplemented preterm human milk. Am J Clin Nutr Am. 1990;52:254-62.
23. Tully DB, Jones F, Tully MR. Donor milk: what’s in it and what’s not. J Hum Lact. 2001;17:152-5, doi: 10.1177/089033440101700212.
24. Rigo J, Senterre J. Nutritional needs of premature infants: current issues. J Pediatr. 2006;149:S80-S88, doi: 10.1016/j.jpeds.2006.06.057.
25. Schanler RJ. Evaluation of evidence of support current recommendations to meet the needs of premature infants: the role of human milk. Am J Clin Nutr. 2007;85(suppl):625S-628S.
26. Gross SJ. Growth and biochemical response of preterm infants fed human milk or modified infant formula. N Engl J Med. 1983;308:237-41. 27. Gibbs JH, Fisher C, Bhattacharya S, Goddard P, Baum JD. Drip breast milk: its composition, collection and pasteurization. Early Hum Dev. 1977;1:227-45, doi: 10.1016/0378-3782(77)90037-8.
28. Schanler RJ, Shulman RJ, Lau C. Feeding strategies for premature infants: beneficial outcomes of feeding fortified milk versus preterm formula. Pediatrics. 1999;103:1150-7, doi: 10.1542/peds.103.6.1150.
29. Schanler RJ, Lau C, Hurst NM, Smith RO. Randomized trial of donor human milk versus preterm formula as substitutes for mothers own milk in the feeding of extremely premature infants. Pediatrics. 2005;116:400-6, doi: 10.1542/peds.2004-1974.