Original Article
Artigo Original
Cristina Ferraz Borges Murphy1 Elaine Cristina Zachi1 Daniela Tsubota Roque1 Dora Selma Fix Ventura1 Eliane Schochat1
Descritores
Percepção auditiva Memória Inteligência Atenção Testes auditivos
Keywords
Auditory perception Memory Intelligence Attention Hearing tests
Correspondence address: Cristina Ferraz Borges Murphy Rua Cipotânea, 51, Cidade Universitária, São Paulo (SP), Brasil, CEP: 05360-000. E-mail: [email protected]
Received: 05/02/2013
Accepted: 02/11/2014
Study carried out at the Department of Speech-Language Pathology and Audiology, Physical Therapy and Occupational Therapy, School of Medicine, Universidade de São Paulo – USP, São Paulo (SP), Brazil. (1) Universidade de São Paulo – USP – São Paulo (SP), Brazil.
Financial support: São Paulo Research Foundation (FAPESP). Conlict of interests: nothing to declare.
Inluence of memory, attention, IQ and age on auditory
temporal processing tests: preliminary study
Inluência da memória, atenção, QI e idade em testes de
processamento auditivo temporal: estudo preliminar
ABSTRACT
Purpose: To investigate the existence of correlations between the performance of children in auditory temporal tests (Frequency Pattern and Gaps in Noise — GIN) and IQ, attention, memory and age measurements. Method: Fifteen typically developing individuals between the ages of 7 to 12 years and normal hearing participated in the study. Auditory temporal processing tests (GIN and Frequency Pattern), as well as a Memory test (Digit Span), Attention tests (auditory and visual modality) and intelligence tests (RAVEN test of Progressive Matrices) were applied. Results: Signiicant and positive correlation between the Frequency Pattern test and age variable were found, which was considered good (p<0.01, 75.6%). There were no signiicant correlations between the GIN test and the variables tested. Conclusions: Auditory temporal skills seem to be inluenced by different factors: while the performance in temporal ordering skill seems to be inluenced by maturational processes, the performance in temporal resolution was not inluenced by any of the aspects investigated.
RESUMO
INTRODUCTION
Currently, nonverbal auditory processing tests, such as Gaps-in-Noise (GIN) and Frequency Pattern, are widely used to evaluate the auditory temporal processing. The importance of using these tests is related to the hypoth-esis that attributes oral and/or written language disorders to a perceptual deficit, specifically to the auditory tempo-ral processing(1-7).
One of the issues considered when discussing the per-formance of children in auditory temporal processing tests is the variability of responses found(7,8-14). In a recently pub-lished study(14), psychophysical tests involving frequency discrimination tasks were applied to groups of children with-out alterations, aged between 6 and 11 years. The results showed a high variability of responses in the group, even among children of the same age. From this response pro-file, the question that arises is: does this variability reflect the immaturity of the auditory system? Would there be influences of nonsensory factors, such as aspects related to memory, attention, or even intelligence quotient (IQ)?
The performance of children in auditory temporal tests has been the object of study of several researches(9,10,15). In one of them(15), conducted with children aged 6–12 years, the authors found improvement of response associated with age for gap detection tests, suggesting the presence of sen-sory maturational processes in children aged 6–14 years. Other authors have found similar results(9,10). In spite of this, in the studies cited, cognitive tests were not included to investigate if the maturation of nonsensory aspects, spe-cifically in this age group, would also be responsible for this improvement in performance with age.
Regarding the relationship between cognitive func-tion and auditory temporal abilities, there is no consensus, even today, about the actual effect of this aspect in auditory sensory tests. One study showed, for example, correlation between temporal tests and pitch discrimination thresholds with global intelligence measures, concluding that measures of temporal discrimination are related to specific aspects of intelligence(16). Other researchers also attributed the vari-ability found in nonverbal tests, involving temporal mask-ing, and frequency discrimination to the cognitive perfor-mance in tasks involving primarily the attention ability(13). On the other hand, other studies have not found the same results(17). The authors applied verbal and nonverbal cogni-tive tests and auditory tests (frequency and phonemes dis-crimination) in a group of children with suspected auditory processing disorder (APD) and a control group. Although a large percentage of children in the group with suspected APD have shown poor performance in at least one of the auditory processing tests and in the cognitive performance assessment, there was a weak correlation between the two variables. In addition, children of this same group, who performed well in the auditory tests, did not differ from those with low performance in auditory tests in relation to measures of cognitive performance.
The ability to recognize, identify, and sequence auditory patterns involves several perceptual and cognitive processes(18). This inluence of cognitive aspects increases, especially when the verbal response is required, since, in this case, the task requires the integration of both hemispheres by the corpus callosum(19). In spite of this, no studies investigating the effect of nonsen-sory factors in relation to auditory temporal processing tests applied clinically, such as the Frequency and Duration Pattern and GIN tests, were found. The study of such effect is impor-tant because it can bring more information about the sensitivity of the test for other variables not directly considered, such as attention and memory. Furthermore, it is important to remem-ber that the test is most often applied to individuals who report complaints not only related to auditory processing but also to learning disorders and attention deicit hyperactivity disorder, which could inluence the demand required to carry out the auditory test if there was really a close relationship between temporal ability and nonsensory factors.
Thus, the aim of this research was to investigate separately the inluence of nonsensory aspects (IQ, memory, attention), in addition to age, in two auditory temporal processing tests (Frequency Pattern and GIN). It also aimed to find some correlation between the studied variables and performance in auditory temporal tests, which can perhaps explain the high intersubject variability present in the tests.
METHODS
The study was approved by the ethics committee for Analysis of Research Projects of Hospital das Clínicas, School of Medicine of Universidade de São Paulo (HCFMUSP), on June 17, 2009, under protocol no. 575/09.
Participants
Data were collected at the Laboratory of Speech-Language Pathology and Audiology Investigations in Auditory Processing of the Speech-Language Pathology and Audiology course of the School of Medicine of Universidade de São Paulo, from January 2010 to December 2010.
The sample was composed of 15 children (9 boys and 9 girls) aged between 7 and 12 years (mean of 9.8 years). Table 1 shows the distribution of participants according to age and gender.
The group’s inclusion criteria were the following: results within the normal ranges in the basic audiological evaluation (audiometry, speech audiometry, and impedance audiometry) and the absence of complaints related to cognitive, psychologi-cal, neurologipsychologi-cal, and ophthalmological alterations. In addition,
Table 1. Distribution of participants by age and gender Age (years)
7 8 9 10 11 12 Total
Gender
Male 0 2 0 0 2 2 6
Female 2 1 2 2 2 0 9
no school-related complaints or history of otitis or musical knowledge were presented. All this information was obtained by interviews with legal guardians, and participants agreed to participate in the research and disseminate the results.
Tests
Audiological evaluation
Participants underwent a basic audiological evaluation consisting of audiometry, speech audiometry, and impedance audiometry. All had thresholds of up to 20 dB for frequencies between 250 and 8,000 Hz.
After the basic audiological evaluation, two auditory tem-poral processing tests were applied: the Frequency Pattern test and GIN. This choice was adopted considering the fact that both investigate different abilities involving the audi-tory temporal processing (sorting and temporal resolution) and which, incidentally, are the only ones that are possible of being investigated, from a clinical point of view, to the pres-ent time. Moreover, clinically, both tests, described next, are the most used and accepted for the investigation of auditory temporal abilities(20).
Frequency Pattern test
The test consists of 20 items with an interval of about 6 sec-onds between them. Each item has three stimuli of 150 ms dura-tion, with interstimulus intervals of 200 ms. The stimuli present frequencies of 800 Hz, which corresponds to the low-pitched stimulus (L), or 1,122 Hz, corresponding to the high-pitched (H). There are six possible combinations between stimuli: HHLG, HLL, HLH, LHL, LLH, and LHH(21).
The child is instructed to listen carefully to the three stim-uli and respond orally, naming them according to the order of appearance, for example, “low, low, high” or “high, low, low.” At the end of the test, the percentage of correct answers is cal-culated. The test is applied in a soundproof booth, with ear-phones, with an intensity of 40 dBNS, binaurally.
Gaps-In-Noise Test
The purpose of this test is to determine the threshold of gap detection(22). During the testing, stimuli consisting of white noise with duration of 6 seconds are presented. In each of the stimuli, zero, one, two or three intervals of silence, with duration between 2 and 30 ms, are presented. The participant is requested to indicate every time a silence interval is perceived. The test contains 35 attempts and is applied in a soundproof booth, with earphones, with an intensity of 40 dBNS, binaurally.
Cognitive assessment
Visual and auditory attention tests
Both tests were developed by the E-Prime Professional software, based on previously published protocols, consider-ing the same parameters and duration presented in them(23-25). They are similar, that is, they use the same type of task and the
same features in relation to their duration, stimulus duration, and interstimulus interval.
In the auditory test, digits 1–7 were presented randomly through earphones; visually, the digits were presented ran-domly on a computer screen. The participants were instructed to press a button (spacebar) as soon as possible for the dig-its 1 and 5. Auditory stimuli were presented binaurally at a comfortable intensity (approximately 70 dB HL). Visual stimuli measured 3.5 cm and were displayed on the center of the screen. Each test consisted of 140 trials, with a total duration of about 4 minutes. In each attempt, the irst digit was shown for 500 ms and was followed by an interstimulus interval of 1,000 ms. Thus, the digits were presented at a rate of 1 digit/1,500 ms, with a probability of appearance of 0.28 for digits 1 and 5. The variable analyzed was the number of correct detections.
Tests were applied individually, in an insulated room using an Acer notebook. During the whole test, participants remained seated at a distance of approximately 50 cm from the moni-tor. Before the testing, participants received instructions on how they should proceed and received training consisting of about 15 trials.
Memory tests
Digits span
The participants’ performance on the Digit Span test pri-marily assessed the phonological working memory ability, one of the components in the model proposed by researchers on working memory(26). For this study, the test was developed and applied through the E-Prime Professional software. Thus, for the completion of the task, 3- to 8-digit series containing 12 trials each were recorded. Each digit, measuring about 3.5 cm, was displayed individually in the center of the computer screen. The task would always start with a series of three digits, and the participant was asked to repeat the sequence in direct order. If the child had a performance higher than 50%, that is, more than six correct trials in each series, gradually, others with more digits were presented.
It was considered as the result of the span the last series in which there was more than 50% accuracy. The responses were recorded and stored for later analysis using features of the software used. Tests were applied individually, in an insulated room, using an Acer notebook. During the whole test, partici-pants remained seated at a distance of approximately 50 cm from the monitor. Prior to the testing, participants received instructions on how they should proceed and received training consisting of about 15 trials.
Intelligence
Raven’s Colored Progressive Matrices test
with increasing levels of dificulty. Each item features incom-plete matrices (lack of a component), and the participant is asked to identify the missing component, selecting one of the six alternatives present in each item. The total score is the number of correct answers obtained by the participant. The score is then converted to percentile according to the age of the participant, which relects the general intellec-tual capacity.
The test was administered individually, in an insulated room, using a booklet containing the designs to be analyzed by the participant.
Raven’s Progressive Matrices test
This test(28), similar to the Raven’s CPM test, is aimed at teenagers and adults. Therefore, in this study, it was applied in two 12-year-old children from the sample. This version is composed of 60 problems divided into ive sets each with 12 problems (A, B, C, D, and E). Similarly to the colored version, the raw score is converted into percentile, which provides the classiication of the intelligence level. This test was also applied individually, in an insulated room, using a booklet containing the drawings to be analyzed by the participant.
In both intelligence tests applied, the percentile value obtained was converted into IQ, considering the Percentile– IQ conversion table(29).
RESULTS
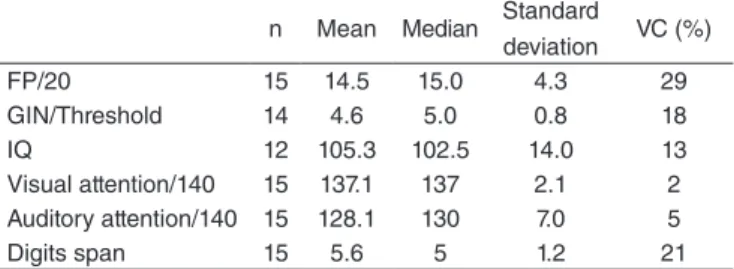
Table 2 shows the descriptive values obtained for each test applied (number of correct answers), considering the number of participants, the mean, median, standard deviation, and coefi-cient of variation. A high standard deviation for the Frequency Pattern test could be observed, especially considering the coef-icient of variation, which represents the standard deviation related to the mean obtained by the group. There were no par-ticipants with IQs in the borderline range (70–79) or indicative of intellectual disability (under 70).
From these values, a correlation was veriied between the variables through Spearman’s correlation (Table 3), consider-ing the followconsider-ing classiication: values 0–20%, bad correla-tion; 20–40%, poor correlacorrela-tion; 40–60%, regular correlacorrela-tion; 60–80%, good correlation; and 80–100%, excellent correla-tion. We adopted a signiicance level of 0.05 (5%).
Regarding the Frequency Pattern test, there was a signiicant, positive, and good correlation between age (p<0.01; 75.6%).
A regular positive correlation was also recorded, with a trend toward signiicance between the test in question and auditory attention (p=0.062; 49.3%).
Regarding the GIN test, there was only a trend toward sig-niicance in the negative correlation between the test in ques-tion and the visual attenques-tion ability (p=0.095; -46.4%), which is considered normal.
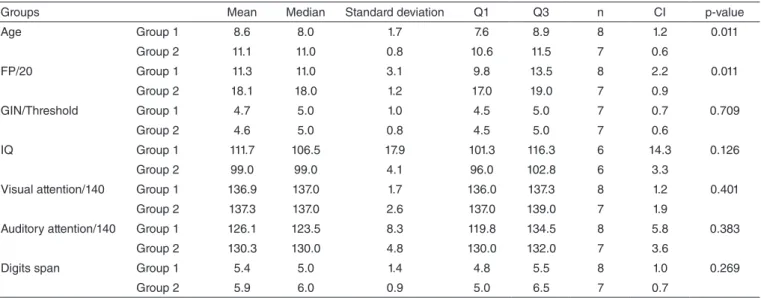
Taking into account the high variability found in performance for the Frequency Pattern test, we used the igure for median (15) to divide the group into two subgroups and make a new analysis: group 1 – weak performance in the Frequency Pattern test (≤15) and group 2 – strong performance in the Frequency Pattern test (>15). Thus, group 1 consisted of eight individu-als and group 2 consisted of seven. From the subdivision, the performances of groups were compared in each of the other variables (IQ, age, memory, and attention). The Mann–Whitney
U-test was used, with a signiicance level of 0.05 (Table 4). As in the irst analysis, the groups differed signiicantly only regarding the age variable (weak Frequency Pattern = 8.6/strong Frequency Pattern = 11.1, p<0.011). There was no signiicant difference between the other variables.
DISCUSSION
The main objective of this study was to investigate the effect of variables such as IQ, age, memory, and attention in auditory temporal processing tests. For the Frequency Pattern, results indicated a performance standard expected for the age group considered(30) and improvement in performance correlated with increasing age. In the second analysis for the same test, both differed only regarding the age variable, and the group with the worst performance in the test had a signiicantly lower mean age. The performance on the GIN test was also within the expected range for the age group(31), but did not indicate correlation with the variables considered.
Considering speciically the age group studied (7–12 years), these results may point to two main assumptions: (1) the perfor-mance, in relation to the temporal ordering ability, can be inlu-enced by maturational processes; and (2) the performance for the temporal resolution ability, assessed by the GIN test, was not inluenced by maturational factors or even nonsensory factors.
Just as in this study, a number of others also reported improved performance on tasks of temporal ordering, associ-ated with the changes resulting from maturational processes for the age group in question(9,10,15). It is still questioned whether the changes are restricted to sensory aspects (speciically related to the auditory nervous system) or if they could also be attrib-uted to maturational changes at higher levels, which could relect on luctuating attention, for example. Researchers have shown a correlation between age and performance in children aged 6–11 years in temporal tests involving frequency(14), but this variability, associated with maturational factors, was also present in children of the same age, with some showing per-formance similar to that of adults. Authors concluded that immaturity, in the age group in question, is more related to individual differences among children and not to a functional immaturity that would be necessarily present in all of them. Table 2. Group’s performance (number of correct answers) in each
of the tests
n Mean Median Standard
deviation VC (%)
FP/20 15 14.5 15.0 4.3 29
GIN/Threshold 14 4.6 5.0 0.8 18
IQ 12 105.3 102.5 14.0 13
Visual attention/140 15 137.1 137 2.1 2 Auditory attention/140 15 128.1 130 7.0 5
Digits span 15 5.6 5 1.2 21
Moreover, this immaturity seems to be related not only with sensory aspects but also with some other aspect involving the perception, storage, or recalling of sound, or even with certain action in response to sound.
Regarding the IQ variable, the group’s score was rated as average, according to the Brazilian standard(32). As for the absence of correlation, the results support other indings that also questioned the effect of cognitive performance in auditory temporal tests(17). Even so, the effect of this variable is contro-versial, as other authors have found opposite results, that is, an association between sensory aspects, shown by temporal tests, and nonsensory aspects, presented through association with several psychometric measures related to IQ. Perhaps the controversy is related to the diversity of assessment tools used in the studies, a factor that complicates the comparison between the indings as they include a range of underlying intelligence skills, considering verbal and nonverbal, luid and crystallized skills.
In this study, the percentiles of Raven’s test were con-verted into IQ considering their correlation observed with the Wechsler Intelligence Scales(27). The Raven’s test exam-ines the luid component (which may vary over time) of the general intelligence model known as “g factor”, which also includes other (more stable) crystalline component represented by the vocabulary tests. The general intelligence inluences performance in activities that require cognitive demands with various levels of complexity. Thus, the absence of signiicant
correlation between intelligence and performance on auditory processing tests used in this study may relect the fact that participants present IQs above 80 (lower limit of the normal range) and a consequent adaptation in understanding and fol-lowing the instructions of the tasks.
Visual and auditory attention tests, as well as the Digit Span, have no regulation, given that the protocols used were devel-oped by the authors, based on previous studies carried out with adults. Even so, for attention tests, the group apparently per-formed well, and obtained more than 90% accuracy for both.
For the Digit Span test, the values were similar to those of another study carried out with children with typical devel-opment(33) in which the same test was applied with a differ-ent protocol (Auditory Digit Span). Regarding the existence of correlations, the auditory attention variable, in this study, indicated correlation only tending to signiicance, hindering a conclusion about a possible effect of this speciic variable.
Concerning the temporal resolution ability, the results of this study showed no correlation with the abilities tested, only a trend to signiicance for the visual attention ability. In addi-tion, the standard deviation value obtained was low, which also represents a low variability of responses for that test. Speciically considering the age variable, this result supports other indings that veriied no correlation between age and performance in the GIN test for children aged 7–18 years. A low variability of responses was also observed(20). Authors concluded that maturation for this ability is likely to occur Table 3. Correlation between variables
Age FP/20 GIN/Threshold IQ Visual attention/140 Auditory attention/40 Digits span
FP/20 Correlation (%) 75.6 -4.9 -43.7 38.8 49.3 38.9
p-Value 0.001 0.867 0.155 0.153 0.062 0.152
GIN/Threshold Correlation (%) -1.8 -4.9 -17.3 -46.4 -31.4 -8.5
p-Value 0.951 0.867 0.611 0.095 0.274 0.773
Caption: FP = frequency pattern; GIN = gap in noise; IQ = intelligence quocient
Table 4. Comparison between subgroups
Groups Mean Median Standard deviation Q1 Q3 n CI p-value
Age Group 1 8.6 8.0 1.7 7.6 8.9 8 1.2 0.011
Group 2 11.1 11.0 0.8 10.6 11.5 7 0.6
FP/20 Group 1 11.3 11.0 3.1 9.8 13.5 8 2.2 0.011
Group 2 18.1 18.0 1.2 17.0 19.0 7 0.9
GIN/Threshold Group 1 4.7 5.0 1.0 4.5 5.0 7 0.7 0.709
Group 2 4.6 5.0 0.8 4.5 5.0 7 0.6
IQ Group 1 111.7 106.5 17.9 101.3 116.3 6 14.3 0.126
Group 2 99.0 99.0 4.1 96.0 102.8 6 3.3
Visual attention/140 Group 1 136.9 137.0 1.7 136.0 137.3 8 1.2 0.401
Group 2 137.3 137.0 2.6 137.0 139.0 7 1.9
Auditory attention/140 Group 1 126.1 123.5 8.3 119.8 134.5 8 5.8 0.383
Group 2 130.3 130.0 4.8 130.0 132.0 7 3.6
Digits span Group 1 5.4 5.0 1.4 4.8 5.5 8 1.0 0.269
Group 2 5.9 6.0 0.9 5.0 6.5 7 0.7
earlier because, by the age of 7, children already seem to pres-ent adult-like performance.
Other researchers have shown different results(15,33). Both studies found improved response in children aged 6–14 years for gap detection tests, suggesting the development of matu-rational processes even at this age. One hypothesis for these differences may be related to differences between tasks and stimuli used in studies. For example, whereas the GIN test, applied in the present study and in another(20), presents gaps with values ixed at 2, 3, 4, 5, 6, 8, 10, 12, 15, and 20 ms, one study(15) applied a test with parameters that would adapt according to the individual’s performance. Thus, by a computer program, the gap is reduced or increased by 20%, depend-ing on the number of successive correct or incorrect answers. This allows more detailed investigation of the lower threshold for the detection of the gap, as it seeks the threshold from an ininite number of gap values. This procedure probably leads to greater variability of responses, which can be seen in the results of one of the studies(15).
Methodological differences between the studies cited also occurred in the aforementioned studies on temporal ordering, such as the Frequency Pattern Test; still, there is no consensus regarding the indings in studies on the effect of age on that kind of task, for example. Therefore, considering the fact that both tests applied present differences regarding correla-tions, it is suggested that perhaps, in spite of these tests being classiied and used clinically to investigate the same ability (temporal auditory processing), the tasks that compose each one of them may demand different abilities, unrelated to the sensory aspect, or even different levels of difficulty for the other aspects. This statement can also be conirmed con-sidering that, in this study, no correlation was found between the performance results in both tests, which shows that the performance in one temporal ability, such as temporal order-ing, is not necessarily related to performance in other abili-ties, skills such as temporal resolution.
In conclusion, the results of this study show differences for both tests regarding the inluence of the variables tested. Thus, in the Frequency Pattern test, the presence of correla-tions only for the age variable suggests that the variability of responses found may be related to maturational factors spe-ciically related to the sensory system. As for the GIN test, there wasn’t great variability of responses, perhaps because of the characteristics that compose it and not because of the temporal resolution ability itself. Future research is needed, considering two major problems with this study: small num-ber of participants and the absence of different tasks to assess the same skill.
CONCLUSION
Temporal abilities considered seem to be inluenced by dif-ferent factors: while the temporal ordering ability seems to be inluenced by maturational processes, the performance for the temporal resolution ability was not influenced by any of the aspects investigated.
*CFBM was responsible for data collection, tabulation, analysis, and drafting of the manuscript; ECZ collaborated with data collection and tabulation, and drafting of the manuscript; DTR collaborated with the data collection and tabulation; DSFV was responsible for the overall direction of the execution stages and drafting of the manuscript; ES was responsible for the overall direction of the execution stages and drafting of the manuscript.
REFERENCES
1. Tallal P, Piercy M. Defects of non-verbal auditory perception in children with developmental aphasia. Nature. 1973;241(5390):468-9.
2. Tallal P. Auditory temporal perception, phonics, and reading disabilities in children. Brain Lang. 1983;9(2):182-98.
3. Nagarajan S, Mahncke H, Salz T, Tallal P, Roberts T, Merzenich MM. Cortical auditory signal processing in poor readers. Proc Natl Acad Sci U S A. 1999;96(11):6483-8.
4. Ahissar M, Protopapas A, Reid M, Merzenich MM. Auditory processing parallels reading abilities in adults. Proc Natl Acad Sci U S A. 2000;97(12):6832-7.
5. Benasich AA, Tallal P. Infant discrimination of rapid auditory cues predicts later language impairment. Behav Brain Res. 2002;136(1):31-49. 6. Sharma M, Purdy SC, Newall P, Wheldall K, Beaman R, Dillon H. Electrophysiological and behavioral evidence of auditory processing deicits in children with reading disorder. Clin Neurophysiol. 2006;117(5):1130-44. 7. Murphy CF, Schochat E. How auditory temporal processing deicits relate
to dyslexia. Braz J Med Biol Res. 2009;42(7):647-54.
8. Moore DR. Auditory processing disorder (APD)-potential contribution of mouse research. Brain Res. 2006;1091(1):200-6.
9. Schochat E, Musiek FE. Maturation of outcomes of behavioral and electrophysiologic tests of central auditory function. J Commun Disord. 2006;39(1):78-92.
10. Dawes P, Bishop DV. Maturation of visual and auditory temporal processing in school-aged children. J Speech Lang Hear Res. 2008;51(4):1002-15.
11. Halliday LF, Taylor JL, Edmondson-Jones AM, Moore DR. Frequency discrimination learning in children. J Acoust Soc Am. 123(6):4393-402. 12. Abdo AG, Murphy CF, Schochat E. Hearing abilities in children
with dyslexia and attention deicit hyperactivity disorder. Pro Fono. 2010;22(1):25-30.
13. Moore DR, Ferguson MA, Edmondson-Jones AM, Ratib S, Riley A. Nature of auditory processing disorder in children. Pediatrics. 2010;126(2):e382-90.
14. Moore DR, Cowan JA, Riley A, Edmondson-Jones AM, Ferguson MA. Development of auditory processing in 6- to 11-yr-old children. Ear Hear. 2011;32(3):269-85.
15. Irwin RJ, Ball AK, Kay N, Stillman JA, Rosser J. The development of auditory temporal acuity in children. Child Dev. 1985;56(3):614-20. 16. Helmbold N, Troche S, Rammsayer T. Temporal information processing
and pitch discrimination as predictors of general intelligence. Can J Exp Psychol. 2006;60(4):294-306.
17. Rosen S, Cohen M, Vanniasegaram I. Auditory and cognitive abilities of children suspected of auditory processing disorder (APD). Int J Pediatr Otorhinolaryngol.74(6):594-600.
18. Pinheiro M, Musiek F. Assesment of central auditory dysfunction: foundations and clinical correlates. Baltimore: Williams & Wilkins; 1985. 19. Musiek FE, Pinheiro ML, Wilson DH. Auditory pattern perception in
’split brain‘ patients. Arch Otolaryngol. 1980;106(10): 610-2. 20. Shinn JB, Chermak GD, Musiek FE. GIN (Gaps-In-Noise) performance
in the pediatric population. J Am Acad Audiol. 2009;20(4):229-38. 21. Musiek FE. Frequency (pitch) and duration patterns tests. J Am Acad
Audiol. 1994;5(4):265-8.
23. Guy J, Rogers M, Cornish K. Age-related changes in visual and auditory sustained attention in preschool-aged children. Child Neuropsychol. 2013;19(6):601-14.
24. Seli P, Cheyne JA, Barton KR, Smilek D. Consistency of sustained attention across modalities: comparing visual and auditory versions of the SART. Can J Exp Psychol. 2012;66(1):44-50.
25. Aylward GP, Brager P, Harper DC. Relations between visual and auditory continuous performance tests in a clinical population: a descriptive study. Dev Neuropsychol. 2002;21(3):285-303.
26. Baddeley AD, Hitch GJ. Working memory. In: Bower GA, editor. The psychology of learning and motivation: advances in research and theory. New York: Academic Press; 1974. p. 47-90.
27. Angelini AL, Alves ICA, Custódio EM, Duarte WF, Duarte JLM. Manual das matrizes progressivas de Raven. São Paulo: Centro Editor de Testes e Pesquisas em Psicologia; 1999.
28. Raven J. Teste das matrizes progressivas escala geral – manual. 3ª ed. Rio de Janeiro: Centro Editor de Psicologia Aplicada; 2002.
29. Strauss E, Sherman EMS, Spreen O. A compendium of neuropsychological tests: administration, norms, and commentary. 3rd ed. New York: Oxford; 2006. 30. Schochat E, Rabelo CM, Sanins MD. Processamento auditivo central:
testes tonais de padrão de freqüência e duração em indivíduos normais de 7 a 16 anos de idade. Pró-Fono. 2000;12(2):119-22.
31. Amaral MIR, Colella-Santos MF. Resolução temporal: desempenho de escolares no teste GIN – Gaps-in-noise test. Braz J Otorhinolaryngol. 2010;76(6):745-52.
32. Nascimento E, Figueiredo VLM. WISC-III e WAIS-III: alterações nas versões originais americanas decorrentes das adaptações para uso no Brasil. Psicol Relex Crit. 2002;15(3):603-12.