Obesity and underweight among Brazilian
elderly. The Bambuí Health and Aging Study
Obesidade e baixo peso entre idosos
brasileiros. Projeto Bambuí
1 Laboratório de Epidemiologia e
Antropologia Médica, Centro de Pesquisas René Rachou, Fundação Oswaldo Cruz. Av. Augusto de Lima 1715, Belo Horizonte, MG 30190-002, Brasil. [email protected] [email protected] 2 Faculdade de Medicina, Universidade Federal de Minas Gerais. Rua Alfredo Balena 190, Belo Horizonte, MG 30130-100, Brasil.
Sandhi M. Barreto 1,2 Valéria M. A. Passos 1
Maria Fernanda F. Lima-Costa 1,2
Abstract The coexistence of obesity (body mass index, BMI ≥30kg/m2) and underweight (BMI ≤ 20kg/m2) and related factors were investigated among all residents aged 60+ years in Bambuí, Minas Gerais State, using multinomial logistic regression. 1,451 (85.5%) of the town’s elderly participated. Mean BMI was 25.0 (SD = 4.9kg/m2) and was higher for women and decreased with age. Prevalence of obesity was 12.5% and was positively associated with female gender, family income, hypertension, and diabetes and inversely related to physical activity. Underweight af-fected 14.8% of participants, increased with age, and was higher among men and low-income families. It was negatively associated with hypertension and diabetes and directly associated with Trypanosoma cruziinfection and ≥2 hospitalizations in the previous 12 months. Both obe-sity and underweight were associated with increased morbidity. The association of underweight with T. cruziinfection, increased hospitalization, and low family income may reflect illness-re-lated weight loss and social deprivation of elderly in this community. Aging in poverty may lead to an increase in nutritional deficiencies and health-related problems among the elderly. Key words Aging Health; Obesity; Body Mass Index
Resumo A coexistência de obesidade (Índice de Massa Corpórea: IMC ≥30kg/m2) e de baixo pe-so (IMC ≤20kg/m2) e seus fatores relacionados foram investigados em 1.451 idosos, 85,5% da população com 60+ anos residente em Bambuí, Minas Gerais, utilizando-se a análise logística multinomial. O IMC (média = 25,0; DP = 4,9kg/m2) foi maior nas mulheres e diminuiu com a idade. A obesidade ocorreu em 12,5% dos idosos; foi associada positivamente ao sexo feminino, à maior renda familiar e presença de hipertensão e diabete, e inversamente à atividade física. O baixo peso ocorreu em 14,8% dos idosos, aumentou com a idade, foi maior nos homens e nas famílias com menor renda, esteve inversamente associado à presença de hipertensão e de hiper-glicemia e diretamente associado à infecção por Tripanossoma cruzie duas ou mais internações no último ano. A obesidade e o baixo peso foram ambos associados a uma maior morbidade. A associação do baixo peso com a infecção por T. cruzi, maior hospitalização e menor renda pode estar refletindo a perda de peso secundária a doenças ou à privação social do idoso nesta comu-nidade. Envelhecer na pobreza pode aumentar as deficiências nutricionais e os problemas de saúde entre idosos.
Introduction
Epidemiological, demographic, and nutritional transitions are taking place in many develop-ing countries. The elderly population is already the fastest-growing group in Brazil, and in-creases of up to 300% in the older population are expected in many developing countries within the next 30 years, especially in Latin America and Asia (Truelsen et al., 2001). Diets and activity patterns are also changing rapidly in most developing countries and problems of obesity and malnutrition are likely to coexist, as are communicable and non-communicable diseases (Darnton-Hill & Coyne, 1998), espe-cially in countries with great socioeconomic disparities such as Brazil. In fact, the concomi-tance of malnutrition and obesity has been re-ported in a very low-income population in Northeast Brazil (Florêncio et al., 2001). In ad-dition, a worrisome increase in the prevalence of obesity has been observed in three Brazilian surveys conducted between 1973 and 1996 (Lotufo, 2000).
Epidemiological studies on nutrition in the elderly indicate that both overweight and un-derweight measured by body mass index (BMI) are associated with greater risk of morbidity and mortality (Vellas et al., 1997). Overall, the relationship between BMI and all-cause mor-tality has been described as U- or J-shaped (Vellas et al., 1997; Visscher et al., 2000; WHO, 1998). Epidemiological studies of minimal mor-tality points in relation to BMI in developed countries suggest that the “best” BMI (the nadir in the “U-curve”) gradually increases with age in both genders, with no consistent differences between men and women (Visscher et al., 2000). Despite being an important predictor of morbidity and mortality in seniors, little is known about the anthropometry of aging and possible weight-related health conditions among the el-derly in a context of epidemiological transition. This study describes the distribution of BMI among the elderly in a community and investi-gates the association of obesity and under-weight with selected health conditions and so-cioeconomic differences in this group.
Methods
The present study analyzes the baseline data of the Bambuí Health and Aging Study (BHAS), a population-based cohort study of older adults (60+ years) in Brazil (Lima-Costa et al., 2000).
The study involved the elderly popula-tion living in Bambuí town, Minas Gerais State,
Southeast Brazil. The municipality of Bambuí had some 15,000 inhabitants in the urban area (or Bambuí town proper) in 1991. Bambuí was formerly an important endemic area for Cha-gas disease. Even though transmission of
Try-panosoma cruzi was interrupted around 20
years ago, prevalence of the infection remains high among the elderly (38%) because of a co-hort effect (Lima-Costa et al., 2002). The main causes of death in this municipality in 1996 were stroke, Chagas disease, ischemic heart disease, and chronic obstructive pulmonary disease (Lima-Costa et al., 2000).
A complete census was conducted in Bam-buí town in November and December 1996 for the identification of elderly participants in the baseline cohort study. All residents aged 60+ years (n = 1,742) were selected for interviews and examination (blood tests and anthropo-metric and blood pressure measurements) (Li-ma-Costa et al., 2000).
The following variables from the baseline interview were included in this study: (1) socio-demographic characteristics (age, gender, mar-ital status, schooling, and monthly income); (2) lifestyle (current smoking status and physical activity); (3) self-rated health in the previous 6 months; (4) health services indicators (doctor visits in past 12 months and hospitalizations in past 12 months). Monthly family income was reported as “number of times the prevailing Brazilian monthly minimum wage” (approxi-mately US$ 100).
When an elderly participant could not be interviewed because of cognitive deficit or for some other health reason, an appropriate proxy was used. Proxy respondents were not asked personal questions that required a subjective statement.
Anthropometric measures were performed by specially trained health technicians, using standard equipment, with individuals wearing light clothing and no shoes. Weight (kg), height (cm), waist circumference (cm), and hip cir-cumference (cm) were measured with individ-uals wearing light clothing. The reliability of these measurements was ascertained repeat-ing them in a 5% sample of all participants. Two high-precision digital scales (range 0-150kg x 0.1kg) and a CMS Portable Stadiometer kit (CMS Weighing Equipment Ltd., London) were em-ployed for anthropometric measurements.
measurements. Hypertension was defined as di-astolic blood pressure (DBP) ≥90mmHg and/or systolic blood pressure (SBP) ≥140mmHg and/ or current use of antihypertensive medication at the time of interview ( JNC, 1993). Further details have been published elsewhere (Barreto et al., 2001).
Blood samples were collected after 12-hour fasting. Plasma glucose levels were determined using an automated analyzer (Eclipse Vitalab, Merck, Netherlands). Diabetes was defined as fasting blood glucose ≥126mg/dl and/or cur-rent use of hypoglycemic medication. Hemato-logical tests were performed with an electronic counter (Coulter Counter T890, United States). Anemia was defined as hemoglobin levels < 12mg% for women and < 13 mg% for men (Tietz et al., 1992). The presence of T. cruzi an-tibodies was detected using an indirect hemag-glutination test and an enzyme-linked im-munosorbent assay (Biolab and Abbott Brazil, respectively). T. cruzi infection was defined when the serum samples showed positive re-sults in both serological tests.
Descriptive statistics were used to fully ex-plore the data. One sample t-test was used for comparisons between means and designed-based Pearson chi-square test for proportions. Since we lack population-based weight and height parameters for Brazilian elderly, and because there is no consensus in the literature with respect to the definition of underweight for elderly (Heiat et al., 2001; Inelmen et al., 2000; Murasco & Bernstein, 1998), we defined underweight and obesity as the mean body mass index (BMI = weight/height squared) ± one standard deviation. In this community these cut-off values were 20 and 30kg/m2,
re-spectively.
Because the dependent variable is com-posed of three categories (BMI ≤20, BMI ≥30,
and 20 > BMI < 30kg/m2), we employed
multi-nomial logistic regression techniques to esti-mate the association of BMI with independent variables (Hamilton, 1993). BMI over 20 and less than 30kg/m2was taken as the reference
category. The analysis was carried out using the Stata statistical software.
This study was conducted according to the Helsinki Declaration and approved by the Ethics Committee of the Oswaldo Cruz Foundation. Participation was voluntary, and a signed in-formed consent form was obtained. Interviews, physical measurements, and blood tests were conducted from January to August 1997(Lima-Costa et al., 2000).
Results
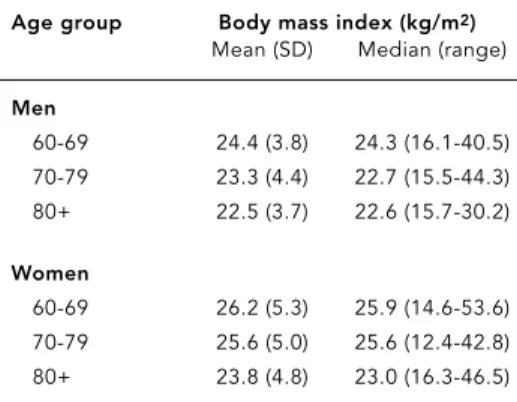
From a total of 1,742 residents aged 60+ years, 1,443 (83.1%) participated in this study. Table 1 shows the BMI (kg/m2) distribution for men and women by age group. Mean total BMI was 25.0kg/m2(SD = 4.9), was lower for males than
females, and decreased significantly with age. A total of 208 (14.4%) individuals were under-weight (BMI ≤20kg/m2) and 185 (12.8%) were
obese (BMI ≥30kg/m2).
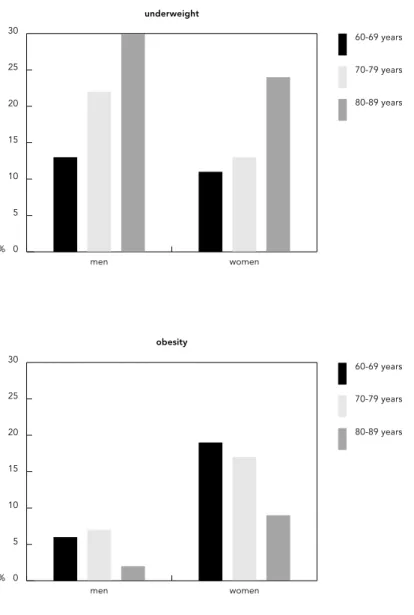
Figure 1 shows the prevalence of under-weight and obesity according to age group for men and women. Mean BMI was 18.1kg/m2
(95% CI: 17.8-18.4kg/m2) among individuals
with underweight, 34.0kg/m2(95% CI: 33.4-34.6kg/m2) among those overweight, and 25.2kg/m2(95% CI: 25.0-25.4) in the reference
category. Waist to hips ratio (WHR) increased with BMI, with 0.89 (95% CI: 0.88-0.90) in the lower BMI category, 0.93 (95% CI: 0.93-0.94) for the reference category, and 0.94 (95% CI: 0.93-0.95) among obese individuals, with no signifi-cant difference between the latter group and the reference category.
Obesity was more common among women, and prevalence decreased with age, but this decrease was only statistically significant among women. Unlike underweight, the initial analysis shows that obesity was more common among individuals with higher income and ed-ucational levels. Age-adjusted OR of obesity were 2.39 (95% CI: 1.38-4.16) for individuals with monthly income ≥6 times the Brazilian minimum wage (± US$600) and 3.02 (95% CI: 1.69-5.4) for those with 8+ years of schooling.
Underweight was significantly more com-mon acom-mong men than women and increased
Table 1
Distribution of body mass index (kg/m2) in community elderly by age group and sex. BHAS, 1997.
Age group Body mass index (kg/m2)
Mean (SD) Median (range)
Men
60-69 24.4 (3.8) 24.3 (16.1-40.5) 70-79 23.3 (4.4) 22.7 (15.5-44.3) 80+ 22.5 (3.7) 22.6 (15.7-30.2)
Women
directly with age in both genders. There was a highly statistically significant declining trend in the age- and sex-adjusted prevalence of un-derweight with increasing income and school-ing: OR of 0.50 (0.31-0.82), 0.31 (0.13-0.74), and 0.28 (0.12-0.66) for monthly family income equal to 2-3.9, 4-5.9, and ≥6 times the Brazilian min-imum wage and OR equal to 0.60 (0.42-0.86), 0.54 (0.37-0.79), and 0.15 (0.06-0.45) for zero, 1-3, 4-7, and 8+ years of schooling, respectively. Since income and schooling are highly cor-related (χ2= 327; p < 0.001) and data on income were missing for a few participants, only
school-ing was entered in the multivariate analysis. There were no significant gender differences in the direction and magnitude of the associa-tions of obesity and underweight with the fac-tors presented in Table 2 and 3. Therefore, the results of the multivariate analysis are present-ed jointly for men and women and adjustpresent-ed for gender.
Table 2 shows the results of the multivariate analysis of underweight and obesity in relation to social-demographic characteristics, life-style factors, and selected health conditions. Obesity was positively and significantly associ-ated with physical inactivity, hypertension, and diabetes and negatively associated with ane-mia. Underweight was inversely and signifi-cantly associated with hypertension and dia-betes. It was much more frequent among smok-ers and especially among former smoksmok-ers, as well as those with T. cruzi infection and with anemia.
Analysis of health perception and health care use (Table 3) shows that obese individuals tend to self-rate their health worse than those in the reference BMI category, but this differ-ence was not statistically significant for weight individuals. It also shows that under-weight individuals report more hospitaliza-tions in the previous 12 months, while obese persons reported more doctor visits during the previous year.
Discussion
We found a considerable prevalence of obesity and underweight in this community, with a slightly greater preponderance of the latter. Age and gender characteristics associated with both obesity and underweight in our study are consistent with results from other studies (Ost-bye et al., 1995; Visscher et al., 2000).
Obesity is a growing problem even in devel-oping regions like ours. It varies greatly be-tween countries and is more common in fe-males and in urban populations. In this com-munity the prevalence of obesity is closer to that found among adults in Europe (Seidell & Flegal, 1997) and in India (Zargar et al., 2000). However, unlike many developed countries, in this elderly community obesity was more com-mon acom-mong non-poor as compared to poor in-dividuals ( James et al., 1997; Michaud et al., 1998). The combination of obesity with better socioeconomic condition has also been de-scribed in other studies in Brazil (Monteiro et al., 2002; Sichieri et al., 1994) and in other de-veloping countries. In China and India, higher
Figure 1
Prevalence of underweight and obesity among older adults by gender and age group. BHAS, 1997.
% 0 5 10 15 20 25 30
80-89 years 70-79 years 60-69 years
women men
underweight
% 0 5 10 15 20 25 30
80-89 years 70-79 years 60-69 years
women men
income levels, particularly in urban areas, were also associated with consumption of a more fat-rich diet and with problems of obesity (Mehta & Shingarpure, 2000; Popkin et al., 1993). Excess weight seems to appear first among the affluent and then among low-in-come classes. The main causes appear to be a nutritional transition to lipid-rich diets com-bined with reduced physical activity.
Our results show that obesity is positively associated with hypertension and diabetes. Obesity is a complex metabolic disorder fre-quently associated with insulin resistance, hy-perinsulinemia, accelerated atherosclerosis, hypertension, and type II diabetes (Solomon & Manson, 1997). The association between obe-sity and inactivity has also been described in other studies. Actually, decreased level of
over-Table 2
Association of underweight and obesity with selected characteristics in the multivariate analysis (Reference category: 20 kg/m2< BMI < 30kg/m2). BHAS, 1997.
Factors Reference group Underweight Underweight Obesity Obesity
(n = 1,050) (n = 208) ORa(95% CI) (n = 185) ORa(95% CI)
Gender
Male 613 98 1.0 35 1.0
Female 437 110 1.1 (0.8-1.6) 150 3.1 (1.9-4.9)
Age group (years)
60-69 643 103 1.0 109 1.0
70-79 317 73 1.4 (1.0-2.0) 60 0.9 (0.6-1.3)
80+ 92 34 2.5 (1.5-4.0) 6 0.3 (0.2-0.8)
Schooling (years)
0-3 313 94 1.0 45 1.0
4-7 347 63 0.5 (0.3-0.8) 61 1.4 (0.9-2.2)
8-10 306 47 0.3 (0.1-0.7) 53 1.3 (0.8-2.2)
11+ 84 4 0.3 (0.1-0.7) 26 3.0 (1.6-5.6)
Smoker
Never 642 87 1.0 128 1.0
Former 236 49 3.4 (2.3-5.2) 43 0.7 (0.4-1.2)
Current 172 72 1.7 (1.1-2.6) 14 1.4 (0.9-2.2)
Physical inactivity
No 737 126 1.0 105 1.0
Yes 313 82 1.3 (0.9-1.8) 80 1.8 (1.3-2.5)
Hypertension
No 406 107 1.0 40 1.0
Yes 644 101 0.6 (0.4-0.8) 145 2.1 (1.4-3.1)
Diabetes
No 902 195 1.0 132 1.0
Yes 147 12 0.4 (0.2-0.8) 53 2.4 (1.6-3.4)
Anemia
No 1,009 195 1.0 184 1.0
Yes 41 13 2.0 (1.0-4.0) 1 0.1 (0.1-0.9)
T. cruziinfection
No 675 101 1.0 123 1.0
Yes 370 104 1.7 (1.2-2.3) 59 1.0 (0.7-1.5)
all physical activity is a major contributor to the rise in overweight and obesity rates. Ac-cording to a report from the WHO (1998), lack of exercise and obesity contribute to up to one third of colon, breast, kidney, and digestive-tract cancers. However, the relative risk of death associated with excess adiposity appears to be less for older than for younger and middle-aged adults (Heiat et al., 2001; Stevens et al., 1999). Actually, epidemiological studies do not support overweight (BMI = 25-29kg/m2), as
op-posed to obesity (≥30kg/m2), as conferring an excess mortality risk to the elderly (Heiat et al., 2001; Reynolds et al., 1999).
Obese elderly reported more doctor visits and perceived their health worse than those in the normal weight range. It has been observed that obese people tend to have more health problems and rate their health as fair or poor (Ostbye et al., 1995). Perhaps these two factors express the same feeling of poor health and a tendency of modern society to indistinctly con-demn overweight.
While obesity was more common among families earning around US$600 or more per month, the prevalence of underweight in-creased inversely with monthly family income, with a highly significant linear trend. Malnutri-tion is a serious threat to elderly life because it can lead to lower physical strength, greater
in-activity, higher risk of accidents, and a weak-ened immune system, among other health problems (Chandra, 1992; James et al., 1997).
The increased number of hospitalizations among underweight individuals may be an in-dicator of worse health conditions in this group. Nutritional deficiencies, frequently ob-served among the frail elderly, have been asso-ciated with increased morbidity and depen-dency. Protein-energy malnutrition appears to be a strong independent risk factor for non-elective hospital readmission, especially among the highest-risk patients, those who are func-tionally independent and cognitively intact (Sullivan, 1992). It has been argued that the in-verse association of weight and mortality in old age is related to smoking and reflects illness-related weight loss. In a longitudinal study, el-derly women with lower energy intake than recommended by international organizations in 1980 were three times more likely to die in 10 years than those with satisfactory energy in-take (Vellas et al., 1997).
The heterogeneity of the elderly population and the high prevalence of chronic and infec-tious diseases may affect (and be affected) by the nutritional status of the population and de-serves further investigation. In this Brazilian community, the burden of Chagas disease was particularly great for the elderly (Lima-Costa,
Table 3
Association of underweight and obesity with health perception and health care use selected in the multivariate analysis. BHAS, 1997
Factors Reference group Underweight Underweight Obesity Obesity
(n) (n) ORa(95% CI) (n) ORa(95% CI)
Visits to doctor in past 12 months
None 226 40 1.0 19 1.0
1 234 41 1.0 (0.6-1.6) 36 1.4 (0.8-2.6)
2+ 590 127 1.0 (0.6-1.5) 130 1.8 (1.1-3.1)
Hospitalization in past 12 months
None 852 144 1.0 146 1.0
1 147 37 1.4 (0.9-2.1) 27 0.8 (0.5-2.2)
2+ 51 27 2.4 (1.4-4.2) 12 1.1 (0.6-2.2)
Self-rated health in past six month
Very good/good 279 40 1.0 39 1.0
Fair 524 98 1.2 (0.8-1.8) 91 1.7 (1.2-2.5)
Poor/very poor 247 91 1.5 (1.0-2.4) 55 1.1 (1.1-2.8)
2002), and the increased association of T. cruzi
infection with underweight suggests that this group is significantly more affected by this im-portant health problem.
The cut-points that we used to define un-derweight and obesity may be conservative. A meta-analysis of the relationship between body weight and all-cause mortality has identified an increased risk of death among older adults with BMI < 23 or > 28kg/m2 (Troiano et al.,
1996). With these references, the prevalence of underweight in this community would increase to 35.0% and of obesity to 24.8%, with under-weight being more prevalent among individu-als with T. cruziinfection (43.1% vs. 30.2%, p < 0.001).
In this study we found an inverse associa-tion between BMI and educaassocia-tion and income, unlike reports from developed countries (Ost-bye et al., 1995; Seidell & Flegal, 1997). A
simi-lar inverse association was also reported in In-dia and appears to express the huge socioeco-nomic disparities existing in most developing countries (Zargar et al., 2000). The economic gap between the rich and poor nations is grow-ing. Meanwhile, income disparity is growing within most countries, especially among devel-oping ones (Darnton-Hill & Coyne, 1998). Brazil is one of the countries with the greatest socioeconomic inequalities in the world. Over 50 million Brazilians live below the poverty line (Barros et al., 1999). Elderly people are particu-larly vulnerable to malnutrition. Even consid-ering that aging is an uneven process, occur-ring more rapidly among the rich than the poor, the coexistence of aging with poverty might lead to an increase in nutritional defi-ciencies and health-related problems among the elderly.
References
BARRETO, S. M.; PASSOS, V. M. A.; FIRMO, J. O. A.; VIDIGAL, P. G. & LIMA-COSTA, M. F. F., 2001. Hy-pertension and clustering of cardiovascular risk factors in a community in Southeast Brazil – The Bambuí Health and Ageing Study. Arquivos Bra-sileiros de Cardiologia, 77:576-581.
BARROS, P. R.; HENRIQUES, R. & MENDONÇA, R., 1999. A Estabilidade Inaceitável: Desigualdade e Pobreza no Brasil. Texto para Discussão 800. Rio de Janeiro: Instituto de Pesquisa Econômica Apli-cada.
CHANDRA, R. K., 1992. Nutrition and immunoregu-lation. Significance for host resistance to tumours and infectious diseases in humans and rodents.
Journal of Nutrition, 122(Sup.):754-757.
DARNTON-HILL, I. & COYNE, E. T., 1998. Feast and famine: Socio-economic disparities in global nu-trition and health. Public Health Nutrition, 1:23-31.
FLORÊNCIO, T M.; FERREIRA, H. S.; FRANCA, A. P.; CAVALCANTE, J. C. & SAWAYA, A. L., 2001. Obesi-ty and undernutrition in a very low-income pop-ulation in the city of Maceió, Northeastern Brazil.
Brazilian Journal of Nutrition, 86:277-284.
Acknowledgements
HAMILTON, L. C., 1993. Interpreting multinomial lo-gistic regression. Stata Technical Bulletin, 13:24-28.
HEIAT, A.; VACCARINO, V. & KRUMHOLS, H. M., 2001. An evidence-based assessment of Federal Guide-lines for overweight and obesity as they apply to elderly persons. Archives of Internal Medicine, 161:1194-1203.
INELMEN, E. M.; GIMENEZ, G. F.; GATTO, M. R.; MIOTTO, F.; SERGI, G.; MARCCARI, T.; GONZA-LEZ, A. M.; MAGGI, S.; PERUZZA, S.; PISENT, C. & ENZI, G., 2000. Dietary intake and nutritional sta-tus in Italian elderly subjects. Journal of Nutri-tion, Health & Aging, 4:91-101.
JAMES, W. P.; NELSON, M.; RALPH, A. & LEATHER, S., 1997. Socio-economic determinants of health. The contribution of inequalities in health. BMJ, 314:1545-1549.
JNC ( Joint National Committee), 1993. The fifth re-port of the Joint National Committee on Detec-tion, EvaluaDetec-tion, and Treatment of High BP.
Archives of Internal Medicine, 153:154-183. LIMA-COSTA, M. F. F.; BARRETO, S. M.; GUERRA, H.
L.; FIRMO, J. O. A.; UCHOA, E. & VIDIGAL, P. G., 2002. Ageing with Trypanosoma cruzi infection in a community where the transmission has been interrupted: The Bambuí Health and Ageing Study (BHAS). International Journal of Epidemiology, 30:887-893.
LIMA-COSTA, M. F. F.; UCHÔA, E.; GUERRA, H. L.; FIRMO, J. O. A.; VIDIGAL, P. G. & BARRETO, S. M., 2000. The Bambuí Health and Ageing Study (BHAS). Methodological approach and prelimi-nary results of a population-based cohort study of the elderly in Brazil. Revista de Saúde Pública, 34:126-135.
LOTUFO, P. A., 2000. Increasing obesity in Brazil: Pre-dicting a new peak of cardiovascular mortality.
São Paulo Medical Journal, 118:161-162.
MEHTA, P. & SHRINGARPURE, B., 2000. Diet nutri-tion and health profile of elderly populanutri-tion of urban Baroda. Indian Journal of Public Health, 44:124-128.
MICHAUD, C.; BAUDIER, F.; LONDOU, A.; LE BEHI-AN, G.; JANVRIN, M. P. & ROTILY, M., 1998. Food habits, consumption and knowledge of a low in-come French population. Santé Publique, 10:333-347.
MONTEIRO, C. A.; CONDE, W. L. & POPKIN, B. M., 2001. Independent effects of income and educa-tion on the risks of obesity in the Brazilian adult population. Journal of Nutrition, 131:881S-886S. MURASCO, D. M. & BERNSTEIN, E. D., 1998.
Nutri-tion and Aging. In: Principles of Geriatric Medi-cine and Gerontology(W. R. Hazzard, J. P. Blass, W. H. Ettinger Jr., J. B. Halter & J. G. Ouslander, ed.), pp. 81-116, 4thEd., New York: McGraw-Hill.
OSTBYE, T.; POMERLEAU, J.; SPEECHLEY, M.; PED-ERSON, L. L. & SPEECHLEY, K. N., 1995. Corre-lates of body mass index in the 1990 Ontario Health Survey. Canadian Medical Association Journal, 152:811-817.
POPKIN, B. M.; KEYOU, G.; ZHAI, F.; GUO, X.; MA, H. & ZOHOORI, N., 1993. The nutrition transition in China: A cross-sectional analysis. European Jour-nal of Clinical Nutrition, 47:333-346.
REYNOLDS, M. W.; FREDMAN, L.; LANGENBERG, P. & MAGAZINER, J., 1999. Weight, weight change, mortality in a random sample of older communi-ty-dwelling womwn. Journal of the American Geriatrics Society, 47:1409-1414.
SEIDELL, J. C. & FLEGAL, K. M., 1997. Assessing obe-sity: Classification and epidemiology. British Medical Bulletin, 53:238-252
SICHIERI, R.; COITINHO, D. C.; LEAO, M. M.; RECINE, E. & EVERHART, J. E., 1994. High tempo-ral, geographic and income variation in body mass index among adults in Brazil. American Journal of Public Health, 84:793-798.
SOLOMON, C. G. & MANSON, J. E., 1997. Obesity and mortality: A review of the epidemiologic data.
American Journal of Clinical Nutrition, 66(Sup. 4):1044S-1050S.
STEVENS, J.; CAI, J.; JUHAERI, M.; THUN, M. J.; WILLIAMSON, D. F. & WOOD, J. L., 1999. Conse-quence of the use of different measures of effect to determine the impact of age on the association between obesity and mortality. American Journal of Epidemiology, 150:399-407.
SULLIVAN, D. H., 1992. Risk factors for early hospital readmission in a select population of geriatric re-habilitation patients: The significance of nutri-tional status. Journal of the American Geriatric Society, 40:792-798.
TIETZ, N. W.; SHUEY, D. F. & WEKSTEINS, D. R., 1992. Laboratory values in fit aging individual – Sexa-genarians through centenarians. Clinical Chem-istry, 38:1167-1185.
TROIANO, R. P.; FRONGILLO Jr., E. A.; SOBAL, J. & LEVITSKY, D. A., 1996. The relationship between body weight and mortality: A quantitative analy-sis of combined information from existing stud-ies. International Journal of Obesity and Related Metabolic Disorders, 20:63-75.
TRUELSEN, T.; BONITA, R. & JAMROZIK, K., 2001. Surveillance of stroke: A global perspective. Inter-national Journal of Epidemiology, 30:S11-S16. VELLAS, B. J.; HUNT, W. C.; ROMERO, L. J.; KOEHLER,
K. M.; BAUMGARTNER, R. N. & GARRU, P. J., 1997. Changes in nutritional status and patterns of morbidity among free-living elderly persons: A 10-year longitudinal study. Nutrition, 13:515-519. VISSCHER, T. L.; SEIDELL, J. C.; MENOTTI, A.; BLACKBURN, H.; NISSINEN, A. & FESKENS, E. J. & KROMHOUT, D., 2000. Underweight and over-weight in relation to mortality among men aged 40-59 and 50-69 years: The seven countries study.
American Journal of Epidemiology, 151:660-666. WHO (World Health Organization), 1998. Population
Ageing: A Public Health Challenge. Geneva: WHO. ZARGAR, A. H.; MASOODI, S. R.; LAWAY, B. A.; KHAN, A. K.; WANI, A. I.; BASHIR, M. I. & AKHTAR, S., 2000. Prevalence of obesity in adults – An epi-demiological study from Kashmir Valley of Indian Subcontinent. Journal of the Association of Physi-cians of India, 48:1170-1174.
Submitted on June 13 2002