CLINICAL SCIENCE
Noninvasive measurement of cardiac performance in
recovery from exercise in heart failure patients
Jonathan N Myers,IPradeep Gujja,IISuresh Neelagaru,III Leon Hsu,IDaniel BurkhoffIV
IVA Palo Alto Health Care System - Cardiovascular Medicine, California, United States.IITexas Tech University of Health Sciences – Cardiology, Texas, United States.IIILonestar Arrhythmia and Heart Failure Center, Texas, United States.IVColumbia University - Cardiology, New York, United States.
OBJECTIVE: To examine the association between cardiac performance during recovery and the severity of heart failure, as determined by clinical and cardiopulmonary exercise test responses.
METHODS: As part of a retrospective cohort study, 46 heart failure patients and 13 normal subjects underwent cardiopulmonary exercise testing while cardiac output was measured using a noninvasive device. Cardiac output in recovery was expressed as the slope of a single exponential relationship between cardiac output and time; the recovery-time constant was assessed in relation to indices of cardiac function, along with clinical, functional, and cardiopulmonary exercise responses.
RESULTS: The recovery time constant was delayed in patients with heart failure compared with normal subjects (296.7¡238 vs. 110.1¡27 seconds, p,0.01), and the slope of the decline of cardiac output in recovery was steeper in normal subjects compared with heart failure patients (p,0.001). The slope of the decline in cardiac output recovery was inversely related to peak VO2(r = -0.72, p,0.001) and directly related to the VE/VCO2slope (r = 0.57, p,0.001). Heart failure patients with abnormal recovery time constants had lower peak VO2, lower VO2at the ventilatory threshold, lower peak cardiac output, and a heightened VE/VCO2slope during exercise.
CONCLUSIONS: Impaired cardiac output recovery kinetics can identify heart failure patients with more severe disease, lower exercise capacity, and inefficient ventilation. Estimating cardiac output in recovery from exercise may provide added insight into the cardiovascular status of patients with heart failure.
KEYWORDS: Heart failure; cardiac output; oxygen uptake; exercise testing; heart-rate recovery.
Myers JN, Gujja P, Neelagaru S, Hsu L, Burkhoff D. Noninvasive measurement of cardiac performance in recovery from exercise in heart failure patients. Clinics. 2011;66(4):649-656.
Received for publication onDecember 12, 2010;First review completed onJanuary 3, 2011;Accepted for publication onJanuary 27, 2011 E-mail: [email protected]
Tel.: 1 650 493-5000
INTRODUCTION
The symptom-limited cardiopulmonary exercise test has long been an important tool for studying patients with cardiovascular disease. Its applications include classifying disease severity, evaluating the effects of therapy, estimat-ing prognosis, and developestimat-ing safe and effective exercise prescriptions.1,2In recent years, the physiological response torecoveryfrom exercise has been used to provide insight into the pathophysiology of cardiovascular disease. For example, impaired heart rate recovery (HRR) has been used widely over the last decade to describe a delay in vagal reactivation and predict outcomes in patients who are referred for exercise testing for clinical reasons.3-7 The kinetics of ventilatory gas exchange and cardiac perfor-mance during recovery have been of particular interest for patients with chronic heart failure (CHF). Delayed kinetics
of the return of oxygen uptake to baseline levels during recovery from exercise has been related to CHF severity8-12
and have been shown to be an independent prognostic marker.9 Magnetic resonance and near-infrared spectro-scopy studies have shown that the delay in oxygen uptake recovery is attributable to a delay in the recovery of muscle energy stores, skeletal muscle metabolic abnormalities, microcirculatory changes, and prolonged elevations in cardiac output, and these responses appear to be indepen-dent of the exercise level achieved.12,13
The measurement of cardiac performance during recov-ery from exercise could provide added insight into cir-culatory impairment and risk stratification in CHF patients. As with more widely used indices for functionally classify-ing and estimatclassify-ing risk in CHF patients, impaired cardiac function is presumably at the foundation of abnormal recovery responses to exercise, but this issue has not been fully explored. Two studies have observed delayed cardiac output recovery in CHF patients using direct Fick measure-ments, and these studies demonstrated that the degree to which cardiac output is delayed is related to CHF severity.14,15However, direct measurement of cardiac out-put is impractical for routine clinical use because it is Copyrightß2011CLINICS– This is an Open Access article distributed under
invasive and expensive, is associated with additional risk, and is difficult to measure during and after exercise. Noninvasive methods, including CO2rebreathing,
bioimpe-dence, and echocardiography, have been used to measure cardiac output during exercise, but limitations regarding the validity and practicality of these techniques have been widely reported.16-20
If the recovery period is to have a useful clinical application in CHF, as suggested by recent studies, 7-13 noninvasive techniques that provide reasonably accurate and easily obtained measures of cardiac function must be available. One novel, noninvasive approach to quantifying cardiac function during exercise involves the analysis of blood flow-dependent changes in the phase shift of electrical currents applied across the chest.21,22In contrast
to the bioimpedance approach, which relies on the detection of flow-dependent changes in electrical signal amplitude, phase shift detection may be more precise and less subject to noise. The purpose of the current study was to use this noninvasive approach to examine the association between cardiac performance during recovery and CHF severity, as determined by clinical and cardiopulmonary exercise test responses.
METHODS
Subjects: This was a retrospective cohort study of clinical data obtained from 59 consecutive subjects who were referred to a private cardiology clinic for cardiopulmonary exercise testing to evaluate dyspnea. The study was approved by the Texas Tech University of Health Sciences Committee on the Protection of Human Subjects, and all patients consented to the use of their data in the analysis. Forty-six subjects had heart failure (28 with EF
,40%, 18 with normal EF determined by echocardiogra-phy), and 13 were ultimately diagnosed as normal (normal EF and peak VO2, with dyspnea based on noncardiac
factors). The normal subjects were not matched with CHF patients by demographic factors but were used as a
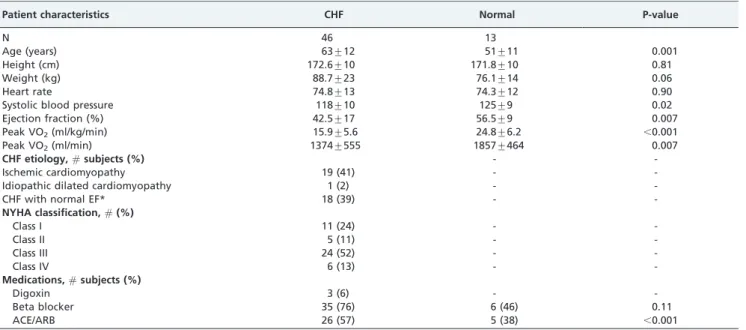
convenience group for comparison. The demographic and clinical characteristics of the subjects are summarized in Table 1. All subjects were limited by fatigue or dyspnea during exercise, and none showed clinical evidence of pulmonary disease or ischemic changes on ECG.
Exercise Testing. Symptom-limited maximal exercise tests were performed on a treadmill using a ramp protocol.23 The rate of change in speed and grade was individualized so that the test was targeted to last the recommended 8-12 minutes.2The peak speed was 3.0 mph for all subjects.
All subjects were asked to abstain from eating or smoking at least 3 hours prior to the test. Ventilatory oxygen uptake was measured using a Medical Graphics Corporation metabolic system (CPX-D, St. Paul, MN). Oxygen uptake and other gas exchange data were acquired breath-by-breath, reported as 30-second averages, and expressed as liters/min. Oxygen uptake, carbon dioxide production, minute ventilation, and respiratory exchange ratios were calculated online. A 12-lead electrocardiogram was monitored continuously and recorded every minute. Blood pressure was recorded manually every two minutes throughout the test. All subjects were encouraged to exert maximal effort; among patients with CHF, the Borg 0-to-10 perceived exertion scale was used to quantify effort.24
The ventilatory threshold was determined by two experienced, independent reviewers using the V-slope method25 and was confirmed by ventilatory criteria. VE and VCO2responses, acquired from the initiation of exercise
to peak exercise, were used to calculate the VE/VCO2slope
via least-squares linear regression (y = mx + b,
m = slope).26,27The oxygen uptake efficiency slope (OUES) was derived by the slope of a semi-log plot of minute ventilation versus VO2. As such, the OUES estimates the
efficiency of ventilation with respect to VO2, with greater
slopes indicating greater ventilatory efficiency.26,27
Cardiac Output. Cardiac output was estimated at rest, continuously throughout exercise, and for at least 6 minutes during the recovery period. Four dual electrodes were used to obtain cardiac output and other hemodynamic data. The
Table 1 -Demographic and Clinical Characteristics.
Patient characteristics CHF Normal P-value
N 46 13
Age (years) 63¡12 51¡11 0.001
Height (cm) 172.6¡10 171.8¡10 0.81
Weight (kg) 88.7¡23 76.1¡14 0.06
Heart rate 74.8¡13 74.3¡12 0.90
Systolic blood pressure 118¡10 125¡9 0.02
Ejection fraction (%) 42.5¡17 56.5¡9 0.007
Peak VO2(ml/kg/min) 15.9¡5.6 24.8¡6.2 ,0.001
Peak VO2(ml/min) 1374¡555 1857¡464 0.007
CHF etiology,#subjects (%) -
-Ischemic cardiomyopathy 19 (41) -
-Idiopathic dilated cardiomyopathy 1 (2) -
-CHF with normal EF* 18 (39) -
-NYHA classification,#(%)
Class I 11 (24) -
-Class II 5 (11) -
-Class III 24 (52) -
-Class IV 6 (13) -
-Medications,#subjects (%)
Digoxin 3 (6) -
-Beta blocker 35 (76) 6 (46) 0.11
ACE/ARB 26 (57) 5 (38) ,0.001
CHF = chronic heart failure; NYHA = New York Heart Association; ACE/ARB = ACE inhibitor/angiotensin receptor blocker; *.45%. cardiac function in recovery in CHF patients
Myers JN et al. CLINICS 2011;66(4):649-656
NICOMHbioreactance-based system (Cheetah Medical Inc., Indianapolis, IN) is based on an analysis of the relative phase shifts that occur when oscillating currents tra-verse the thoracic cavity. These phase shifts contrast with traditional bioimpedance-based systems, which rely on measured changes in signal amplitude. The NICOM system consists of a radiofrequency generator for creating a high-frequency current that is injected across the thorax; 4 dual-surface electrodes, used to establish electrical contact with the body; a receiving amplifier for recording transthoracic voltage in response to injected current; and circuitry for determining the relative phase shift between the injected current and the recorded voltage. Within each dual electrode, one electrode was used by the high-frequency current generator, and the other was used by the input voltage amplifier. Signals were applied to and recorded from the left and right sides of the thorax; these signals were processed separately and averaged after digital processing.
The signal-processing unit of the system determined the relative phase shift (DW) between the input and output signals.DW, in turn, reflected changes in blood flow in the aorta. Stroke volume (SV) was estimated with the formula
SV~C:VET:dW=dtmax,
where C is a constant of proportionality, and VET is ventricular ejection time, which was determined from the NICOM and ECG signals. The value of C has been optimized in prior studies and accounts for patient age, gender, and body size.28Age, gender, weight and height are mandatory inputs that are required before the device begins monitoring. The constant (C) is modified according to these specific data for each patient. The constant is derived from a thorough statistical analysis based on a multivariate regres-sion between NICOM-derived parameters and cardiac output as measured by thermodilution. These analyses have shown that the constant is not affected significantly by factors other than those listed above, so it remains constant as calculated for each patient.
Cardiac output (CO) was calculated using the formula
CO~SV:HR,
where HR is heart rate.
NICOM measurements were obtained every minute during exercise and for 6 minutes into recovery. The time constant of cardiac output decay in recovery was deter-mined for the monoexponential relationship between cardiac output and time during the first 5 minutes of recovery using the following formula:
Y~y0zAeð{x=tÞ,
where y is cardiac output,y0is cardiac output at time zero (beginning of the recovery phase),Aandeare constants,xis the time elapsed, andt is the time constant of decay. This time constant reflects the time required to achieve 63.2% of the difference between starting and baseline values. The recovery slope represents the slope of the linear relationship between CO and VO2 during recovery, and R2 represents
the square of the linear fit of these two variables in recovery. Heart rate and stroke volume in recovery were defined as
the difference between peak values and those measured at 2 minutes postexercise.
Statistical Analysis. For descriptive statistics, compari-sons between normal subjects and CHF patients were performed using unpaired t-tests. Response differences between normal subjects and CHF patients with normal and abnormal cardiac output in recovery (defined as above or below the median time constant in recovery of 205 seconds) were assessed using one-way ANOVA. Post-hoc tests were performed using the Bonferroni method. The associations between noninvasive cardiac output data, clinical variables, and other exercise test responses were assessed using linear regression.
RESULTS
The square of the linear fit (R2) and the slope of the
decline in cardiac output during recovery were lower in CHF patients compared with normal subjects (R2= 0.97¡1.6 vs. 0.88¡0.15, p = 0.04, and recovery slope = -13.7¡3.0 vs. -6.8¡3.2, p,0.001). The recovery time constant was nearly threefold higher in CHF patients compared with normal subjects (110.1¡27 vs. 296.7¡328 seconds, p = 0.01).
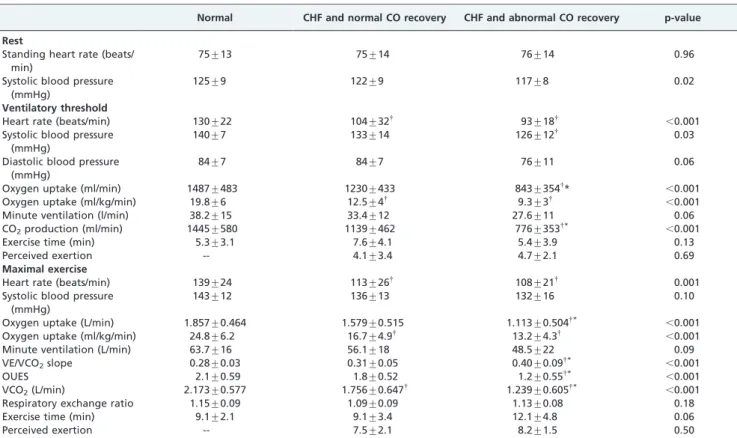
Exercise test responses among normal subjects, CHF patients with a normal cardiac output recovery response, and CHF patients with an impaired cardiac output recovery response are summarized in Table 2. Overall, the mean maximal perceived exertion was 7.8¡1.7, and the mean peak respiratory exchange ratio was 1.12¡0.09, suggesting that maximal effort was exerted by most patients. Normal subjects generally achieved higher exercise test responses than CHF patients, and CHF patients with abnormal recovery responses had reduced exercise responses com-pared to those with normal recovery cardiac output. The mean peak VO2 values for normal subjects and CHF
patients normal and abnormal recovery responses were 24.8¡4, 16.7¡4, and 13.2¡3 ml/kg/min, respectively (p,0.001). Similarly, oxygen uptake at the ventilatory threshold was highest among normal subjects and lowest among CHF patients with impaired cardiac output responses in recovery. The VE/VCO2 slope was similar
between normal subjects and CHF patients with a normal cardiac output time constant in recovery (0.28¡0.03 and 0.31¡0.05 respectively, NS), but the VE/VCO2 slope was heightened among CHF patients with delayed cardiac output responses during recovery (0.40¡0.09, p,0.05 vs. the other 2 groups). Similarly, the OUES was not different between normal subjects (2.1¡0.59) and CHF patients with normal cardiac output in recovery (1.8¡0.52) but was reduced in CHF patients with abnormal cardiac output in recovery (1.2¡0.55, p,0.05 vs. the other 2 groups).
patients with normal cardiac output responses in recovery than in CHF patients with impaired cardiac output in recovery (47¡18, 31¡18, and 17¡6 beats in normal subjects and CHF patients with normal and abnormal cardiac output responses in recovery, respectively, p,0.001). The decline in stroke volume at 2 minutes in recovery was similar between
normal subjects and CHF patients with normal recovery cardiac output (72.7¡43 and 71.8¡53 ml, respectively) but tended to be lower in CHF patients with abnormal cardiac output in recovery (51.8¡34 ml). This difference repre-sented cardiac output decreases of 48%, 43%, and 35% among normal subjects and CHF patients with normal and Table 2 -Exercise test responses in normal subjects and CHF patients with normal and abnormal cardiac output in recovery (mean¡SD).
Normal CHF and normal CO recovery CHF and abnormal CO recovery p-value
Rest
Standing heart rate (beats/ min)
75¡13 75¡14 76¡14 0.96
Systolic blood pressure (mmHg)
125¡9 122¡9 117¡8 0.02
Ventilatory threshold
Heart rate (beats/min) 130¡22 104¡32{
93¡18{
,0.001 Systolic blood pressure
(mmHg)
140¡7 133¡14 126¡12{
0.03
Diastolic blood pressure (mmHg)
84¡7 84¡7 76¡11 0.06
Oxygen uptake (ml/min) 1487¡483 1230¡433 843¡354{
* ,0.001
Oxygen uptake (ml/kg/min) 19.8¡6 12.5¡4{ 9.3
¡3{
,0.001
Minute ventilation (l/min) 38.2¡15 33.4¡12 27.6¡11 0.06
CO2production (ml/min) 1445¡580 1139¡462 776¡353{* ,0.001
Exercise time (min) 5.3¡3.1 7.6¡4.1 5.4¡3.9 0.13
Perceived exertion -- 4.1¡3.4 4.7¡2.1 0.69
Maximal exercise
Heart rate (beats/min) 139¡24 113¡26{
108¡21{
0.001 Systolic blood pressure
(mmHg)
143¡12 136¡13 132¡16 0.10
Oxygen uptake (L/min) 1.857¡0.464 1.579¡0.515 1.113¡0.504{*
,0.001
Oxygen uptake (ml/kg/min) 24.8¡6.2 16.7¡4.9{
13.2¡4.3{
,0.001
Minute ventilation (L/min) 63.7¡16 56.1¡18 48.5¡22 0.09
VE/VCO2slope 0.28¡0.03 0.31¡0.05 0.40¡0.09{* ,0.001
OUES 2.1¡0.59 1.8¡0.52 1.2¡0.55{*
,0.001
VCO2(L/min) 2.173¡0.577 1.756¡0.647{ 1.239¡0.605{* ,0.001
Respiratory exchange ratio 1.15¡0.09 1.09¡0.09 1.13¡0.08 0.18
Exercise time (min) 9.1¡2.1 9.1¡3.4 12.1¡4.8 0.06
Perceived exertion -- 7.5¡2.1 8.2¡1.5 0.50
p-value represents ANOVA main effect between groups. *p,0.05 vs. CHF and normal recovery.
{
p,0.05 vs. normal subjects. CO = cardiac output.
OUES = oxygen uptake efficiency slope. VCO2= carbon dioxide production.
Table 3 -Noninvasive cardiac output data at rest and during exercise.
Rest Normal CHF and normal CO recovery
CHF and abnormal CO
recovery p-value
Cardiac output (L/min) 5.45¡1.7 4.90¡1.3 5.16¡1.6 0.55
Cardiac index (L/min/M2) 2.89¡0.78 2.36¡0.60 2.64¡0.86 0.14
Dx/dt (ohme/sec) 171.3¡107 100.1¡63 171.2¡137 0.06
VET (msec) 174.3¡36 163.1¡23 160.4¡15 0.27
Ejection fraction (%) 56.5¡9 40.5¡14{ 41.0
¡19{ 0.01 Peak exercise
Cardiac output (L/min) 20.0¡10.0 19.2¡6.6 13.5¡5.4{* 0.02
Cardiac index ((L/min/M2) 10.6¡4.7 9.3¡3.2 6.7¡2.3{
0.006
Dx/dt (ohme/sec) 557.8¡239 415.7¡214 341.4¡114{
0.009
VET (msec) 143.6¡17 142.3¡12 152.3¡20 0.13
p-value represents ANOVA main effect between groups. *p,0.05 vs. CHF and normal recovery.
{p
,0.05 vs. normal subjects. Dx/dt = peak aortic flow. VET = ventricular ejection time.
cardiac function in recovery in CHF patients
Myers JN et al. CLINICS 2011;66(4):649-656
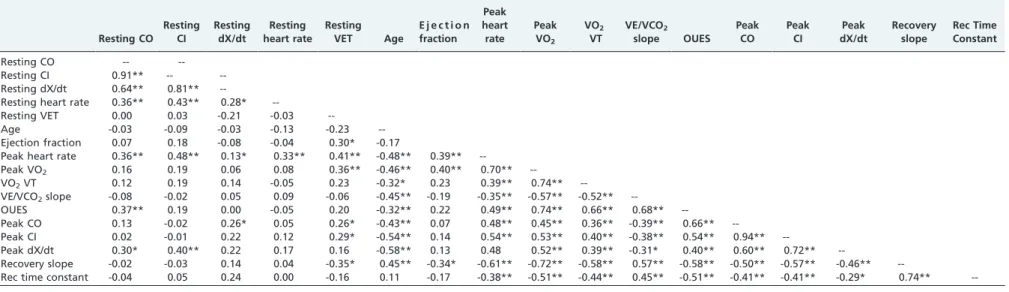
Table 4 -Correlation coefficients between clinical and exercise data and cardiac output responses during exercise and recovery.
Resting CO Resting
CI
Resting dX/dt
Resting heart rate
Resting
VET Age
E j e c t i o n fraction
Peak heart rate
Peak VO2
VO2
VT
VE/VCO2
slope OUES Peak
CO
Peak CI
Peak dX/dt
Recovery slope
Rec Time Constant
Resting CO -- --Resting CI 0.91** -- --Resting dX/dt 0.64** 0.81**
--Resting heart rate 0.36** 0.43** 0.28*
--Resting VET 0.00 0.03 -0.21 -0.03
--Age -0.03 -0.09 -0.03 -0.13 -0.23 --Ejection fraction 0.07 0.18 -0.08 -0.04 0.30* -0.17
Peak heart rate 0.36** 0.48** 0.13* 0.33** 0.41** -0.48** 0.39**
--Peak VO2 0.16 0.19 0.06 0.08 0.36** -0.46** 0.40** 0.70**
--VO2VT 0.12 0.19 0.14 -0.05 0.23 -0.32* 0.23 0.39** 0.74**
--VE/VCO2slope -0.08 -0.02 0.05 0.09 -0.06 -0.45** -0.19 -0.35** -0.57** -0.52**
--OUES 0.37** 0.19 0.00 -0.05 0.20 -0.32** 0.22 0.49** 0.74** 0.66** 0.68**
--Peak CO 0.13 -0.02 0.26* 0.05 0.26* -0.43** 0.07 0.48** 0.45** 0.36** -0.39** 0.66**
--Peak CI 0.02 -0.01 0.22 0.12 0.29* -0.54** 0.14 0.54** 0.53** 0.40** -0.38** 0.54** 0.94**
--Peak dX/dt 0.30* 0.40** 0.22 0.17 0.16 -0.58** 0.13 0.48 0.52** 0.39** -0.31* 0.40** 0.60** 0.72**
--Recovery slope -0.02 -0.03 0.14 0.04 -0.35* 0.45** -0.34* -0.61** -0.72** -0.58** 0.57** -0.58** -0.50** -0.57** -0.46**
--Rec time constant -0.04 0.05 0.24 0.00 -0.16 0.11 -0.17 -0.38** -0.51** -0.44** 0.45** -0.51** -0.41** -0.41** -0.29* 0.74**
--p,0.05. **p,0.01.
CO = cardiac output, ml/kg/min; CI = cardiac index, L/min/m2; dX/dt = peak aortic flow; BP = blood pressure, mmHg; VET = ventricular ejection time, msec.
VO2VT = oxygen uptake at the ventilatory threshold, ml/kg/min; OUES = oxygen uptake efficiency slope; Rec = recovery.
2011;66(4):
649-656
cardiac
functio
n
in
recovery
in
CHF
patients
Myers
JN
et
al.
abnormal cardiac output responses in recovery, respec-tively.
Similar results were observed when ventilatory and cardiac function responses during exercise and recovery were compared between patients with normal and reduced ejection fraction ($40 or,40%).
Table 4 presents correlation coefficients between cardiac performance measurements during exercise and recovery and key clinical and exercise test responses for the total study sample combined. Resting indices of cardiac function were poorly related to the cardiac output recovery slope and time constant, but significant associations were observed between cardiac output in recovery and peak VO2, maximal
cardiac output and index, and maximal dX/dt. The associations between peak VO2, peak cardiac output, and
cardiac output recovery slope for normal and CHF subjects are illustrated in Figure 1, and the associations between the VE/VCO2slope, OUES, and cardiac output recovery slope
for all subjects are illustrated in Figure 2. The cardiac output recovery slope was inversely associated with peak VO2(r =
-0.72) and maximal cardiac output (r = -0.50, p,0.01). The cardiac output recovery slope was significantly related to the VE/VCO2slope (r = 0.57, p,0.01) and inversely related
to the OUES (r = -0.58, p,0.01).
DISCUSSION
A great deal of interest has been generated in recent years regarding recovery from exercise in CHF patients.7-15These studies have focused on delays in heart-rate recovery,7 delayed oxygen kinetics,8-13and accumulated oxygen ‘‘debt’’ in recovery.29 It has been consistently demonstrated that impaired responses in recovery from exercise are associated with more severe heart failure and a worse prognosis.7-15A number of factors that may contribute to abnormalities in recovery from exercise in CHF patients have been suggested, including a vagal reactivation delay, skeletal muscle meta-bolic abnormalities, microcirculatory changes, and sustained hyperpnea.7-15 Impairments in ability of cardiac output to return to normal during recovery from exercise have also been reported among CHF patients using direct Fick measurements. Tanabe et al.14observed an ‘‘overshoot’’ of cardiac output in recovery from exercise in a subgroup of CHF patients with impaired cardiac output responses to exercise and more severe CHF. Other investigators have reported that abnormal oxygen kinetics in recovery (i.e., delayed time constant or half-time of VO2) among CHF
patients parallel a delay in recovery of cardiac output. Reddy and colleagues,30 using a submaximal isometric protocol, reported that while cardiac output returned to baseline 90
Figure 1 -The relationships between peak VO2, peak cardiac index, and cardiac output slope in recovery. cardiac function in recovery in CHF patients
Myers JN et al. CLINICS 2011;66(4):649-656
seconds after exercise in normal subjects, cardiac output remained elevated for a prolonged period after exercise in patients with the most severe CHF. Similarly, Sumimoto et al.,15using a supine cycle ergometer protocol, reported that
the decline in cardiac output 5 minutes postexercise was significantly elevated in patients with the most severe CHF. These studies suggest that the measurement of cardiac output in recovery may provide additional insight into the circulatory, metabolic, and autonomic abnormalities that characterize CHF and could have potential applications for the functional and prognostic assessment of these patients. However, the use of invasive measurements to quantify cardiac function in recovery is impractical for routine clinical purposes. We therefore employed a novel, noninvasive approach involving the analysis of blood flow-dependent changes in the phase shift of electrical currents applied across the chest. This approach differs from the bioimpedance approach, which relies on detecting flow-dependent changes in electrical signal amplitude that are inherently more difficult to detect and more subject to noise disturbances. Accordingly, this approach (calledbioreactance) has an improved signal-to-noise ratio and is less susceptible to physical factors such as body habitus, body motion and ambient conditions. In both
preclinical and clinical settings, this method was demon-strated to provide cardiac output values that were highly correlated with thermodilution methods 21, and it has been
demonstrated to be valid in CHF patients undergoing maximal exercise testing.22 To our knowledge, noninvasive
techniques have not previously been used to study CHF patients’ recovery from exercise. Our objectives were to determine the feasibility of using this technique in recovery and to characterize the association between cardiac output in recovery and CHF severity as assessed by clinical and cardiopulmonary exercise test variables.
CURRENT FINDINGS
The observation that the degree of cardiac output impair-ment during recovery was related to CHF severity provides support for both the application of a noninvasive device and the clinical relevance of the recovery period among CHF patients. Our salient finding was that impaired cardiac output kinetics in recovery identify CHF patients with more severe disease, lower exercise capacity, reduced cardiac function at peak exercise, and inefficient ventilation. This finding was evidenced by a 30% lower maximal cardiac output in patients
who demonstrated delayed cardiac output recovery kinetics; conversely, CHF patients with a normal recovery response had a mean maximal cardiac output that was similar to that of normal subjects (Table 3). The cardiac output delay in recovery appeared to be attributable to delays in both heart rate and stroke volume. In addition, patients with an abnormal recovery response demonstrated heightened and inefficient ventilation, as evidenced by a mean VE/VCO2
slope of 0.40¡0.05, an OUES of 1.2¡0.52 (values above and below conventional high-risk thresholds, respectively),27and
the significant relationship between VE/VCO2slope, OUES
and the recovery time constant (Figure 2). The latter indices have been widely used in recent years as markers of ventilatory inefficiency and are strongly related to outcomes in CHF.26,27 A heightened VE/VCO2 slope and reduced
OUES reflect the degree of ventilation/perfusion mismatch in the lungs, early lactate accumulation, and abnormal ventila-tory control, which are hallmarks of more severe CHF.26,27
Limitations. We were only able to quantify the general pattern of cardiac output in recovery; instantaneous responses upon exercise cessation, recovery overshoot, 15
the duration of the impaired response in recovery and other patterns require further study. Because there are few previous studies in this area, the classification of abnormal cardiac function in recovery was empirical; there may be other methods with which to express this response. We did not have direct measures of cardiac function during recovery with which to compare the results from the noninvasive device. The effects of beta blockers and other drugs, age, and CHF etiology are all likely to influence the recovery response; however, because our study was retrospective, we were not able to gain insight into the effects of these factors. Finally, we used a convenience sample of subjects without CHF as a comparison group; the normal cardiac output response in recovery from exercise has not been previously established.
Summary. Impaired cardiac output kinetics in recovery from exercise identify CHF patients with more severe disease, lower exercise capacity, and inefficient ventilation, providing added insight into these patients’ cardiovascular status. The noninvasive measurement of cardiac performance in recovery from exercise has potentially important applications for the functional and prognostic assessment of patients with CHF.
REFERENCES
1. Froelicher VF, Myers J. Exercise and the Heart, 5th ed. Philadelphia: W.B. Saunders, 2006.
2. Gibbons RJ, Balady GJ, Bricker JT, Chaitman BR, Fletcher GF, Froelicher VF, et al. ACC/AHA 2002 guideline update for exercise testing: summary article: a report of the American College of Cardiology/ American Heart Association Task Force on Practice Guidelines (Committee to Update the 1997 Exercise Testing Guidelines). Circulation. 2002;106:1883-92, doi: 10.1161/01.CIR.0000034670.06526.15. 3. Jouven X, Empana JP, Schwartz PJ, Desnos M, Courbon D, Ducimetie`re P.
Heart-rate profile during exercise as a predictor of sudden death. N Engl J Med. 2005;352:1951-1958.
4. Myers J, Tan SY, Abella J, Aleti V, Froelicher VF. Comparison of the chronotropic response to exercise and heart rate recovery in predicting cardiovascular mortality. Eur J Cardiovasc Prev Rehabil. 2007;14:215-21, doi: 10.1097/HJR.0b013e328088cb92.
5. Shetler K, Marcus R, Froelicher VF, Vora S, Kalisetti D, Prakash M, et al. Heart rate recovery: Validation and methodological issues. J Am Coll Cardiol. 2001;38:1980-7, doi: 10.1016/S0735-1097(01)01652-7.
6. Cole CR, Blackstone EH, Pashkow FJ, Snader CE, Lauer MS. Heart-rate recovery immediately after exercise as a predictor of mortality. N Engl J Med. 1999;341:1351-7.
7. Arena R, Guazzi M, Myers J, Peberdy MA. Prognostic value of heart rate recovery in patients with heart failure. Am Heart J. 2006;151:851:e7-e13. 8. Pavia L, Myers J. Cesare R. Recovery kinetics of oxygen uptake and heart rate in patients with coronary artery disease and heart failure. Chest. 1999;116:808-13, doi: 10.1378/chest.116.3.808.
9. De Groote P, Millaire A, Decoulx E, Nugue O, Guimier P, Ducloux G. Kinetics of oxygen consumption during and after exercise in patients with dilated cardiomyopathy. J Am Coll Cardiol. 1996;28:168-75, doi: 10. 1016/0735-1097(96)00126-X.
10. Myers J, Gianrossi R, Schwitter J, Wagner D, Dubach P. Effect of exercise training on postexercise oxygen uptake kinetics in patients with reduced ventricular function. Chest. 2001;120:1206-11, doi: 10.1378/chest.120.4. 1206.
11. Sietsema K, Ben-Dov I, Zhang Y, Sullivan C, Wasserman K. Dynamics of oxygen uptake for submaximal exercise and recovery in patients with chronic heart failure. Chest. 1994;105:1693-700, doi: 10.1378/chest.105.6. 1693.
12. Cohen-Solal A, Laperche T, Morvan D, Geneves M, Caviezel B, Gourgon R. Prolonged kinetics of recovery of oxygen consumption after maximal graded exercise in patients with chronic heart failure. Circulation. 1995;91:2924-32.
13. Belardinelli R, Barstow TJ, Nguyen P, Wasserman K. Skeletal muscle oxygenation and oxygen uptake kinetics following constant work rate exercise in chronic congestive heart failure. Am J Cardiol. 1997;80: 1319-24.
14. Tanabe Y, Takahashi M, Hosaka Y, Ito M, Ito E, Suzuki K. Prolonged recovery of cardiac output after maximal exercise in patients with chronic heart failure. J Am Coll Cardiol. 2000;35:1228-36, doi: 10.1016/ S0735-1097(00)00517-9.
15. Sumimoto T, Sugiura T, Takeuchi M, Yuasa F, Iwasaka T, Inada M. Overshoot in mixed venous oxygen saturation during recovery from supine bicycle exercise in patients with recent myocardial infarction. Chest. 1993;103:514-20, doi: 10.1378/chest.103.2.514.
16. Leslien S, McKee S, Newby D, Webb D, Denvir M. Non-invasive measurement of cardiac output in patients with chronic heart failure. Blood Press Monit. 2004;9:277-80, doi: 10.1097/00126097-200410000-00008.
17. Engoren M, Barbee D. Comparison of cardiac output determined by bioimpedance, thermodilution, and the Fick method. Am J Crit Care. 2005;14:40-5.
18. Newman DG, Callister R. The non-invasive assessment of stroke volume and cardiac output by impedance cardiography: a review. Aviat Space Environ Med. 1999;70:780-9.
19. Thomas JD, Popovic ZB. Assessment of left ventricular function by cardiac ultrasound. J Am Coll Cardiol. 2006;48:2012-25, doi: 10.1016/j. jacc.2006.06.071.
20. Myers J. Essentials of Cardiopulmonary Exercise Testing. Champaign, IL: Human Kinetics, 1996.
21. Keren H, Burkhoff D, Squara P. Evaluation of a non-invasive cardiac output monitoring system based on thoracic bioreactance. Am J Physiol Heart Circ Physiol 2007;293:H583-9, doi: 10.1152/ajpheart.00195.2007. 22. Myers J, Gupta P, Neelagaru S, Burkhoff D. Cardiac output and
cardiopulmonary responses to exercise in heart failure: Application of a new bio-reactance device. J Cardiac Failure. 2007;13:629-36, doi: 10. 1016/j.cardfail.2007.05.009.
23. Myers J, Buchanan N, Walsh D, Kraemer M, McAuley P, Hamilton-Wessler M, et al. Comparison of the ramp versus standard exercise protocols. J Am Coll Cardiol. 1991;17:1334-42, doi: 10.1016/S0735-1097(10)80144-5.
24. Borg GAV. Borg’s perceived exertion scales. Champaign: Human Kinetics, 1998.
25. Beaver WL, Wasserman K, Whipp BJ. A new method for detecting the anaerobic threshold by gas exchange. J Appl Physiol. 1986;60:2020-7. 26. Myers J. Applications of cardiopulmonary exercise testing in the
management of cardiovascular and pulmonary disease. Int J Sports Med. 2005;26:490-555.
27. Arena R, Guazai M, Myers J. Ventilatory abnormalities during exercise in heart failure: A mini review. Current Resp Med Reviews. 2007;3:179-87. 28. Squara P, Estagnaie p, Denjean D, Brusset A, Dib J, Dubois C. NICOM (Non Invasive Cardiac Output Monitoring) clinical evaluation. Proc Am Thorac Soc. 2006;3:A295.
29. Mezzani A, Corra U, Sassi B, Colombo R, Giordano A, Giannuzzi P. Maximal accumulated oxygen deficit in patients with chronic heart failure. Med Sci Sports Exerc. 2006; 38:424-32, doi: 10.1249/01.mss. 0000191432.87926.41.
30. Reddy HK, Weber KT, Janicki JS, McElroy PA. Hemodynamic, ventilatory and metabolic effects of light isometric exercise in patients with chronic heart failure. J Am Coll Cardiol. 1988;12:353-8, doi: 10.1016/ 0735-1097(88)90405-6.
cardiac function in recovery in CHF patients
Myers JN et al. CLINICS 2011;66(4):649-656