*e-mail: [email protected]
Selection Criteria for Recycled Polyolefins from
Urban Wastes by Using TG Analysis
Adhemar Ruvolo-Filho*, José Manoel Marconcini
Departamento de Química, Centro de Ciências Exatas e de Tecnologia,
Universidade Federal de São Carlos – UFSCar,
CP 676, Bairro Monjolinho, 13565-905 São Carlos - SP, Brazil
Received: February 7, 2007; Revised: October 9, 2007
The thermal behavior of a mixture of recycled polyolefins (PE/PP mix), variously colored recycled polyolefins, recycled polyolefin blends and recycled polyolefin/PET blends was analyzed by thermogravimetry. Atmospheres of nitrogen and synthetic air were used to compare the effects of inert and oxidative medium. Four characteristic temperatures, T1, T2, T3 and T4, related to oxidative processes and atmospheric conditions, were defined. Relationships between T1, T2, T3 and T4 and comparing pigmented and transparent material allow assessing the effect of different pigments on volatilization, oxidation and onset temperatures of decomposition processes. These analyses provide preliminary parameters for selecting acceptable processing temperature conditions of recycled household and engineering plastics, and provide a few criteria to select colored recycled polyolefins.
Keywords: thermogravimetry, recycling of polyolefins, pigments, onset temperatures of decomposition process
1. Introduction
Polyolefins and polyesters are two of the most widely consumed classes of plastics available in large amounts from post-consumer wastes. Polyolefins, such as high-density polyethylene (HDPE), low-density polyethylene (LDPE) and polypropylene (PP) are mainly used in pipes, films, blown bottles, and other packaging. Polyesters, such as poly (ethylene terephthalate) (PET) are widely used in carbonated soft drink bottles, textile fibers and films1-3.
These plastics are usually recycled by one of the following proc-esses3: chemical recycling, such as PET depolymerization to produce
oligomers and/or monomers, or controlled polyolefin pyrolysis for fuel production; energy recycling, as in the burning of a polymer to utilize its heat content; or mechanical recycling, where a series of processing operations are carried out on plastics to produce secondary materials used to manufacture several types of articles, in which the original polymer structure is preserved.
A useful option in mechanical recycling is the blending of both recycled polyolefins and PET to produce a multi-phase polymer system with an acceptable balance of processability and good me-chanical properties2,3.
High temperatures, mechanical stresses and the presence of oxy-gen may cause polymer degradation. Thermo-oxidative degradation involves formation of alkyl radicals that combine with oxygen to produce hydroperoxides, alkoxy and peroxy radicals. Recombination of these radicals produces volatile organic compounds (VOCs) such as hydrocarbons, alcohols, aldehydes, ketones, and carboxylic acids4.
Thermal oxidation of polyolefin melts exposed to air results in changes in the infrared spectrum of these polymers. The products formed on thermolysis of PE hydroperoxides in a press are roughly the same as those formed during processing in open mixers. At 150 and 180 °C5, carbonyl and alcohol groups are the main products formed
during thermolysis. Although the data were generated in the tempera-ture range of 150 to 200 °C, the mechanism is assumed to hold up to 300 °C6. The decrease in hydroperoxide concentration becomes faster
with increasing temperature, i.e., higher temperatures accelerate the polymer decomposition process5,6. Another important fact is that the
oxidation products formed in the presence of phenolic antioxidants are almost the same as those formed in the absence of phenols. However, in the presence of phenolic antioxidants7 the proportion of carbonyls
increased, whereas that of alcohol groups decreased.
Pigments affect thermal properties of polymers by promoting catalysis of oxidative reactions8,9. A series of polyethylenes (LDPE,
LLDPE, HDPE, UHMWPE) was studied by chemiluminescence to assess the effects of seven metal (Al, Zn, Ti, Mo, Mn, Fe and Cu) in the presence of triazine stabilizers on polymer thermal degrada-tion9. The effects of the metals were seen to be different for each
polymer. For example, for LDPE the order of catalytic activity for oxidative degradation was found to be Cu > Fe > Mo > Ti > Zn > Pb >> Al, whereas for HDPE the order was Cu > Fe > Zn > Pb > Mo > Ti >> Al9.
Recycled polymers from urban wastes are a complex matrix of components that have passed through at least one life cycle, with a processing history different from that of virgin polymers. To blend polyolefins and PET, the processing temperature must be higher than the melt temperature of PET (~255 °C, for virgin material). However, this temperature should be sufficiently low to avoid either thermo-oxidative reactions or intensive volatilization which would lead to significant mass loss of the blend10.
In this context, variation of mass loss with the temperature of recycled polymers plays an important role in determining process-ing temperature and may help to establish criteria to select recycled materials from urban wastes.
The aim of this study is to test a technique that enables the effects of different pigments on volatilization, oxidation and decomposition onset temperatures to be assessed within an acceptable range of plastic processing temperatures (from ambient temperature to 300 °C), and if possible to provide a number of criteria for selecting recyclable colored polyolefins.
thermogravimetry. Nitrogen and synthetic air were used to compare the effects of inert and oxidative atmosphere, respectively.
2. Experimental
2.1. Materials
The following materials were used in this investigation: recycled post consumer mixed polyolefin bottles (polyethylene (PE), melting temperature, Tm = 129.51 °C; and polypropylene (PP), Tm= 159.77 °C) and poly (ethylene terephthalate) (PET), Tm = 247.87 °C, soft drink bottles collected from urban solid waste; compatibilizer polypropylene grafted with maleic anhydride (MA) (PP-g-MA) (0.15% graft, Polybond 3002, Crompton); impact modifier poly ( ethylene-co-octene-1) (Engage 8100, Dupont Dow Elastomers); antioxidants Irganox 1010 (Ciba) and Irgafos 168 (Ciba); and light stabilizer Tinuvin 783 FDL (Ciba).
2.2. Sample preparation
Recycled plastics were ground and washed with detergent and wa-ter. PET was dried at 140 °C and polyolefins at 90 °C for 8 hours.
Polyolefin mixture (PE/PP mix) from soid waste was separated into portions by color and the percent mass of each fraction is shown in Table 1. Minor components (3.7% of the mix including films and fibers of polyolefins) were not analyzed. Separated colored polyolefins and blends were milled in a manual mill. PE/PP mix and PET were milled in a cryogenic mill (CF Bantam, Micro Powder Systems).
2.3. Thermogravimetric measurements
Thermogravimetric analyses of each colored recycled polyolefin, PE/PP mix and blends were carried out in a TGA 2050 thermobalance from TA Instruments, Inc. The heating rate was set at 10 °C/min and between 5 and 13 mg of powdered sample was heated on a Pt pan from ambient temperature to 700 °C. The temperature range chosen for detailed discussions of the results was ambient to 300 °C, com-monly used to process these blends.
Analyses in nitrogen atmosphere (N2) were carried out with a furnace gas flow of 90 cm3/min and balance gas flow of 10 cm3/min.
Analyses in synthetic air (Air) were carried out with a furnace gas flow of 50 cm3/min and balance nitrogen gas flow of 10 cm3/min.
2.4. Blend preparation
Polymers were blended in nitrogen atmosphere for 2.5 minutes, in a HAAKE Rheomix 600p torque rheometer. Total polymer mass was
40.0 g, mix chamber volume was 69 cm3 and constant wall chamber
temperature 260 °C. Roller type rotors with angular velocity of 40 rpm were used for the mixing.
Blend code names and respective compositions are listed below: Blend 1: 100% PE/PP mix;
Blend 2: 85% PE/PP mix + 10% Engage 8100 + 5% PP-g-MA; Blend 3: 50% PE/PP mix + 35% PET + 10% Engage 8100 +
5% PP-g-MA.
In all blend compositions 0.05 phr Irganox 1010, 0.10 phr Irgafos 168 and 0.6 phr Tinuvin 783 FDL were used.
These blends were used as reference, since in a previous study [ xx], it was demonstrated that PE/PP mix can be blended with PET by using g-MA as compatibilizer. Blend 2 and 3, containing PP-g-MA and Engage 8100, showed improvements in the mechanical properties. The antioxidants were used to prevent any undesirable thermo-oxidative process during the blending process and they may hinder comparison with the samples without additives.
3. Results and Discussion
Typical thermogravimetric curves for a recycled polyolefin measured in synthetic air and nitrogen atmosphere are shown in Figure 1. The increase in decomposition onset temperature from
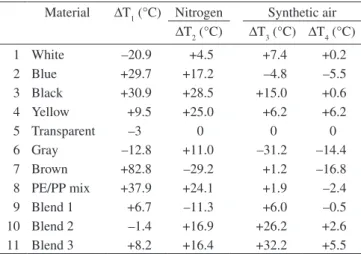
Table 1. Material type, color content, mass loss from temperatures ambient (Tamb) to 260 °C in nitrogen and synthetic air atmosphere; T1 and T2 in nitrogen atmosphere and T1, T3 and T4 in synthetic air, and mass gain from T3 to T4 (∆map) in synthetic air atmosphere.
Material Mass percent (wt. (%)) of
PE/PPmix
Mass loss (Tamb to 260 °C) (%)
Nitrogen Synthetic air
N2 Air T1 (°C) T2 (°C) T1 (°C) T3 (°C) T4 (°C) ∆map (T3 to T4) (%)
1 White 29.1 0.09 1.80 141.6 250.5 162.5 197.4 230.6 0.44
2 Blue 16.2 0.20 1.84 151.3 263.2 121.6 185.2 224.9 0.27
3 Black 14.7 0.20 1.91 167.4 274.5 136.5 205.0 231.0 0.18
4 Yellow 14.0 0.12 1.82 154.1 271.0 144.6 196.2 236.6 0.23
5 Transparent 12.9 0.26 1.95 143.8 246.0 146.8 190.0 230.4 0.51
6 Gray 4.8 0.26 2.28 146.0 257.8 158.8 158.8 216.0 0.54
7 Brown 4.6 0.17 3.38 160.8 216.8 78.0 191.2 213.6 0.32
8 PE/PP mix - 0.05 1.93 171.4 270.1 133.5 191.9 228.0 0.20
9 Blend 1 - 0.03 1.84 157.9 234.7 151.2 196.0 229.9 0.16
10 Blend 2 - 0.31 1.55 150.5 262.9 151.9 216.2 233.0 0.26
11 Blend 3 - 0.19 1.60 162.3 262.4 154.1 222.2 235.9 0.32
Synthetic air
0 100 200 300 400 500 600 700
0 20 40 60 80 100
231.0 °C 400.0 °C
Temperature (°C)
Mass loss (%)
Nitrogen
0 1 2 3 4
–d (Mass loss) / dT (%.°C
–1)
231 °C (Synthetic Air) to 400 °C (Nitrogen) clearly shows that an inert atmosphere protects against polymer decomposition.
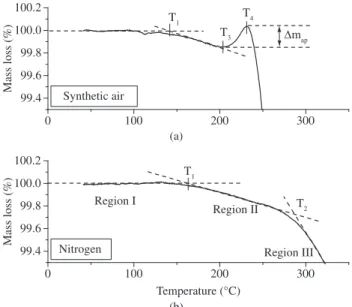
A more detailed analysis of the results from the curves in Figure 1 was performed in the temperature range from ambient to 350 °C, as shown in Figure 2.
It is clear in Figure 1 that irreversible degradation starts at around 400 °C in nitrogen atmosphere. However, the question is whether other thermal phenomena occur in the temperature range from ambi-ent to 400 °C. Apparambi-ently, the ordinate scale used in Figure 1 is too small, but when an amplified scale is used, as shown in Figure 2b, two events can be detected at temperatures T1 and T2 below 300 °C. The same holds for the results obtained in synthetic air atmosphere, of which an amplified representation is shown in Figure 2a. In this figure, three events are seen to occur at temperatures T1, T3 and T4, also below 300 °C. These observations corroborate those already reported in the literature5-7.
At this point, it is important to evaluate whether these trans-formations correspond to real phisicochemical events or merely to equipment noise, taking into account the precision of the experimental measurements.
Assuming a precision of 0.001 mg for the thermogravimetric equipment, for 5.000 mg or 13.000 mg samples the smallest possible physical measurements for the system are (0.001 mg / 5.000 mg) x
100% = 0.02 wt. (%) or (0.001 mg / 13.000 mg) x 100% = 0.008 wt. (%). In Figure 2a and 2b, the mass variations of up 0.02% observed in the temperature range from ambient to 100-120 °C are thus (given the measurement precision) probably due to convective effects caused by the carrier gas, with no significant mass loss or gain by the samples. Based on this fact T1 was defined as the intersection of the extrapolated baseline corresponding to 100% with the line tangent to the mass loss curve in the region of continuous mass reduction, as depicted in Figure 2.
T1 is the mass loss onset temperature (both in nitrogen and in synthetic air); therefore T1 values were near the melting temperature of polyethylene, indicating possible onset of volatilization processes.
In nitrogen atmosphere (Figure 2b), from T1, a monotonic decrease in mass loss can be seen which is accelerated from T2, indicating the probable onset of polymeric chain degradation and volatilization processes. Finally, from 400 °C (Figure 1), a pronounced and irreversible decrease in the mass loss is seen, indicating probable onset of pyrolysis.
The temperature T2 (Figure 2b) is the onset temperature of ac-celerated volatilization in nitrogen, probably due to the initial bulk polymer degradation and isolation of VOCs, oligomers, organic pigments, water, etc4. In this case T
2, as depicted in Figure 2b, was
determined as the intersection of the tangents to the mass loss curve in Regions II and III.
The temperature T3 ( Figure 2a) is the onset temperature for mass increase in synthetic air, due to intensive oxidation of the material and corresponds to the minimum observed in the TG curve.
In synthetic air (Figure 2a), mass loss starts at T1, but at T3 an initial mass gain can be observed, due to oxygen uptake which con-tinuously increases to the maximum absorption at T4, followed by a pronounced and irreversible decrease in the mass loss, indicating probable onset of pyrolysis.
The TG curve observed represents the sum of mass loss and mass gain processes occurring in the polymer; ∆map is therefore an apparent mass gain. In Figure 2a, from T3 on, the mass gain processes due to oxygen uptake are seen to overcome the mass loss processes in the same temperature range up to temperature T4, where the degradation processes balance the rate of oxygen uptake and irreversible degrada-tion starts. The higher this apparent mass gain (∆map) between T3 and T4, the higher is the incorporation of oxygen into the polymer chains, yielding higher oxygen uptake.
In Table 1 are listed experimental values of ∆map, T1, T2, T3 and T4, and the mass loss between ambient temperature and 260 °C obtained for all investigated samples, both in nitrogen and synthetic air atmospheres.
Figure 3 shows apparent mass gain in synthetic air (∆map), in the region between T3 and T4, as a function of temperature T4. The chart shows that Brown, Gray, Transparent and White raw materials have higher weight gains than other materials which may reflect higher incorporation into the polymer chains of functional groups containing oxygen, indicating higher susceptibility towards thermo-oxidative degradation. It is therefore important to note that the transparent and white raw materials yield higher T4 values. The raw materials in group III seem to achieve a good balance between mass gain and T4 values.
The temperature T4 corresponds to the peak in mass increase due to oxidation, observed only in synthetic air. T4 is a measurement of resistance to thermo-oxidation of the polymers, since the higher T4, the higher will be the temperature limit for processing without a high level of degradation, which implies a wider polymer processing window. T4 is related to several factors such as: the number of tertiary carbons in the polymer, which for polyethylenes is related to the number of branches on the polymer backbone and in polypropylene there is
0 100 200 300
99.4 99.6 99.8 100.0 100.2
map T4
T3
T1
Synthetic air
Mass loss (%)
0 100 200 300
99.4 99.6 99.8 100.0 100.2
Region III Region II
Region I T
2
T1
Nitrogen
Mass loss (%)
Temperature (°C)
Figure 2. Typical polyolefin thermogravimetric curves in synthetic air and in ni-trogen from ambient temperature to 350 °C, with mass-loss scale expanded.
210 215 220 225 230 235 240
0.0 0.1 0.2 0.3 0.4 0.5 0.6
Group III
Group II Group I
Blend 2 Blend 3
Yellow White
Transparent
Black Blend 1 PE/PP mix
Blue Gray
Brown
Mass g
ain (
∆
map
)(%)
T4 (°C)
Figure 3. Chart of ∆map vs. T4 for all investigated materials.
(a)
one tertiary carbon in each repeating unit; the content of substances slowing down the thermo-oxidation process, such as antioxidants in the polymer matrix, and amount of substances catalyzing thermo -oxidation reactions, for instance metals (iron, copper and zinc)5-7,9.
Figure 3 one may observe the following sequence of T4 values for the investigated materials: Brown < Gray < Blue < PE/PP mix < Blend 1 < Transparent < White < Black < Blend 2 < Blend 3 < Yellow. The behavior of the polyolefin mix before processing (PE/ PP mix) shows an intermediate value of T4, relative to the separate constituents. This shows that low T4 polymers, even when present in small amounts, affect the value of the mix property.
Using T4 as a selection criterion for recyclable materials, it is suggested that low T4 materials, in this case Brown and Gray are separated at a stage prior to polymer processing, in order to avoid propagation of thermo-oxidative degradation by materials with in-creased susceptibility towards degradation.
The recycled pigmented materials showing highest mass loss in synthetic air were Gray and Brown, indicating high susceptibility to oxidation and low thermal stability in synthetic air.
The effect on mass loss when the atmosphere is changed from synthetic air to nitrogen is clear (Table 1). As a rule, a nitrogen atmos-phere inhibits degradation processes. Based on these results, nitrogen atmosphere was chosen to process Blends 1, 2 and 3.
It should be taken into account that the blends are constituted of raw materials that were processed at least twice (in the case of the polyolefins their life cycle and for the blends the processing described in this paper). If the reprocessing to form the blends is aggressive, the expected mass loss from room temperature to 260 °C, which can be seen in Table 1 for the air atmosphere, may be higher than that reported here, principally comparing the values for the blends with that observed for the polyolefins. The experiments showed that when passing to the next processing cycle, mass loss from ambient temperature to 260 °C does not change significantly, indicating that the processing conditions are not aggressive.
To investigate the onset of mass loss before appreciable oxygen uptake, the following criterion was established, based on the experi-mental results shown in Table 2:
∆T1 = T1 (N2) -T1 (Air)
If ∆T1 > 0, oxidation process initiates decomposition. If ∆T1 < 0, oxygen inhibits decomposition.
The following series was established for the recycled materials:
∆T1 > 0: Brown >> PE/PP mix > Black > Blue >> Yellow
∆T1 < 0: White < Gray < Transparent.
and for the blends:
∆T1 > 0: Blend 3 > Blend 1
∆T1 < 0: Blend 2.
Considering that the PE/PP mix represents a mixture of all poly-olefins and, with exception of the Brown material, gives the highest
∆T1 > 0, one may suggest that the oxidation process dominates in the majority of recycled polyolefins, indicating susceptibility towards oxidation for these materials.
The following criteria were used to compare transparent poly-olefin with pigmented materials, to assess the effect of the different pigments (see Table 2).
In nitrogen, the temperature difference ∆T2 (N2) between pig-mented and transparent material allows the following series to be established for accelerated volatilization:
∆T2 (N2) > 0
Recycled materials: Black > Yellow > PE/PP mix > Blue > Gray > White > Transparent.
Blends: Blend 3 > Blend 2 > Transparent.
∆T2 (N2) < 0
Recycled materials: Brown < Transparent. Blends: Blend 1 < Transparent.
As to volatilization in nitrogen atmosphere, Brown recycled polyolefin and Blend 1 showed a high tendency to form volatile compounds.
In synthetic air the temperature difference ∆T3 (Air) between pigmented and transparent material allows the following series to be established for appreciable oxidation:
∆T3 (Air) > 0
Recycled materials: Black > White > Yellow > PE/PP mix > Brown > Transparent.
Blends: Blend 3 > Blend 2 > Blend 1 > Transparent.
∆T3 (Air) < 0
Recycled materials: Gray < Blue < Transparent.
Thus, only Gray and Blue show greater oxygen uptake than the transparent material.
In synthetic air, the temperature difference ∆T4 (Air), between pigmented and transparent material, allows the following series to be established with respect to maximum oxygen uptake:
∆T4 (Air) > 0
Recycled materials: Yellow > Black > White > Transparent. Blends: Blend 3 > Blend 2 > Transparent.
∆T4 (Air) < 0
Recycled materials: Brown < Gray < Blue < PE/PP mix < Transparent
Blends: Blend 1 < Transparent.
In relation to the oxidative degradation process Brown, Gray, Blue and PE/PP mix show inferior oxidative resistance in comparison to the transparent material. The same effect is seen for Blend 1, with 100% PE/PP mix.
The investigated sequences lead to simple and reliable recom-mendations for the mechanical processing of the materials.
4. Conclusions
A method is proposed for to analyse the thermal behavior of recycled polyolefins. This technique enables the effects of various pigments on volatilization, oxidation and process onset temperatures to be elucidated.
The technique was used to establish a few criteria with which to classify olefin components and blends containing recycled PET, impact modifier, compatibilizer and stabilizers.
It was observed that, in synthetic air, olefin components of waste with pigment of low thermal stability show a synergetic degradation
Table 2. Temperature differences: ∆T1 = T1 (N2) – T1 (Air); ∆T2 = T2 pigmented material – T2 transparent material; ∆T3 = T3 pigmented material – T3 transparent
material; ∆T4 = T4 pigmented material – T4 transparent material.
Material ∆T1 (°C) Nitrogen Synthetic air
∆T2 (°C) ∆T3 (°C) ∆T4 (°C)
1 White –20.9 +4.5 +7.4 +0.2
2 Blue +29.7 +17.2 –4.8 –5.5
3 Black +30.9 +28.5 +15.0 +0.6
4 Yellow +9.5 +25.0 +6.2 +6.2
5 Transparent –3 0 0 0
effect for both PE/PP mix and blends. In nitrogen, the synergetic effect was seen as a protection for PE/PP mix and blends by olefin components and high –thermal-stability pigments.
Acknowledgments
The authors are grateful to CNPq and FAI-UFSCar for financial support.
References
1. Chen C, Lai FS. Processability and thermal properties of blends of high-density polyethylene, poly(ethylene-terephthalate) and ethyl vinyl-acetate compatibilizer. Polym. Eng. Sci. 1994; 34(6):472-6.
2. Dimitrova TL, La Mantia FP, Pilati F, Toselli M, Valenza A, Visco A. On the compatibilization of PET/HDPE blends through a new class of copolyesters. Polymer. 2000; 41(13):4817-28.
3. Pluta M, Bartczak Z, Pawlak A, Galeski A, Pracella M. Phase structure and viscoelastic properties of compatilized blends of PET and HDPE recyclates. J. Appl. Polym. Sci. 2001; 82(6):1423-36.
4. Ezquerro O, Pons B, Tena MT. Direct quantitation of volatile organic compounds in packaging materials by headspace solid-phase
microex-traction-gas chromatography-mass spectrometry. J. Chromatogr. A. 2003; 985(1-2):247-57.
5. Gugumus F. Thermolysis of polyethylene hydroperoxides in the melt 3. Experimental kinetics of product formation. Polym. Degrad. Stab.2002; 76(1):95-110.
6. Gugumus F. Thermolysis of polyethylene hydroperoxides in the melt 1. Experimental kinetics of hydroperoxide decomposition. Polym. Degrad. Stab. 2000; 69(1):23-34.
7. Gugumus F. Thermolysis of polyethylene hydroperoxides in the melt 4. Effect of phenolic antioxidants and temperature on oxidation product formation. Polym. Degrad. Stab. 2002; 76(2):341-52.
8. Holcik J, Kosik M, Benbow AW, Cullis CF. Oxidative thermal-degradation of polypropylene and influence of transiction metal chelates. Eur. Polym. J. 1978; 14(9):769-72.
9. Gorghiu LM, Jipa S, Zaharescu T, Setnescu R, Mihalcea I. The effect of metals on thermal degradation of polyethylenes. Polym. Degrad. Stab. 2004; 84(1):7-11.
10. Gao Z, Amasaki I, Kaneko T, Nakada M, Calculation of activation energy from fraction of bonds broken by thermal degradation of polyethylene.