*e-mail: [email protected]
1. Introduction
Despite that electrical energy is indispensable today we must also consider the importance of portable power sources, especially the batteries, responsible for the operation of the main electronic marketed. Concern for the environment has increased signiicantly, many people recognize the importance of preserving natural resources. Thus, new and less-polluting products have been developed in an attempt to minimize the deleterious effect that is inherent to the industrial activity on the environment.
Materials, such as biodegradable plastics have been used more frequently; furthermore, recycling has gained importance, becoming an essential tool for reducing waste. Energy sources have also undergone major changes over the years and there is currently a range of clean energy sources as well as essential, renewable energy sources, such as wind1,
solar2, and geothermal3 energies, which currently produce
about 10% of the energy used in the world4.
Over the years, portable power sources and batteries, including AAA batteries, have undergone changes in terms of being reduced in size and improved in power capabilities, following a constant update of portable electronic items. It is estimated that over 10 billion batteries, including rechargeable batteries, are sold annually throughout the World5. From these, over 50% are incorrectly discarded in
the regular trash. In Brazil, despite the creation of laws that assign obligations to businessmen and consumers, it is noted that these devices continue to be dispensed into the trash6.
The lack of inspection and awareness associated with impunity contributes to the noncompliance of laws and,
consequently, to the contamination of the environment with the toxic metals from which these batteries are made. Among the metals, cobalt and lithium are present in so-called lithium-ion batteries, which represent secondary batteries that are most commonly consumed today. These batteries were introduced in the market in 1991 by Sony Energy Tech Incorporation7 and their charging involves the removal of
lithium ions from a LiMO2 electrode and their insertion into
a lithiated carbon electrode, according to a process known as the “Rocking Chair”8.
The lithium-ion batteries have a lithiated graphite anode (LiC6) and a cathode that, in current batteries, is composed of lithium cobaltate (LiCoO2), which has a high charge
capacity and high stability, increasing battery life. On the other hand, this cathode material represents about 30% of the world demand for cobalt, which caused the price to reach US$ 660.00 per kilogram in 2008[9], making LiCoO
2
a very expensive material that, consequently, also makes their by-products expensive, as is the case for lithium-ion batteries10.
In addition to economic issues, both cobalt and lithium are toxic to living organisms and may accumulate in the environment, contaminating soil, water, plants, and animals, getting to man. In an organism, these metals may cause dysfunction, mainly in the respiratory system, causing decreased lung function, and may cause congestion, edema, and hemorrhage in the lungs11.
In view of the neglect towards the environment and the high value LiCoO2 has acquired12, it is believed that the best
alternative would be to replace the LiCoO2 in batteries with
Pechini Synthesis of Nanostructured Li
1.05M
0.02Mn
1.98O
4(M = Al
3+or Ga
3+)
Fábio Augusto Amarala*, Laiane Kálita Santanaa, Iury Oliveira Camposa, Wélique Silva Fagundesa,
Farlon Felipe Silva Xaviera, Sheila Cristina Canobrea
aLaboratório de Armazenamento de Energia e Tratamento de Eluentes – LAETE, Instituto de Química, Universidade Federal de Uberlândia – UFU, Av. João Naves de Ávila, 2121,
CEP 38408-100, Uberlândia, MG, Brazil
Received: December 15, 2014; Revised: August 30, 2015
Doped Li1.05M0.02Mn1.98O4 (M = Ga3+ or Al3+) were prepared by Pechini synthesis using lithium
and manganese acetates, citric acid, ethylene glycol, and the respective oxide or acetate of the doping ions in molar ratios of 2.00 (Mn1.98 + M0.02) to 1.05 Li. The TGA/DTA of the precursor gels showed weight loss/energy relative to crystallization below 450 ºC. From the XRD, a single cubic phase (FD3M) was identiied for the all-doped or undoped oxides after only 2 h calcination. The unit cell parameters a for both aluminum- and gallium-doped oxides calcined at 750 °C for 2 h (8.212 Å and 8.210 Å, respectively) were higher than that for the undoped oxide (8.199 Å). The crystallite sizes ranged from ~ 20 nm to 70 nm, conferring nanometric character. The speciic capacities decreased in order: Cdischarge (Li1.05Mn2O4) >Cdischarge (Li1.05Ga0.02Mn1.98O4) >Cdischarge (Li1.05Al0.02Mn1.98O4), but with increasing capacity retention for the doped samples.
of a less harmful material that could be more abundant, and consequently cheaper than cobalt-containing batteries. In this way, LiMn2O4 emerges as an interesting option for this issue, as many Mn reserves exist in the world (5.7 billion tons in 2006)13, and this, as well as its oxide, presents little risk to
the environment.
On the other hand, LiMn2O4 presents a problem in terms of maintaining its ability to charge storage as compared to LiCoO2. The Jahn–Teller effect occurs because of a structural anisotropic distortion in the d orbitals from Mn3+, changing the
compact cubic symmetry to tetragonal symmetry. This local distortion is related to the vacancy/occupancy of the eg antibonding orbital of the Mn3+ ion during successive charge
and discharge cycles14-17. The gradual loss of speciic capacity
leads to a decrease in the useful life time of these batteries, which could represent huge inancial losses. This problem can be minimized by reducing the Mn3+ amount in the spinel
structure and increasing the Mn4+ amount, which do not
suffer Jahn–Teller distortion. In order to achieve that, one can dope, that is, replace a certain amount of trivalent manganese (in proportions less than 5%) in the lithium manganate structure with other trivalent cations that have similar ionic radii and do not present the Jahn–Teller distortion18.
Furthermore, it is known that the charge-storage capacity of these materials is strongly inluenced by the surface characteristics and particle size of the oxides that are inluenced by the synthetic route. Thus, using the Pechini method can contribute towards achieving nanostructured oxides with unique crystallographic phases that present electrochemical activity. The principle of this method consists of chelate formation among metallic cations and a carboxylic acid (citric acid) with subsequent esteriication reaction between the formed chelate and a polyalcohol (ethylene glycol), giving rise to a polymer precursor19.
The formed substance will yield a homogeneous oxide after thermal treatment. The Pechini method can be realized at low temperatures, allowing stoichiometric control of the atoms in the crystalline structure and the obtainment of highly pure and nanometric powders, making it a valuable method for obtaining cathodic materials20.
Considering this, the main objectives of this work were to investigate the eficiency of the Pechini methodology for the production of stoichiometric Li1.05Mn2O4 and to assess its doping with gallium and aluminum, analyzing whether there is an improvement in the electrochemical behavior of the doped samples compared with the undoped samples. The purpose of this synthesis route was to produce materials to be used as cathodes in environmentally less-harmful lithium-ion batteries that present a minimized Jahn–Teller effect.
2. Material and Methods
2.1. Preparation of the dopant precursor
The following precursors were used in the synthesis of the doped Li1.05M0.02Mn1.98O4 oxides (M = Ga3+ or Al3+):
Ga2O3 (Aldrich, PA) and Al(C2H3O2)2 (Aldrich, PA).
The doped oxides were prepared by Pechini synthesis with the precursors in the molar ratios of 2.00 (Mn1.98 + M0.02),
1.05 Li, and 1.00 (citric acid).
Doping with gallium was performed using gallium hydroxide, which was obtained by dissolving Ga2O3 (Aldrich, PA) in hydrochloric acid (Merck, PA). After dissolution, the pH of the solution was adjusted to 4.5 by addition of 2.0% ammonium hydroxide (Mallinckrodt, PA). More simply, the aluminum dopant was obtained by direct addition of basic aluminum acetate, requiring no treatment with hydrochloric acid.
2.2. Synthesis of Li
1.05M
0.02Mn
1.98O
4(M=Ga
3+or
Al
3+)
21-23To obtain a homogeneous material with the same stoichiometric control, the molar ratio of precursors were 1.05:1.98 for lithium and manganese acetates (Aldrich, PA), 0.02 of the doping metal (aluminum or gallium) (Aldrich, PA), and 1:4 citric acid (Synth, PA) to ethylene glycol (Synth, PA). Doping was performed by adding gallium hydroxide in deionized water whilst stirring and heating. Subsequently, citric acid was added under constant stirring. The pH of the solution was increased to 10.0 with the addition of 2.0% NH4OH, forming a translucent yellow-colored solution.
This clear solution was added to ethylene glycol (Vetec, PA). The ratio used to prepare these samples was calculated from the molar ratio 1:4 citric acid to ethylene glycol. The solution was stirred and heated to obtain a viscous resin. The undoped oxide was also synthesized for comparative purposes. First, citric acid was dissolved in distilled water, followed by addition of lithium, manganese, and gallium acetates; NH4OH
(Aldrich, PA) was used to adjust the pH to between 9 and 10. Then, ethylene glycol was added drop-wise, stirring to form a viscous liquid that was heated up to 140 °C in order to form a gelatinous material (polymer precursor).
2.3. Calcination of the polymeric precursor
The resulting gel was calcined for various times (30, 60, 120, and 360 min) and at various temperatures (500, 600, 700, and 750 °C). A sample obtained by solid-state reaction at 750 °C for 24 h (2880 min) was used as a reference. The particle size of the calcined oxides was controlled by deagglomeration in mortar by passing the sample through a #325 mesh sieve (smaller than 45 μm).
2.4. Thermal characterization by TGA/DTA
Thermogravimetric analysis (TGA/DTA) were performed on DTG-60H Shimadzu equipment, Simultaneous DTA-TG apparatus. The heating routine occurred from room temperature (approximately 25 °C) to 1000 °C at 10 °C min–1 using N
2.
2.5. Structural characterization by XRD
The structural characterization was performed by X-ray diffraction (XRD) using a Shimadzu diffractometer (Model 6000, radiation Cu Kα, λ = 1.5406 Ǻ) with a voltage of 40 kV, current of 30 mA, at 2θ min–1 from 10° to 80°.
The crystallite sizes were calculated using the Scherrer equation24-30, the full width–half maximum (FWHM), were
2.6. Morphological characterization by SEM
SEM images were obtained using a Hitachi electronic scanning microscope, Model 3000, enlarging the images 1000 and 5000 times with acceleration voltages of 5 and 10 kV.
2.7. Speciic surface area determination by B.E.T.
The speciic Brunauer–Emmett–Teller (B.E.T.) surface areas were determined by the Micromeritics ASAP 2020 apparatus from nitrogen adsorption isotherms at 77 K. Prior to the analysis, the samples were degassed overnight at 150 °C with a heating rate of 10 °C min–1.
2.8. Cell assembly and electrochemical
characterization by Cyclic Voltammetry and
Charge/Discharge
For the electrochemical evaluation, electrodes were made with 85% of the synthesized oxide (by mass), 10% acetylene black (Vulcan XC 72-GP 2800, Cabot Corp., USA), and 5% polyvinylidene luorine (PVDF) (Aldrich, PA) dispersed in cyclohexanone (Aldrich, PA). The sludge containing the electrode material was painted on the platinum.
The electrodes containing the synthesized oxide were then submitted to cyclic voltammetry measurements in a potential range of –0.5 to 1.30 V vs. Ag/AgCl at 0.5 mV s–1,
using a disassembled cellular telephone battery (LiC6) as the counter electrode and conventional liquid organic solvent used in lithium batteries, EC/DMC (ethyl carbonate/ dimethyl carbonate) containing LiClO4 1 mol L
-1 (as electrolyte)
using an Autolab potentiostat 302 N, interfaced with a microcomputer using GPES software version 4.9.
Chronoamperometry tests to evaluate the charge-storage capacity of the cathodes were carried out using an anodic current of 40 µA (C/1) up to 4.35 V (vs. Li/Li+) and 80 µA
(C/2) up to 3.60 V (vs. Li/Li+), in a dry Labconco chamber
(Model 50600) with controlled humidity (< 10 ppm of H2O) by passage of argon (Air Liquid, 99.999%).
3. Results and Discussion
3.1. Thermal characterization by TGA/DTA
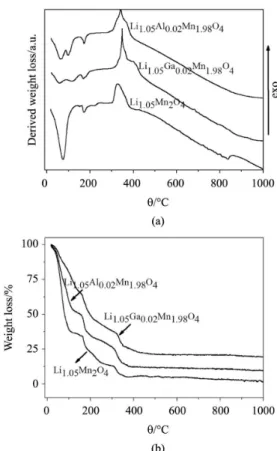
Figure 1a, b show the DTA/TGA curves of the precursor gels used in the Pechini synthesis for doped and undoped LiMn2O4 powders. There was heat absorption (endothermic reaction) at the approximate temperatures of 100, 200, and 450 °C. These thermal reactions can be related to water evaporation, organic residue elimination, and sample crystallization, respectively, according to Suryakala et al.25.
Similarly to the DTA, the mass losses at temperatures of 100, 200 and 450 °C correspond to water elimination, organic compound elimination, and crystallization of the sample, respectively. These results are in agreement with those obtained by Huang, as he also identiied three well-deined mass-loss phases during LiMn2O4 synthesis using the
solid-state reaction26. After 500 °C, there was no further mass loss,
nor release or heat absorption, allowing us to conirm that, after this temperature, no further reaction occurred. However, the samples calcined at 500 °C did not show satisfactory electrochemical proiles and, therefore, although the samples are already crystallized at this temperature, they did not acquire an ideal spinel structure for lithium-ion intercalation and deintercalation, as can be seen in Figure 2.
3.2. Structural characterization by XRD
The XRD patterns of the oxides subjected to different thermal treatments show that the samples calcined at 750 °C formed structures similar to the pattern in JCPDS 35-0782, as shown in Figure 3a, b. However, the obtained structures at 700 °C already showed signiicant structural similarities with few interferences, which can mainly be observed in the doped samples, with aluminum showing higher phase ordering and crystallinity. Furthermore, it is possible to note that the undoped samples showed a large amount of interferences, which may be related to the insuficient calcination time, as these additional peaks are not observed in the XRD patterns of the samples calcined for longer periods, as shown in Figure 4.
Regarding the calcination time, it was observed that at longer times, the oxide structures presented unique phases and were more organized (Figure 4), which shows the differences between the XRD patterns of the calcined doped and undoped Li1.05Mn2O4 samples at different times. Besides, the XRD patterns of the samples doped with aluminum showed a higher ordering of the phase and less impurities at all times evaluated. Figure 4 shows well-deined diffraction peaks for the samples calcined for more than 120 min, presenting structures similar to that of the stoichiometric spinel LiMn2O4(JCPDS 35-782) with a cubic unit cell belonging to the FD3M. However, the samples calcined for 360 min were more organized and crystalline, as evidenced by the FWHM (Figure 5).
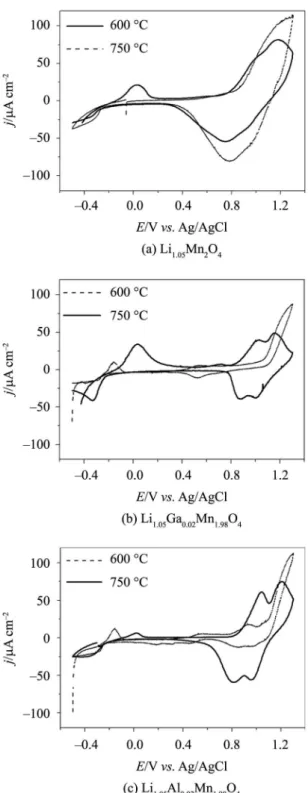
Figure 2. Cyclic voltammograms of the electrodes: (a) Li1.05Mn2O4; (b) Li1.05Ga0.02Mn1.98O4; (c) Li1.05Al0.02Mn1.98O4, calcined at 600 °C or 750 °C for 120 min; in EC/DMC LiClO4 1 mol L–1 at 0.5 mV s–1.
Figure 3. XRD patterns of the: (a) Li1.05Mn2O4; (b) Li1.05Ga0.02Mn1.98O4 and (c) Li1.05Al0.02Mn1.98O4, calcined for 120 min at different temperatures.
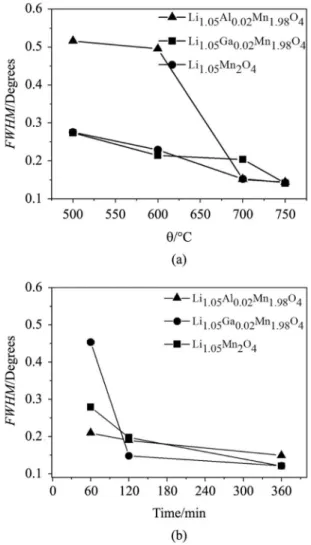
3.2.1. FWHM
According to Manev et al.27 and Lee et al.28, the position
and FWHM of the (400) plane peak are important factors, indicating the crystallinity degree of a spinel powder. The narrow shape of the relections, quantiied by the full
time. That the synthesized samples are as crystalline as those with higher calcination times. All samples presented high crystallinity at calcination times of 1440 min (XRD does not show); however, the samples doped with aluminum showed, even after 60 min, higher crystallinity than the other samples; therefore, it is expected that a higher insertion of Figure 4. XRD patterns of the: (a) Li1.05Mn2O4; (b) Li1.05Ga0.02Mn1.98O4; (c) Li1.05Al0.02Mn1.98O4, calcined at 750 °C for different times.
Figure 5. FWHM of the Li1.05Mn2O4, Li1.05Ga0.02Mn1.98O4 and Li1.05Al0.02Mn1.98O4 as a function of the: (a) temperature calcination (for 120 min); (b) time calcination (at 750 °C).
lithium ions occurs in these samples29. When comparing the
variation of the FWHM as a function of the temperature, it is also possible to observe that the crystallinity of the samples increases as the temperature increases (Figure 5). Moreover, it can be noted that the temperature is the factor that most affects the crystallinity, as the FWHM decreases abruptly.
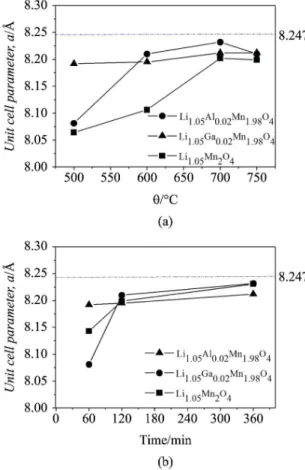
3.2.2. Unit cell parameter
In order to evaluate the inluence of the doping on the crystalline lattice of the obtained spinel oxides, the unit cell parameter a was calculated from the XRD data by the least-squares method. Figure 6a, b show the unit cell parameter of the samples calcined at different times and temperatures, which presented higher crystallinity and resemblance to the standard stoichiometric LiMn2O4 (a = 8.247 Å, JCPDS 35-0782). Amatucci et al.30 reported
a value of a = 8.235 Å for LiXMn2O4 (x = 1.03) obtained by
solid-state reaction at 800 °C for 24 h. In general, doped samples showed similar values than the undoped samples, suggesting effective doping, as this process is associated with the substitution of Mn3+ ions (ionic radius of 0.65 Å)
state and smaller ionic radius (Al3+ or Ga3+ with ionic radius
of 0.53 or 0.63 Å, respectively)31. Thus, it is possible to
justify the higher values for the samples doped with Ga3+.
However, these reduced values suggest that the oxides suffer less deformation during cycling, which results in a lower speciic-capacity loss.
3.2.3. Crystallite size
According to the values shown in Figure 7a, b, the crystallite sizes were found to increase as the calcination temperature and time increases. These results are in agreement with those obtained by Chaves32 that used the Pechini method
for obtaining cerium and nickel oxide. This increase in the crystallite size can be explained by the reduction of internal stresses that occur with the increase in temperature that allows further growth of the crystallites33. However, it is
also possible to observe that the crystallite size increases as the calcination time increases, as shown in Figure 7b, due to the decrease in surface tension. The crystallite sizes of the oxides increased from ∼20 nm to ∼70 nm, indicating that the crystallinity of LiMn2O4 is gradually improved with
enhancing the time and temperature, tendency also reported by Zhan et al.34 using the solid state reaction to produce
stoichometric LiMn2O4. But in this work, the crystallite sizes
were smaller than those obtained by solid state reaction, indicating character nanometric of the particles.
3.3. Morphological characterization by SEM
The SEM images of the Li1.05Mn2O4, Li1.05Ga0.02Mn1.98O4,
and Li1.05Al0.02Mn1.98O4 samples calcined at 750 °C for 120 min showed that, in general, the undoped samples presented a greater uniformity in terms of the size of their particles compared to the doped samples (Figure 8). Furthermore, for all samples, the formation of large cluster numbers can be observed, as also reported by Chaves32, which is a
typical feature of nanostructured particles, due to the intense attractive van der Waals forces acting among the particles35.
Furthermore, it was observed that these clusters have symmetrical geometric form and a wide particle distribution, similar for spinel MgAl2O4 oxides.
3.4. Speciic surface area determination by B.E.T.
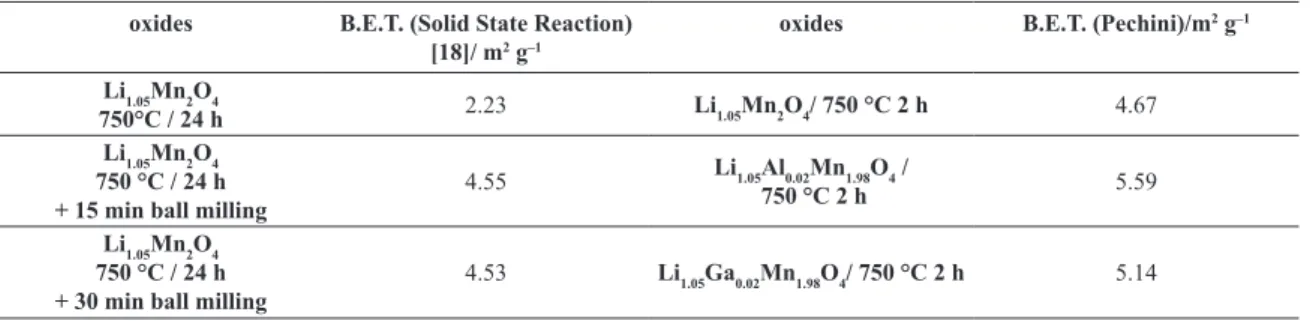
Table 1 shows the speciic surface area data determined by the BET method for the different LiMn2O4 oxides obtained by different synthesis routes. It can be seen that the surface area for the oxides synthesized by the Pechini method were higher than those by solid-state reaction Figure 6. Unit cell parameters of the Li1.05Mn2O4, Li1.05Ga0.02Mn1.98O4
and Li1.05Al0.02Mn1.98O4 (Å) as a function of the: (a) temperature calcination (for 120 min); (b) time calcination (at 750 °C).
(even when subjected to further mechanical ball milling)18.
However, these values were lower than those obtained by combustion synthesis (~ 8.88 m2 g–1)36,37, probably because
of the large volume of gases released by the combustion method during the synthesis. Higher B.E.T. surface area values were found for LiMn2O4 obtained by other authors
by sonochemical (6.8 m2 g–1)38, but lower values by sol gel
methods (1.08 m2 g–1)39. In general, the values found in this
study were higher than the average found in literature. This surface area conirmed the reduced crystallite size and the existence of clusters consisting of nanometric particles40.
3.5. Electrochemical characterization by Cyclic
Voltammetry and Charge/Discharge
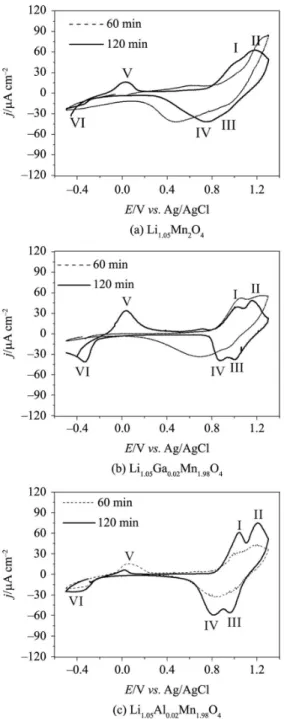
Figure 9 shows the stabilized cyclic voltammograms (3rd cycles) of the oxides calcined at 750 °C for 60 or 120 min.
The voltammetric proiles of the samples calcined for 120 min
were similar to those obtained for stoichiometric LiMn2O4, showing that the redox processes occur in two stages, at 1.10/0.87 V (I/IV in Figure 9) and 1.15/1.00 V (II/III) vs. Ag/AgCl, corresponding to the desintercalation/intercalation of the irst lithium ion in the LiXMn2O4 structure (0 ≤ x ≤ 1)
in the octahedral sites16. It was observed that the sample
doped with gallium and aluminum showed redox peaks that were better deined, indicating a higher charge-storage capability in this potential range. However, these redox processes were not evidenced for oxides calcined at 750 °C for 60 min. Furthermore, the desintercalation/intercalation of the second lithium ion in the LiXMn2O4 structure (1 ≤ x ≤ 2)
occurred in one stage at 0.20/–0.35 V (V/VI), suggesting a higher charge storage in the tetrahedral sites16. Although,
the calcination time inluenced the electrochemical proiles, it was also possible to observe higher variations in the voltammetric proiles of the samples calcined at 600 and Figure 8. SEM images of the: (a) and (d) Li1.05Mn2O4; (b) and (e) Li1.05Ga0.02Mn1.98O4; (c) and (f) Li1.05Al0.02Mn41.98O4; calcined at 750 °C for 120 min.
Table 1. Speciic surface area data (B.E.T.) for Li1.05Mn2O4 obtained by different synthesis methods.
oxides B.E.T. (Solid State Reaction) [18]/ m2 g–1
oxides B.E.T. (Pechini)/m2 g–1
Li1.05Mn2O4
750°C / 24 h 2.23 Li1.05Mn2O4/ 750 °C 2 h 4.67
Li1.05Mn2O4 750 °C / 24 h + 15 min ball milling
4.55 Li1.05Al0.02Mn1.98O4 /
750 °C 2 h 5.59
Li1.05Mn2O4
750 °C / 24 h + 30 min ball milling
750 °C for 120 min, indicating that a higher calcination temperature is necessary (Figure 2).
Figure 10 shows the speciic discharge capacity calculated for the samples calcined at 750 °C for 120 min. It was observed that after ten cycles, the speciic discharge capacity was kept between 105 and 100 mA h g–1 for all samples,
which are closer to the practical capacities of 120 mA h g-1
(80% of the theoretical values), indicating that lithium-ion intercalation/deintercalation processes were favored in the oxide structure, due to the higher ordering of the phase and
the fewer impurities present in the oxide for this investigated calcination time and temperature.
4. Conclusions
It was possible to obtain a doped lithiated manganese oxide in the stoichiometric spinel phase with a cubic structure by the Pechini method at low calcination temperatures and times. Thus, LiMn2O4 doped with aluminum and gallium
resulted in a single cubic phase at 750 °C for only 120 min of calcination. The crystallite sizes ranged from ~20 nm to ~70 nm, conferring nanometric character of the synthetized oxide particles. The unit cell parameter a calculated for doped spinel samples calcined with aluminum and gallium for 2 h at 750 °C (8.212–8.210 Å) were higher than for the undoped samples (8.199 Å). The temperature increase and the varied calcination times provided samples with higher crystallinity and crystals organization that favored lithium-ion insertion and extraction in the oxide structure. The SEM images of the oxides showed symmetrical geometric forms with a wide particle distribution. The voltammetric proiles of the samples calcined for 120 min were similar to those obtained for LiMn2O4, showing that the redox processes occurred in two stages, corresponding to lithium-ion deintercalation/ intercalation in the LiXMn2O4 structure (0 ≤ x ≤ 1). It was
observed that the sample doped with gallium and aluminum showed more well-deined redox peaks, indicating a higher charge-storage capability in this potential range. However, these redox processes were not evidenced for oxides calcined at 750 °C for 60 min. Thus, the oxides calcined at 750 °C for 120 min showed high speciic capacity values (80% of the theoretical values), decreasing in the order Cdischarge (Li1.05Mn2O4) >Cdischarge (Li1.05Ga0.02Mn1.98O4) >Cdischarge.
(Li1.05Al0.02Mn1.98O4), but with a greater conservation of the discharge capacity for the doped samples after ten charge and discharge cycles.
Acknowledgments
We acknowledge MIZUMO (Jacto group). This work is a collaboration research project of members of the Rede Mineira de Química (RQ-MG) supported by FAPEMIG (Project: APQ 2279/2010).
Figure 9. Cyclic voltammograms of the electrodes: (a) Li1.05Mn2O4; (b) Li1.05Ga0.02Mn1.98O4; (c) Li1.05Al0.02Mn1.98O4, calcined at 750 °C for 60 or 120 min; in EC/DMC LiClO4 1 mol L–1 at 0.5 mV s–1.
Figure 10. Discharge speciic capacities of the electrodes of the oxides calcined at 750 °C for 120 min, in EC/DMC LiClO4 1 mol L–1
References
1. Jacobson MZ and Masters GM. Exploiting wind versus coal.
Science. 2001; 293(5534):1438. http://dx.doi.org/10.1126/ science.1063376. PMid:11520970.
2. Cruz D. Ciências e educação ambiental. São Paulo: Ática; 2001.
3. Agência Brasileira de Inteligência – ABIN. País começa a
investir em geotérmica. ABIN; 2007. Available from: <http:// www.abin.gov.br/modules/articles/article.php?id=156>. Access in: 25 Apr. 2013.
4. Goldemberg J and Lucon O. Energia e meio ambiente no Brasil. EDUSP; 2006. Available from: <http://www.fcmc.es.gov.br/ download/Energia_meioambiente.pdf>. Access in: 12 July 2013.
5. Reidler NMVL and Günther WMR. Impactos ambientais e sanitários causados por descarte inadequado de pilhas e baterias usadas. Revista Limpeza Pública. 2003; 60:20-26.
6. Scaramel MP, Malafaia G and Rodrigues ASL. Problemática do descarte inadequado de pilhas e baterias de celular no município de Pires do Rio – GO: uma análise das percepções reveladas por consumidores e vendedores. Global Science and
Technology. 2011; 4(2):90-104.
7. Pesquero NC, Bueno PR, Varela JA and Longo E. Materiais cerâmicos de inserção aplicados a baterias de Íons Lítio.
Cerâmica. 2008; 54(330):233-244.
8. Schoonman J, Tuller HL and Kelder EM. Defect chemical aspects of lithium-ion battery cathodes. Journal of Power Sources. 1999; 81:44-48. http://dx.doi.org/10.1016/S0378-7753(99)00128-7. 9. London Metal Exchange – LME. Historical price graph for
cobalt. LME; 2015. Available from: <http://www.lme.com/ metals/minor-metals/cobalt/#tab2>. Access in: 22 July 2015. 10. Cobalt Development Institute – CDI. Cobalts in Eletronics. In:
Cobalt Development Institute. Cobalt in eletronics. Guildford: CDI; 2006. Available from: <http://www.thecdi.com/cdi/images/ documents/facts/COBALT_FACTS-Electronics.pdf>. Access in: 04 May 2013.
11. Alves ANL and Della Rosa HV. Exposição ocupacional ao cobalto: aspectos toxicológicos. Revista Brasileira de Ciências
Farmacêuticas. 2003; 39(2):129-139.
12. Schalkwijk WA and Scrosati B. Advances in lithium-ion batteries. Norwell: Kluwer Academic Publishers; 2002.
13. Brasil. Departamento Nacional de Produção Mineral – DNPM.
Sumário mineral 2014. Brasília: DNPM/MME; 2014. 14. Park YJ, Kim JG, Kim JG, Kim MK, Kim HG, Chung HT
and Park Y. Electrochemical properties of Limn2o4 thin films: suggestion of factors for excellent rechargeability. Journal of
Power Sources. 2000; 87(1-2):69-77. http://dx.doi.org/10.1016/ S0378-7753(99)00362-6.
15. Sun YK, Oh B and Lee JH. Synthesis and electrochemical
characterization of oxysulfide spinel LiAl0.15Mn1.85O3.97S0.03
cathode materials for rechargeable batteries. Electrochim Acta. 2000; 46:541-546.
16. Julien CM. Local structure of lithiated manganese oxides. Solid State Ionics. 2006; 177:11-19.
17. Shaju KM and Bruce PG. A stoichiometric Nano-LiMn2O4 spinel electrode exhibiting high power and stable cycling.
Chemistry of Materials. 2008; 20(17):5557-5562. http://dx.doi. org/10.1021/cm8010925.
18. Amaral FA, Bocchi N, Brocenschi RF, Biaggio SR and Rocha-Filho RC. Structural and electrochemical properties of the doped spinels Li1.05M0.02Mn1.98O3.98N0.02 (M = Ga3+, Al3+, Or Co3+; N=S-2
Or F-) for use as cathode material in lithium batteries. Journal
of Power Sources. 2010; 195(10):3293-3299. http://dx.doi. org/10.1016/j.jpowsour.2009.12.002.
19. Pailhé N, Wattiaux A, Gaudon M and Demourgues A. Impact of
structural features on pigment properties of α-Fe2O3 haematite. Journal of Solid State Chemistry. 2008; 181(10):1040-1047. http://dx.doi.org/10.1016/j.jssc.2008.06.049.
20. Costa ACFM, Ramalho MAF, Neiva LS, Alves S Jr, Kiminami RHGA and Gama L. Avaliação do tamanho da partícula do ZnO obtido pelo método Pechini. Revista Eletrônica de Materiais
de Processos. 2007; 2(3):14-19.
21. Costa ACFM, Vilar MA, Lira HL, Kiminami RHGA and
Gama L. Síntese e caracterização de nanopartículas de TiO2. Cerâmica. 2006; 52:255-259.
22. Barbosa R, Barros BS, Porto RI and Gama L. Síntese e
caracterização do espinélio Zn7Sb2O12 Dopado com Terras
Raras. Revista Matéria. 2005; 10(2):364-369.
23. Pimentel PM, Martinelli AE, Melo DMA, Pedrosa AMG, Cunha JD, Silva CN Jr. Pechini synthesis and microstructure of nickel-doped copper chromites. Materials Research. 2005; 8(2):221-224.
24. Klung H and Alexander L. X-ray diffraction procedures. New York: Wiley; 1962. 491 p.
25. Suryakala K, Kalaignan PG and Vasudevan T. Synthesis and electrochemical improvement of nanocrystalline LiMn
2-xMgxO4 powder using sol-gel method. International Journal
of Electrochemical Science. 2006; 1:372-378.
26. Huang Y, Li J and Jia D. Preparation and characterization of
LiMn2O4 nanorod by low-heating solid-state coordination method. Journal of Nanoparticle Research. 2004; 6(5):533-538. http://dx.doi.org/10.1007/s11051-004-1715-2.
27. Manev V, Faulkner T and Engel J. Lithium ion batteries: prospects and futures. In: Proceedings of the irst Hawaii Battery
Conference; 1998; Honolulu. Honolulu: HBC98; 1998. p. 228.
28. Lee YS, Kumada NJ and Yoshio M. Synthesis and characterization
of lithium aluminum-doped spinel (LiAlxMn2-xO4) for lithium secondary battery. Journal of Power Sources. 2001; 96:376-384. 29. Sun Y, Park G, Lee Y, Yoashio M and Nahm KS. Structural
changes (degradation) of oxysulfide LiAl0.24Mn1.76O3.98S0.02 spinel on high-temperature cycling. Journal of the Electrochemical
Society. 2001; 148(9):994. http://dx.doi.org/10.1149/1.1391270. 30. Amatucci GG, Pereira N, Zheng T and Tarascon J-M. Failure
mechanism and improvement of the elevated temperature cycling of LiMn2O4 compounds through the use of the LiAlxMn2 −xO 4 −z F z
solid solution. Journal of the Electrochemical Society. 2001; 148(2):171-182. http://dx.doi.org/10.1149/1.1342168. 31. Shannon RD. Revised effective ionic radii and systematic
studies of interatomic distances in halides and chalcogenides.
Acta Crystallographica. 1976; 32(5):751-767. http://dx.doi. org/10.1107/S0567739476001551.
32. Chaves AC. Síntese, estudo cinético e análise micro estrutural
do sistema cério-níquel obtido pelo método pechini. [Thesis]. Natal: Universidade Federal do Rio Grande do Norte; 2009. 33. Cullity BD and Stock SR. Elements of X-ray diffraction. New
Jersey: Prentice Hall; 2001. 626 p.
34. Zhan D, Yang F, Zhang Q, Hu X and Peng T. Effect of
solid-state reaction temperature on electrochemical performance of LiMn2O4 submicro-rods as cathode material for Li-ion
battery by using γ-MnOOH submicro-rods as self-template. Electrochimica Acta. 2014; 129:364-372. http://dx.doi. org/10.1016/j.electacta.2014.02.141.
35. Raveau B and Seikh MM Chapter 3 – magnetic and physical properties of cobalt perovskites. In: Buschow KHJ, editor.
36. Lima ANC. Obtenção e caracterização de espinélio MgAI2O4
nanoestruturado através de síntese por combustão em solução. [Dissertation]. Porto Alegre: Universidade Federal do Rio Grande do Sul; 2007.
37. Amaral FA, Guerra RF, Santana LK and Canobre SC. Influence of different fuel agents on the combustion synthesis of the nanostructured Li1.05Mn2O4 Oxide. Materials Research. 2014; 17(1):161-166..
38. Kiani MA, Mousavi MF and Rahmanifar MS. Synthesis of nano- and micro-particles of LiMn2O4: electrochemical investigation
and assessment as a cathode in li battery. International Journal
of Electrochemical Science. 2011; 6:2581-2595.
39. Yang-Chao C, Kai X, Yi P, Chun-Man Z and Hua-Lin W.
High-power nano-LiMn2O4 cathode materials with high-rate pulse discharge capability for lithium-ion batteries. Chinese
Physics B. 2011; 20:1-6. http://dx.doi.org/10.1088/1674-1056/20/2/028201.
40. Webb PA, Orr C, Camp RW and Olivier JP. Analytical methods