0103 - 5053 $6.00+0.00
A
r
ti
c
le
* e-mail: [email protected]
Interactions of Chlorine with Tropical Aquatic Fulvic Acids and Formation of Intermediates
Observed by Fluorescence Spectroscopy
Eduarda R. Carvalhoa,b, Ladislau Martin-Neto*,a, Débora M.B.P. Miloria, Julio C. Rochac and André H. Rosad
a
Embrapa Instrumentação Agropecuária, CP 741, 13560-970 São Carlos - SP, Brazil
b
Interunidades Ciências e Engenharia de Materiais: EESC, IFSC, IQSC, Universidade de São Paulo, CP 369, 13566-590 São Carlos - SP, Brazil
c
Instituto de Química, Universidade Estadual Paulista, CP 355, 14800-900 Araraquara - SP, Brazil
d
Departamento de Engenharia Ambiental, Universidade Estadual Paulista, 18087-180 Sorocaba - SP, Brazil
A interação entre ácidos fúlvicos aquáticos (AFA) de região tropical com cloro e formação de trihalometanos foi estudada por fluorescência. As substâncias húmicas aquáticas (SHA) foram extraídas de córrego com coloração escura (localizado em uma área de proteção ambiental perto da cidade de Cubatão-SP, Brasil) utilizando resina XAD 8, de acordo com o procedimento recomendado pela Sociedade Internacional de Substâncias Húmicas. As medidas de fotoluminescência foram feitas em espectrômetro Perkin Elmer utilizando-se amostras de AFA tratadas e sem tratamento com cloro em diferentes tempos de reação (1, 24, 48, 72 e 168 h) e concentrações de cloro (2,5; 5,0; 10,0 e 20,0 mg L-1). A intensidade de fluorescência relativa foi significativamente diminuída com o
aumento da concentração de cloro e tempo de reação. A redução na intensidade de fluorescência na região de maiores comprimentos de onda foi interpretada como um indicativo da interação entre os grupos aromáticos condensados dos AFA e o cloro.
The interactions of tropical aquatic fulvic acids (AFA) with chlorine and formation of trihalomethanes were characterized by fluorescence spectroscopy. The aquatic humic substances (AHS) were isolated from a dark-brown stream (located in a environmental protection area near Cubatão city in São Paulo State, Brazil) by means of the collector XAD 8 according the procedure recommended by the International Humic Substances Society. The photoluminescence measurements were made by using a Perkin Elmer spectrometer; AHS, aquatic humic acids (AHA) and AFA samples were assayed. The interactions of AFA and chlorine were characterized by using different reaction times (1, 24, 48, 72 and 168 h) and chlorine concentrations (2.5, 5.0, 10.0 and 20.0 mg L -1). The relative fluorescence intensity for AFA was significantly decreased with the increasing of
chlorine concentration and reaction time. The reduction of fluorescence intensity in the region of longer wavelength was interpreted as an indicative of interaction between condensed aromatic groups of AFA and chlorine.
Keywords: aquatic fulvic acids, photoluminescence, trihalomethanes, natural waters, aquatic
humic substances
Introduction
The influent of a drinking-water-treatment plant usually contains 2-6 mg of dissolved organic carbon (DOC) per liter and a significant fraction (40-60%) consists of aquatic humic substances (AHS).1,2 These naturally
occurring materials are formed by degradation of plants
and/or by polymerization of smaller organic molecules present in the environment.3,4
systems. Besides these aspects, reactions between aquatic Humic Substances (HS) and halogen-based oxidants, during water chlorination process, can lead to the formation of trihalomethanes, with potential carcinogenic effects.5,6
Fluorescence spectroscopy is a very promising, sensitive and useful technique for the study of environmental samples, like those containing humic substances. The potential utility of this technique for studying the structural and functional chemistry of humic materials is due to the presence of a variety of fluorescent structures present, specially in fulvic acids, which include condensed aromatic moieties bearing various functional groups and unsaturated aliphatic chains.7
In this work, the interactions of tropical aquatic fulvic acids (AFA) with chlorine and formation of trihalo-methanes were characterized by fluorescence spectroscopy. To this end, AFA from Itapanhaú Stream-Cubatão-SP,Brazil were extracted according the procedure recommended by the International Humic Substances Society (IHSS).
The photoluminescence measurements were done by using a Perkin Elmer spectrometer. The molecular size for a sample of AFA dealt with chlorine were analyzed by using a Biologic LP Biorad Chromatographic System. AFA samples treated and non-treated with chlorine were used and influence of reactions time and chlorine concentrations was investigated.
Experimental
Chemicals
All reagents used were high-purity grade, unless otherwise stated. Diluted acid and base solutions necessary for the aquatic HS isolation were prepared by convenient dilution of 30% (v/v) hydrochloric acid (suprapur, Merck AG) or sodium hydroxide monohydrate (suprapur Merck AG) dissolved in high-purity water (Milli-Q system, Millipore). The XAD 8 adsorbent (Serva Feinbiochemica), used for isolation of aquatic HS, was purified before use by successive soaking with 0.5 mol L-1 HCl, 0.5 mol L-1
NaOH and methanol p.a. (24 h each).
HS isolation by XAD 8 resin
The aquatic HS were isolated from a sample collected from a tributary stream of River Itapanhaú within of the State Park called “Serra do Mar”. This is an environmental protection area located in the seaboard, 7th UGRHI of 11th
group of UGRHI8 from São Paulo State,Brazil. For this
purpose, 50 L of surface water were filtered through 0.45 µm cellulose-based membranes and acidified with
concentrated HCl solution to pH 2.0. Afterwards, the aquatic HS from the acidified sample were isolated on the
XAD 8 collector9 following the recommendations of
Malcolm.10 After elution with 0.1 mol L-1 NaOH solution,
the obtained concentrate (4.5 mg mL-1 DOC equivalent to
9.0 mg mL-1 aquatic HS) was acidified to pH 2.0 with 6.0
mol L-1 HCl solution and the AFA (soluble fraction) were
separated of aquatic humic acid (AHA) by centrifugation at 12000 rpm (40 min). The determination of dissolved organic carbon (DOC) in the aquatic HS concentrate was carried out by catalytic combustion in an oxygen stream and subsequent IR detection by Analyser Schimadzu TOC 2000.11 Metal concentrations in the AHS were determined
by ICP-OES spectrometer.12 The studied aquatic HS
characteristics are summarized in Tables 1 and 2.
Fluorescence spectroscopy
The fluorescence spectra of AHS, AFA and AHA were obtained with a Perkin Elmer LS50B fluorescence spectrometer. The bi-directional way of excitation, emission and synchron scan with ∆λ = 20 and 50 nm and intervals of 10 nm were used. Measurements in different excitation wavelengths (320, 432, 450 and 520 nm) were performed, using AFA samples (8 m gL-1) treated and
non-treated with chlorine in different reaction times (1, 24, 48,
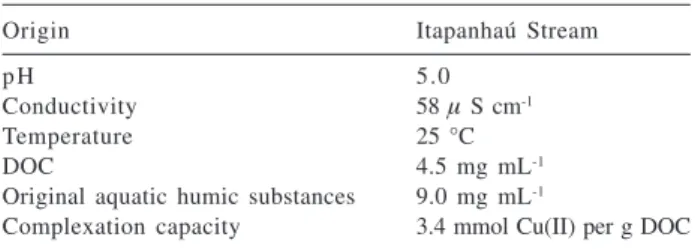
Table 1. Characteristics of humic substances from Itapanhaú Stream,
São Paulo State, Brazil
Origin Itapanhaú Stream
pH 5.0
Conductivity 58 µ S cm-1
Temperature 25 °C
DOC 4.5 mg mL-1
Original aquatic humic substances 9.0 mg mL-1
Complexation capacity 3.4 mmol Cu(II) per g DOC
Table 2. Metal concentrations as determined by ICP-OES in water
and in the aquatic humic substances isolated from Itapanhaú Stream-São Paulo State, Brazil (n=5)
Metals Concentration
Watera [µg L-1] Isolated HSb [mg L-1]
Cu 79.9 ± 0.6 20.2 ± 1.60
Co ≤ 0.5 (LD) 0.69 ± 0.04
Ni 11.6 ± 0.1 3.12 ± 0.24
Cd ≤ 0.25 (LD) 5.53 ± 0.42
M n 18.7 ± 0.1 4.71 ± 0.16
Hg ≤ 0.5 (LD) 0.04 ± 0.00
aTotal metals in the 0.45 µm membrane filtered original sample; bAfter isolation by the XAD 8 resin procedure (concentration 250x);
72 and 168 h) and chlorine concentrations (2.5, 5.0, 10.0 and 20.0 mg L-1).
Chromatographic system
A Biologic LP Biorad Chromatographic System was used. The chromatographic system was equipped with an UV-Vis detector; the wavelength was set at 280 nm. The size exclusion chromatograms obtained for a sample of AFA dealt with chlorine in a ratio: Cl2:AFA of 2:1. The size exclusion column packed with controlled pore glass (CPG), with 15.6 nm mean pore diameter, was calibrated using Blue Dextran.
Results and Discussion
The fluorescence properties of AFA are highly dependent on several characteristics, for example, origin and molecular weight, concentration, pH, ionic strength, temperature, and interaction with metal ions and organic chemicals.7 Then,
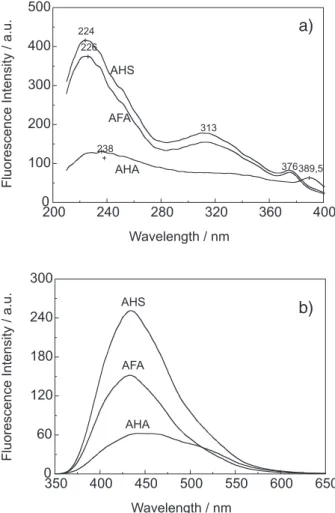
the fluorescent units of AFA can provide valuable information about structural characteristics and their interactions with organic chemicals as, for instance, chlorine. As a function of their structural differences, fluorescence spectra (Figure 1a) have different profiles. AHS and AFA excitation spectra showed peaks at 224, 313 and 376 nm, while AHA showed peaks at 238 and 390 nm. These fluorescence peaks are typical of humic and fulvic materials and aminoacids.13
The fluorescence emission spectra of humic substances consist of a broad band of overall intensity and a maximum-intensity wavelength varying according to the origin of the sample.7 Esteves and Duarte14 showed fluorescence
emission spectra as a single band with the maximum centered at near long wavelength (440 nm) for AFA from riverine, coastal, and open ocean fulvic acids.
The total fluorescence (TF), which is proportional to area under the emission spectrum, varied meaningfully for the three humic substances, where the fluorescence of AHS is 60% bigger than AHA and 40% than AFA. Maximum fluorescence wavelengths varied from 435, 433 and 466 nm to AHS, AFA and AHA samples respectively (Figure 1a). These wavelength values are within the range of aquatic humic substances.7 It was verified that the behavior of AHS
corresponds manly to AFA and when excited at 320 nm, AFA emission spectrum was more intense than AHA.
The fluorescence emission and excitation intensities decrease with increasing molecular weight. Several factors can contribute to the lower fluorescence intensity of the larger molecules. For example, the presence of heavy metals, such as the ones associated iron with an π-electron
system, can decrease the fluorescence intensity by enhancing the shift of energy from the singlet to the triplet state through intersystem crossing.15 On the other hand,
smaller molecules, (electron-donating groups, such as hydroxyl and methoxyl) can enhance fluorescence by increasing the transition probability between the singlet and ground states. Also, the increase in the maximum intensity of fluorescence, has been associated with the increasing content of C=O, aromatic C and COOH groups.16
The emission spectra of AHS and AFA samples (Figure 1b) are located in the blue region (435 and 433 nm), while AHA is broader shifted and in green region, in agreement with AHA structure, that is more humified than AFA.
The synchronous mode was chosen to obtain the best spectral information.17 Synchronous-scan excitation
spectra are obtained by measuring the fluorescence intensity scaning simultaneoly over both excitation and emission wavelengths keeping, between them, a constant wavelength difference, ∆λ = λem - λexc,.7
Figure 1. Fluorescence spectra of AHS, AFA and AHA samples: a)
The ratio of fluorescence intensity at 400 and 360 nm or at 470 and 360 nm ought to be a measure of the humification degree of the dissolved organic matter.18,19
Increasing ratios of fluorescence intensity indicate a higher humification degree. This result was also observed in the spectra of excitation synchronous scan (Figure 2), showing that the humification degree of AHA is higher compared to AFA and AHS.19
Typical synchronous fluorescence spectra of the AFA presents two peaks near at 360 and 400 nm, and a shoulder at around 470 nm.18 The river aquatic AHS and AFA showed
only one major peak at 398 nm (Figure 2). Senesi7 reported
synchronous fluorescence spectra with similar characteristics. The red shift of maximum emission wavelength and a smaller resonance of the molecule observed in the spectra of synchronous scan, of AHA compared to AFA, are due to an increasing number of highly substituted aromatic nuclei and/or conjugated unsaturated systems capable of a high degree of resonance.17
The C/N atomic ratio and humification index (400/360 and 470/360 nm) have been used to estimate the humification degree of the humic substances.19,20 These
parameters were calculated (Table 3) and the results confirm that AHA structure is more condensed than AFA structure, whereas that the C/N ratio was lower and humification index of AHA was higher than AFA and AHS.
The influence of chlorine on the fluorescence intensity as a function of time was obtained for AFA sample. It was observed that the reduction of fluorescence intensity is more significative at 360-400 nm and 480-600 nm. In the aquatic humic substances, the main fluorophores groups capable to absorb and to emit energy from the light are aromatic compounds.
Aromatic compounds with electron donating groups in the ring are the most highly reactive substrates in reactions of electrophilic substitution and oxidation.21
These types of reactions are typical for aquatic chlorination largely used for drinking water sterilization.
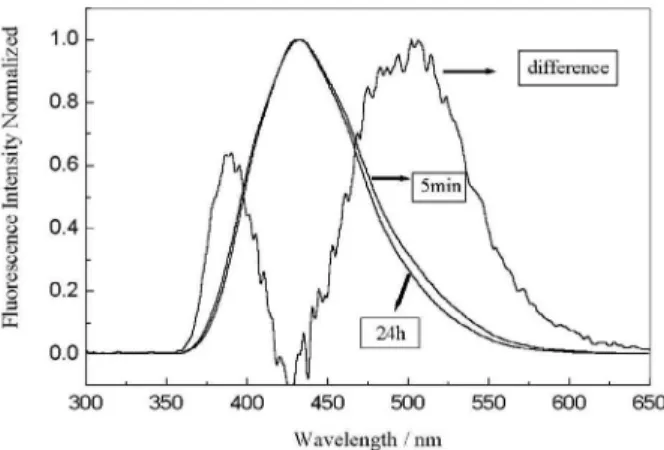
This behavior evidences the oxidation of AFA molecules and a main reactive process to some molecular groups, as it shows the difference between the spectra in a couple of time intervals of the reaction (Figure 3).
The intensity of fluorescence after 24 h of reaction is very low and in the Figure 3 is used a normalization of spectrum to observe qualitative changes. In the difference spectrum (Figure 3), which correspond the subtraction of spectra after 5 min and 24 h, it was observed that only some fluorophores, presented in the region at high and low wavelengths were affected in the reaction with chlorine, with decrease of fluorescence emission. One intermediate region tends to zero between 400 and 450 nm, and that apparently resists to the reaction with chlorine.
It has also been proposed that the energy transfer inside the polymeric molecules may affect the fluorescent decay
Table 3. Humification indexes (400/360 and 470/360 nm) and
pa-rameters from elemental analysis obtained AHS, AFA and AHA samples
Sample Ratio
400/360a 470/360b C/Nc
AHS 0.15 0.57 21.10
AFA 0.11 0.48 21.34
AHA 0.75 0.88 19.24
a Ratio of relative fluorescence intensity (synchronous mode) (400/
360nm); b Ratio of relative fluorescence intensity (synchronous
mode) (470/360nm); cC/N atomic ratio.
Figure 3. Normalized emission spectra of AFA (8 mg L-1) in the
presence of chlorine (2.5 mg L-1), for 5 min and 24 h with excitation
at 320 nm, and the difference spectra between them.
Figure 2. Synchronous fluorescence spectra of AHS, AFA and AHA
characteristics of humic substances.22 In large HS molecules,
intrafluorophore energy transfer shortens the apparent decay lifetimes of the fluorophores. In smaller molecules, this channel of the excitation energy dissipation may be weakened and the lifetimes of the fluorophores increase. Since chlorination decreases the size of the AFA molecule and destroys some of the aromatic chromophores involved in the energy transfer, the decrease of fluorescence intensity in chlorinated AFA correlates well with this hypothesis.21
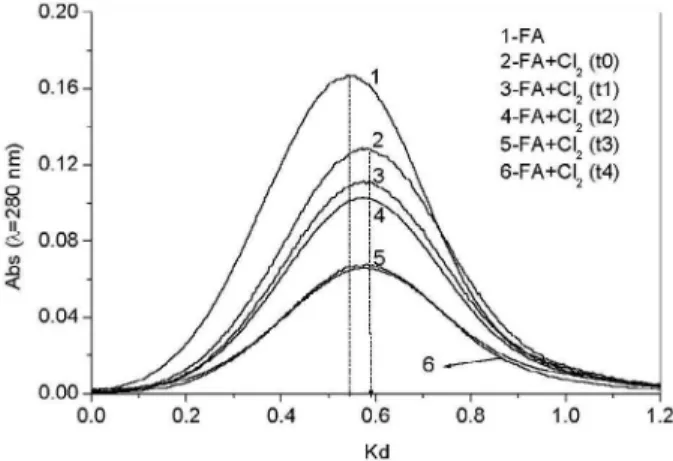
Figure 4 shows size exclusion chromatograms obtained for a sample of AFA dealt with chlorine in a ratio: Cl2:AFA of 2:1. These chromatograms showed only one chromato-graphic peak with Kd (distribution coefficient) of approximately 0.6. After 5 min from the beginning of the reaction, a shift of chromatographic peak from Kd 0.5 (AFA sample) to 0.6 (AFA + chlorine) was observed. This shift indicates a reduction of the apparent molecular size of the AFA reacting with chlorine, that can be associated with possible reduction of aromatic compound contents. Other shifts of the chromatographic peak during the absorbance decrease, as function of the time of reaction, were not observed.
Conclusions
In analyzed aquatic humic substances, characteristic fulvic acids were predominant. The humification degree obtained from fluorescence spectra, were higher in the AHA fraction when compared to AFA fraction and AHS. The relative emission fluorescence intensity for the samples was significantly decreased with the increase of chlorine concentration and reaction time. Probably a reaction between added chlorine and AHS fluorophores is occurring. In the interaction between AFA and chlorine, the
excitation was selective, because it was more resonant only at high and low wavelengths. Reduction of fluorescence intensity of AFA samples after reaction with chlorine in the region of longer wavelength can be probably associated with selective interaction between aromatic structures of AFA and chlorine. This selective interaction probably contributes for the formation of the intermediates as trihalomethanes. Combined data of fluorescence and size exclusion chromatography suggested that AFA molecules, after reaction with chlorine, presents a decrease of the apparent molecular size.
Acknowledgements
The authors are grateful to FAPESP (fellowships to E.R.C., project 99/10565-6), PADCT/CNPq (project 620324/98-8) and Embrapa for the financial support.
References
1. Bruchet, A.; Anselme, C.; Duguet, J.P.; Mallevialle, J. In Aquatic Humic Substances: Influence on Fate and Treatment of Pollutants; Suffet, I.H.; MacCarthy, P., eds.; American Chemical Society: Washington, 1989, p. 93.
2. Buffle, J.; Complexation Reactions in Aquatic Systems: An Analytical Approach, Ellis Horwood: New York, 1990. 3. Rocha, J.C.; Sargentini Jr, É.; Toscano, I.A.S.; Rosa, A.H.;
Burba, P.; J. Braz. Chem. Soc.1999, 10, 169.
4. Piccolo, A. In Humic Substances Versatile Components of Plants, Soil and Water; Ghabbour, E.A.; Davies, G., eds.; Royal Society of Chemistry: Cornwall, 2000, p. 111. 5. Suffet, I.H.; MacCarthy, P.; Aquatic Humic Substances:
Influence on Fate and Treatment of Pollutants, American Chemical Society: Washington, 1989.
6. Korhin, G.V.; Benjamin, M.M.; Xiao, H.; Acta Hydrochim. Hydrobiol. 2001, 28, 378.
7. Senesi, N.; Anal. Chim. Acta1990, 232, 77.
8.Relatório de Qualidade das Águas Interiores do Estado de São Paulo; CETESB; São Paulo, 1996 (http:// www.cetesb.sp.gov.br/Agua/agua_geral.asp, Acessed at October 29,2003.
9. Aiken, G.R. In Humic Substances in Soil, Sediment and Water: Geochemistry, Isolation and Characterization; Aiken, G.R.; MacKnight, D.M.; Wershaw, R.L.; MacCarthy, P., eds.; John Wiley & Sons: New York, 1985, p. 363.
10. Malcolm, R.L. In Humic Substances in the Aquatic and Terrestrial Environment; Allard, B.; Boren H.; Grimvall, A., eds.; Springer-Verlag: Berlim, 1989, p. 9.
11. Wangersky, P.J.; Mar. Chem.1993, 41, 61.
12. Rosa, A.H.; Rocha, J.C.; Burba, P.; Talanta2002, 58, 969. 13. Baker, A.; Genty, D.; J. Hydrol.1999, 217, 19.
Figure 4. Size-exclusion chromatograms of AFA sample in the
14. Esteves, V.I.; Duarte, A.C.; Acta Hydrochim. Hydrobiol. 2001,
28, 359.
15. Hercules, D.M.; Fluorescence and Phosphorescence Analysis: Principles and Applications, Interscience: New York, 1962. 16. Spark, K.M.; Swift, R.S. In Humic Substances in the Global
Environment and Implications on Human Health; Senesi, N.; Miano, T., eds.; Elsevier: Amsterdam, 1994, p. 153. 17. Miano, T.M.; Senesi, N.; Sci. Total Environ. 1992, 118, 41. 18. Kalbitz, K.; Geyer, W.; Geyer, S.; Biogeochem.1999, 47,
219.
19. Kalbitz, K.; Geyer, S.; Geyer, W.; Chemosphere2000, 40, 1305.
20. Rocha, J.C.; Rosa, A.H.; Furlan, M.; J. Braz. Chem. Soc.1998,
9, 51.
21. Korshin, G.V.; Kumke, M.U.; Li, C.W.; Frimmel, F.H.; Environ. Sci. Technol.1999, 33, 1207.
22. Kumke, M.U.; Abbt-Braun, G.; Frimmel, F.H.; Acta Hydrochim. Hydrobiol. 1998, 26, 73.
Received: March 10, 2003 Published on the web: May 10, 2004