Films of Poly (L - Lactic Acid) /
Poly(Hydroxybutyrate-co-Hydroxyvalerate) Blends:
In vitro
Degradation
B.M.P. Ferreiraa, C.A.C. Zavagliab, E.A.R.Duekb*
a
Departamento de Engenharia de Materiais, Faculdade de Engenharia Mecânica, Universidade Estadual de Campinas, C.P. 6122 13083-970 Campinas - SP, Brazil
b
Centro de Ciências Médicas e Biológicas,
Pontifícia Universidade Católica de São Paulo, 18030-230 Sorocaba - SP, Brazil
Received: November 16, 2000; Revised: January 18, 2001
Biocompatible and biodegradable polymers have been studied in the last few years with good clinical success in the fixation and stabilization of bone fractures. The understanding and the control of the polymeric prosthetic degradation process and the effect of its degradation products in the organism are crucial for the success of the implant. In this present work, blends of PLLA/PHBV, obtained in several compositions by casting of solvent, obtaining samples in the form of films. The samples were characterized by the analysis of TGA, DSC, DMA and SEM. The results obtained showed that the PLLA/PHBV blends are immiscible, and present a discrete separation by micros-copy. The blends obtained showed porous fracture surfaces. It is noticed that PLLA begins its degradation in a few weeks (around 2 weeks), unlike PHBV, where it was possible to observe eventual degradation up to 53 weeks. It was also observed that the blend increased its crystallinity with degradation.
Keywords: Poly(L-lactic acid), Poly(hydroxybutyrate-co-hydroxyvalerate), blends, in vitrodegradation
1. Introduction
Poly(α-hydroxy esters) such as poly(L-lactic acid) (PLLA), poly(glycolic acid) (PGA) and poly(DL- lactic -co- glycolic acid) (PLGA) are currently being investigated as materials for the regeneration of several tissues including cartilage, bone, liver and intestine1.
Poly(α-hydroxy esters) decompose by bulk degrada-tion. The first measurable event that occurs during bulk degradation is the loss of strength because molecular weight decreases. The polymer chains are soluble in the extracellular fluid when the molecular weight is below 7000. At this time the material has little strength and the polymer begins to fragment due to local mechanical stresses1.
When the degradation process produces particles of approximately 20µm, multinucleated cells or macrophages can phagocytose them. Those particles that are not phago-cytosed continue to degrade and decrease in size. As lactic
and glycolic acid are released, there is a danger of a local decrease in the pH if the area is not well vascularized1.
The reabsorbable fixation device eliminates the need to remove the osteosynthetic materials by surgery, after the fracture has healed. The polymeric prosthesis must have the following properties: appropriate chemical and physical structures to satisfy the desirable useful lifetime in the body; absence of contaminant substance and possibility of being sterilized. Moreover, the polymer must not induce tumor formation, thrombus formation or inflammation in the surrounding tissues. All these requirements greatly reduce the number of polymers, which are potential candi-dates for biomedical applications2.
There are many situations in which ostensibly inert polymers are used for the construction of prostheses and implanted in body tissues where it is intended that they remain for a considerable period of time. However, it frequently happens that these polymers are, in practice, slightly degraded by the physiological environment. An understanding of this phenomenon is of great importance
e-mail: [email protected]
because the fact that the biocompatibility and functionality of the implant may be compromised3.
In biomedical applications, environmental stability tends to be particularly important in three areas: processing, sterilization and long term implantation. Degradation dur-ing processdur-ing is primarily thermal, radiative, or hydrolytic, depending upon the sterilization technique used. In the physiological environment, the only feasible degradation mechanisms are hydrolysis and oxidation. For hydrolysis to occur the polymer must contain hydrolytically unstable bonds and show some degree of hydrophilicity. For hy-drolysis to occur "in vivo" a further constraint is applied, that the reaction should proceed at a pH value around 7.4 and at a temperature of 37 °C. In vivo degradation of polymers is also complicated by the possible involvement of agents as enzymes3.
Current degradable polymers such as polylactic acid and polyglycolic acid may not be universally suitable for use in orthopedics, due to the nature of their degradation pattern. A newly developed naturally occurring polymer of hydroxybutyric acid or polyhydroxybutyrate (PHB) is showing great promise, due to its long term degradation profile at high molecular weights4,5.
The degradation of PHB is strongly influenced by pH and the pH effects must be determined if the material is to be used in the body, because relatively large localized pH changes occur which could alter the degradation profile of the material. Another critical factor of this material is that the analysis of the molecular weight shows a bimodal distribution, which gives rise to a complex degradation pattern4.
Implantation of a material will cause many responses, which will result in very rapid surface changes, due to the absorption of various cellular and/or proteinaceous materi-als on the implant surface. This absorption process on the polymer surface is mediated by the physic-chemical status of the implant surface4,6.
Blends exhibit advantageous physical and mechanical properties that each individual polymer does not have. Depending on the thermodynamic compatibility of the two chosen polymers, phase-separated polymers can be ob-tained, imposing different morphologies and matrix char-acteristics7,8.
Polymer blends with both semi-crystalline components are more complex. They forge a new way for the study of the relationships between the behavior of the phases and the development of the structure in polymer mixtures. The formation and morphology of the semicrystalline/semi-crystalline state that involves the crystallization of different polymers, each one in a specific temperature9, is of great interest.
The properties of the blends depend mainly on thermo-dynamic miscibility. If the polymers are immiscible, the properties will depend not only on the properties of each
component, but also on the morphology and adhesion be-tween the phases10.
The aim of this work is to study the "in vitro" degrada-tion of the PLLA/PHBV blend in different composidegrada-tions and to analyze their behavior relative to the hydrolytic degradation.
2. Experimental
Poly(L-lactic acid), molecular weight Mw = 100.000 (Medisorb - Dupont), and poly(3-hydroxybutyrate-co-3-hydroxyvalerate), with 12% of hydroxyvalerate (Aldrich), were used in this research. Methylene chloride (Synth) was employed as solvent.
2.1. Blend preparation
The blends PLLA/PHBV were prepared by dissolving the polymer separately in methylene chloride (5% W/V) under stirring for approximately one hour. The final com-position of PLLA/PHBV blends were 100/0, 60/40, 40/60 and 0/100 (W/W), which were stirred for one hour for complete homogenization. The PLLA/PHBV mixture was poured onto a glass plate. The glass plate containing the blend in solution was placed in a glass box to dry and saturated with vapor from the solvent (approximately 20 mL). After evaporation of the solvent, membranes, ap-proximately 0.14 mm thick, were obtained. The membranes were maintained under vacuum, following the drying phase.
2.2.In vitrodegradation
Films were immersed in glass tubes containing phos-phate buffer solution (pH = 7.4), for specific periods (1, 4, 8, 12, 16, 24, 36 and 53 weeks). After each period of degradation, the samples were removed, washed with dis-tilled water for four hours and vacuum dried for 48 hours. Samples were characterized by Thermogravimetric Analy-sis (TGA), Differential Scanning Calorimetry (DSC), Dy-namic Mechanical Analysis (DMA) and Scanning Electron Microscopy (SEM).
2.3. Thermogravimetic analysis (TGA)
The TGA analysis was carried out in a STA 409C of NETZSCH - Gerätebau GmbH Thermal Analysis. The samples were heated from the room temperature up to 400 °C at a heating rate of 10 °C/min under helium atmos-phere.
2.4. Differential scanning calorimetry (DSC)
complete melting, eliminating the thermal history of the samples. They were then cooled to -20 °C for 5 min and heated again to 200 °C. The melting temperatures of the two phases and the enthalpy associated with the melting and/or crystallization process were determined.
2.5. Dynamic mechanical analysis (DMA)
Dynamic mechanical analysis were performed using a NETZSCH - Dynamic Mechanical Analysis - 242. The samples were cooled to -25 °C and soon after heated up to 200 °C, with a heating rate of 5 °C/min, under air, with a maximal force of 1N, frequency of 1 Hz and width of 15
µm using a tension system.
2.6. Scanning electron microscopy (SEM)
A JEOL’S electronic microscope JXA 840A (tension of 10 to 20 kV) was used to observe the upper surfaces, which were coated with a thin layer of gold, using a Sputer Coater BAL-TEC SCD 050.
3. Results and Discussion
3.1. Thermogravimetric analysis (TGA)
Degradation temperatures for the blends, obtained by TGA curves are shown in Table 1. Thermal degradation of the samples can be observed in relation to the degradation timein vitro, from 0 to 53 weeks. Clear degradation was observed for the pure PLLA, at approximately 50 °C, comparing the values of temperature peaks between 0 and 53 weeks, but this behavior is less intense for the blends PLLA/PHBV 60/40 and 40/60. Pure PHBV did not present a significant variation until 53 weeks. These results show that the thermal stability of these blends is dependent on the PLLA proportion in the blend11.
3.2. Differential scanning calorimetry (DSC)
DSC curves, Figs. 1 to 4, show the behavior of the blends during hydrolytic degradation. The pure polymers and the blends are characterized by a melting peak, glass transition temperature and crystallization peak, typical of semi-crystalline polymers. The crystallization peak and the glass transition temperature (Tg) for PHBV are verified only on the second heating. The values can be found in Tables 2 to 5.
After degradation the glass transition temperature (Tg) became more difficult to be observed in the first heating. Data of glass transition temperatures (Tg) were observed for the blends in the first or second heating. A decrease of Tgvalues, in the second heating, for pure PLLA, in relation to the degradation time, was observed. In the case of 60/40 and 40/60 blends, there was an increase of Tgof PLLA. This can be explained by the high crystallinity degree of PHBV, decreasing the mobility of the PLLA chains in these com-positions. It is not possible to observe the Tgfor the PLLA
in the 60/40 and 40/60 blends in the second heating, because they are overlaid by the crystallization peak of PHBV. Tg values of PHBV decrease in the blends, but the same does not occur for the pure PHBV, because the PHBV is very resistant to the hydrolytic degradation, so after degradation of PLLA the amorphous parts of PHBV acquire more mobility, decreasing Tg.
Up to 12 weeks of degradation, the melting temperature (Tm) did not present significant variation (140-160 °C for PHBV and 175 °C for PLLA). Moreover, after 12 weeks the Tmfor PLLA decreased for the 100/0, 60/40 and 40/60 blends, especially for the pure PLLA, (Tables 2, 3 and 4). This occur because the degradation process of PLLA has as consequence the formation of new crystals, which can be melted with lower energy and temperature. Tmvalues of PHBV showed a discreet decrease in the blends, however the same did not occur for pure PHBV, (Table 5).
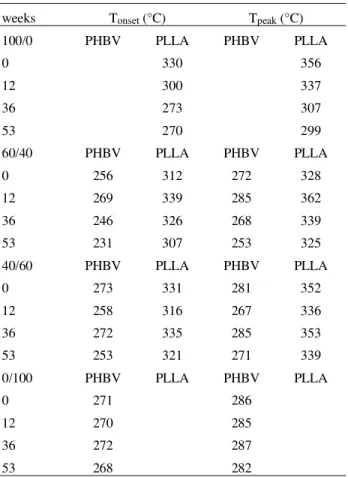
A notable characteristic in the curves of DSC, obtained in this study, is the crystallization temperature of the poly-mers (Tc). The Tcof the blends showed a strong approach-ing tendency in relation to degradation period, (Tables 2 and 3). This can be explained by the fact that the degrada-Table 1.Values of Initial Temperature of mass loss (Tonset) and Tempera-ture of maximum mass loss (Tpeak) for the PLLA/PHBV blends obtained by TGA, in different compositions of the blends in relation to degradation period (weeks).
weeks Tonset(°C) Tpeak(°C)
100/0 PHBV PLLA PHBV PLLA
0 330 356
12 300 337
36 273 307
53 270 299
60/40 PHBV PLLA PHBV PLLA
0 256 312 272 328
12 269 339 285 362
36 246 326 268 339
53 231 307 253 325
40/60 PHBV PLLA PHBV PLLA
0 273 331 281 352
12 258 316 267 336
36 272 335 285 353
53 253 321 271 339
0/100 PHBV PLLA PHBV PLLA
0 271 286
12 270 285
36 272 287
tion of amorphous part of PLLA promote mobility of the chains allowing the crystallization at the lower temperature. On the other hand the crystallization of PHBV is affected by the degradation process of PLLA.
It can also be noticed that the crystallization enthalpy (∆Hc) of PLLA increased with the degradation of the blends, Table 2. This increase has been greatly discussed in literature12. Many authors consider that this is due to the
Figure 1. DSC curves for PLLA/PHBV 100/0 blends submitted to different hydrolytic degradation periods, first heating (a, c, e) for 0, 36 and 53 weeks, respectively and second heating (b, d, f) for 0, 36 and 53 weeks, respectively.
Figure 2. DSC curves for PLLA/PHBV 60/40 blends submitted to different hydrolytic degradation periods, first heating (a, c, e) for 0, 36 and 53 weeks, respectively and second heating (b, d, f) for 0, 36 and 53 weeks, respectively.
Figure 4. DSC curves for PLLA/PHBV 0/100 blends submitted to different hydrolytic degradation periods, first heating (a, c, e) for 0, 36 and 53 weeks, respectively and second heating (b, d, f) for 0, 36 and 53 weeks, respectively.
rearrangement of small chains generated by the degradation process itself, forming new crystals; others consider that the degradation of the amorphous regions of the polymers just results in an increase of the remaining crystalline
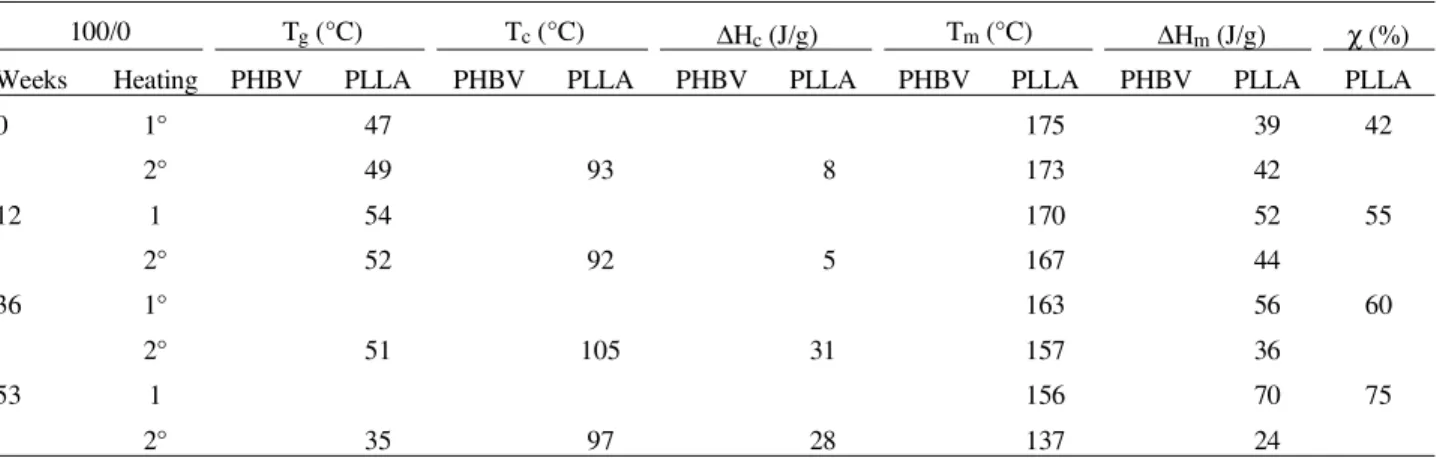
regions12. The authors believe that a rearrangement of the crystals is occurring, because the degradation of PLLA results an increase of crystallization temperature of PHBV, approaching the crystallization peaks of the polymers. This Table 2.Glass Transition (Tg), Crystallization (Tc) and Melting (Tm) Temperatures; Crystallization (∆Hc) and Melting (∆Hm) Enthalpies; Crystallinity Degree (χ) obtained by DSC, for films of PLLA/PHBV 100/0 blends in relation to degradation period (weeks).
100/0 Tg(°C) Tc(°C) ∆Hc(J/g) Tm(°C) ∆Hm(J/g) χ(%)
Weeks Heating PHBV PLLA PHBV PLLA PHBV PLLA PHBV PLLA PHBV PLLA PLLA
0 1° 47 175 39 42
2° 49 93 8 173 42
12 1 54 170 52 55
2° 52 92 5 167 44
36 1° 163 56 60
2° 51 105 31 157 36
53 1 156 70 75
2° 35 97 28 137 24
Table 3.Glass Transition (Tg), Crystallization (Tc) and Melting (Tm) Temperatures; Crystallization (∆Hc) and Melting (∆Hm) Enthalpies; Crystallinity Degree (χ) obtained by DSC, for films of PLLA/PHBV 60/40 blends in relation to degradation period (weeks).
60/40 Tg(°C) Tc(°C) ∆Hc(J/g) Tm(°C) ∆Hm(J/g) χ(%)
Weeks Heating PHBV PLLA PHBV PLLA PHBV PLLA PHBV PLLA PHBV PLLA PLLA
0 1° 48 158 175 6 19 34
2° -1 60 95 9 15 138-158 175 13 27
12 1 67 163 176 5 19 34
2° 1 67 90 7 10 140-158 176 14 27
36 1° 69 162 173 2 12 21
2° -6 73 27 147 168 10 24
53 1 163 172 3 7 12
2° 70 10 158 21
Table 4.Glass Transition (Tg), Crystallization (Tc) and Melting (Tm) Temperatures; Crystallization (∆Hc) and Melting (∆Hm) Enthalpies; Crystallinity Degree (χ) obtained by DSC, for films of PLLA/PHBV 40/60 blends in relation to degradation period (weeks).
40/60 Tg(°C) Tc(°C) ∆Hc(J/g) Tm(°C) ∆Hm(J/g) χ(%)
Weeks Heating PHBV PLLA PHBV PLLA PHBV PLLA PHBV PLLA PHBV PLLA PLLA
0 1° 52 160 175 11 10 27
2° 53 93 9 8 157 175 25 14
12 1 66 163 176 11 10 27
2° 2 66 97 15 7 142-161 177 18 14
36 1° 71 162 174 9 10 27
2° 1 63 85 17 4 138-158 174 20 13
53 1 163 173 6 5 13
fact is discussed by Penning and collaborators9. The authors suggest the occurrence of co-crystallization of the system.
A priori, the method used to obtain the films allowed a complete crystallization, so the thermograms do not present Tcin the first heating. However, in the second heating the crystallization enthalpy (∆Hc) occurred, due to the fact that the cooling rate was fast enough hindering the complete crystallization12.
Another point to be observed is that the PLLA suffers more intense hydrolytic degradation, because it was the polymer that demonstrated larger alteration in its thermal properties. Holland and collaborators show that PHBV (with 12% of HV) begins its mass loss, at pH 7.4, around 25 days, but at 70 °C. The same occurs at 37 °C, but with pH 10.6. It also showed that PHBV did not suffer mass loss until 120 days (pH 7.4 at 37 °C)13. In this study, changes in the thermal properties of pure PHBV were observed only after being submitted to a degradation process for 53 weeks. Using the melting enthalpy, and calculated melting enthalpy of PLLA, considering the polymer 100% crystal-line (93.7 J/g)14, it was possible to obtain the crystallinity degree (χ%) of PLLA in the blend
χ = ∆Hm ∆H0 m
x 100
where:∆Hm= experimental melting enthalpy [J/g] and∆Hm ° = 93.7 J/g14.
The values of∆Hmobtained from the analysis of DSC were recalculated considering the composition of the poly-mer in the blend. Values obtained for the crystallinity degree are in Tables 2 to 4. An increase of the crystallinity degree for pure PLLA in relation to the degradation time can be observed. This increase became the samples more brittle, decreasing their mechanical properties. On the other hand, the crystallinity degree of PLLA decreased in
PLLA/PHBV 60/40 and 40/60 blends. This can suggest that the presence of PHBV in the blend hinders the crystal-lization of PLLA.
3.3. Dynamic mechanical analysis (DMA)
Table 6 shows the values obtained for the PLLA/PHBV blends in different compositions and submitted to different degradation periods. Pure PLLA presented a fast loss of mechanical properties due to the degradation process. After one week in a phosphate buffer solution, it was not possible to analyze the samples by DMA, however the increase of PHBV in the blend improved the mechanical properties. For pure PHBV it was possible to carry out all the analysis up to 36 weeks under degradation conditions.
Table 6 shows two glass transition temperature values for the blends from Loss Modulus (E’’) and damping (tanδ). Comparing Tg values obtained before degradation for pure polymers and blends, it is possible verify a minimal variation among these values. As verified in DSC data, this suggests the immiscibility of blends components.
The Tg values for the 60/40 and 40/60 blends increased in relation to degradation. This increase was more intense for a higher level of PHBV in the blend. As already dis-cussed before, this increase can be due to the fact that the presence of PHBV decreases mobility of the PLLA chains. It is possible to observe, by DMA analysis (Figs. 5, 6 and 7), a variation in the crystallization of the samples by storage modulus curves (E’). According to literature15, when the sample becomes more crystalline, the absolute value of the storage modulus (E’) increases and the peak of the tan δ decreases. This behavior was observed for the blends in this study.
3.4. Analysis of scanning electron microscopy (SEM)
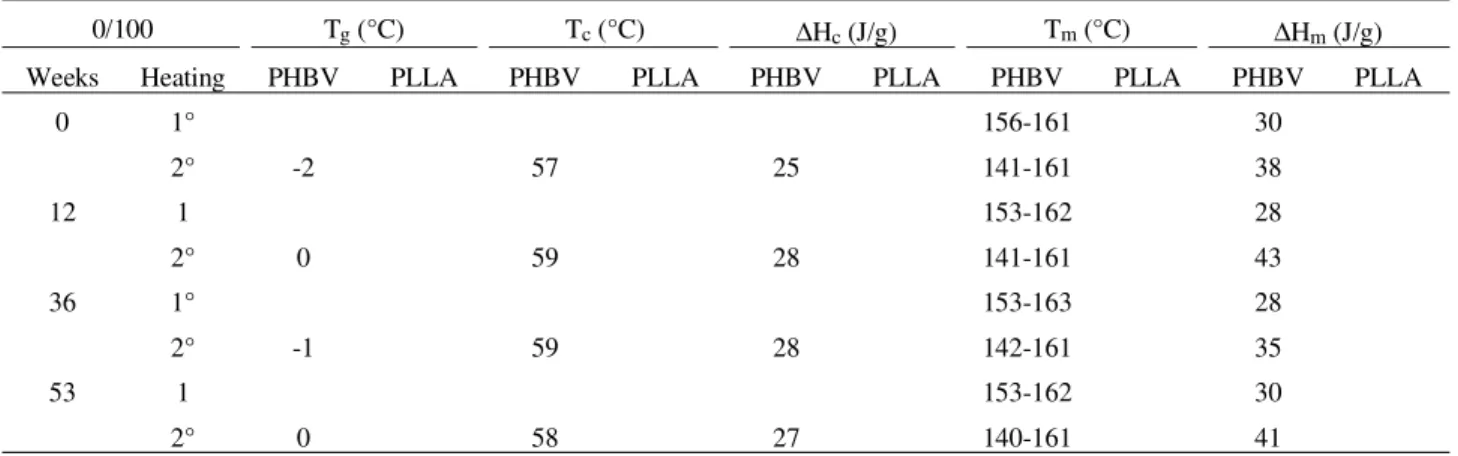
In spite of the great loss of mechanical properties of the blends, which making the samples into very small fragile fragments in a short time (12 weeks) of immersion in Table 5.Glass Transition (Tg), Crystallization (Tc) and Melting (Tm) Temperatures; Crystallization (∆Hc) and Melting (∆Hm) Enthalpies; obtained by DSC, for films of PLLA/PHBV 0/100 blends in relation to degradation period (weeks).
0/100 Tg(°C) Tc(°C) ∆Hc(J/g) Tm(°C) ∆Hm(J/g)
Weeks Heating PHBV PLLA PHBV PLLA PHBV PLLA PHBV PLLA PHBV PLLA
0 1° 156-161 30
2° -2 57 25 141-161 38
12 1 153-162 28
2° 0 59 28 141-161 43
36 1° 153-163 28
2° -1 59 28 142-161 35
53 1 153-162 30
phosphate buffer solution, it was not possible to observe, by microscopy, evident degradation during this period.
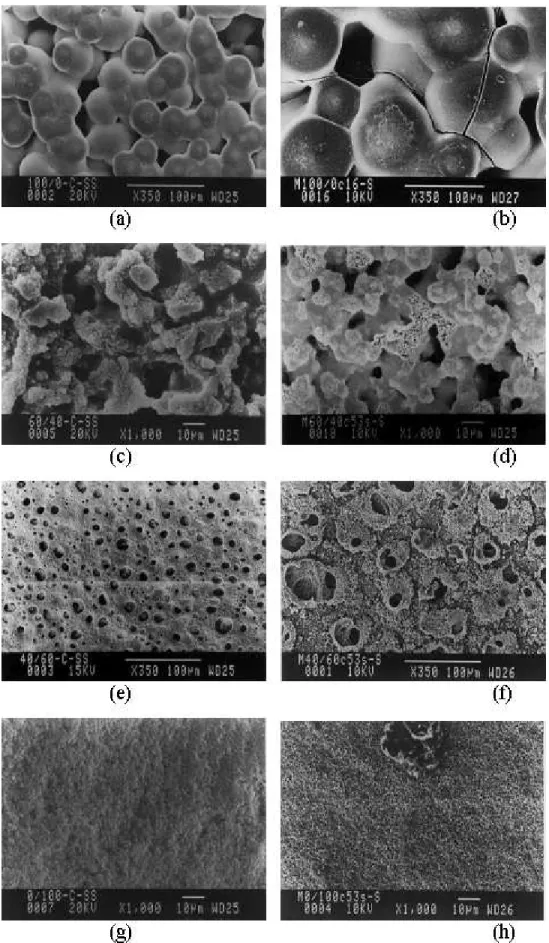
Figure 8 shows micrographs of blends in different com-positions for degraded and non-degraded blends. It can be observed that the blends showed a porous morphology on the upper surface, except for pure PHBV, and the distribu-tion of the porous increased with the increase of the PLLA concentration.
Observing non-degraded 60/40 and 40/60 blends, (Figs. 8c and 8e), it is possible to verify a discrete phase separa-tion, as verified by Iannace and colaborators8.
PLLA/PHBV 100/0 blends began to present some sig-nals of degradation after 8 weeks and this was more intense after 16 weeks, (Fig. 8b). At larger periods of time it was
Figure 6. DMA curves for PLLA/PHBV 40/60 blends in relation to degradation periods 0, 4, 16 weeks.
Figure 7. DMA curves for PLLA/PHBV 0/100 blends in relation to degradation periods 0, 24, 36 weeks.
Figure 5.DMA curves for PLLA/PHBV 60/40 blends in relation to degradation periods 0, 2, 4 weeks.
Table 6.Glass Transition Temperatures (Tg) obtained by DMA, on the curves of Loss Modulus (E’’) anddamping(tan δ), for the blends in different compositions and degradation period (weeks).
PLLA/PHBV Tg(°C) - E’’ Tg(°C) - tanδ
Weeks PHBV PLLA PHBV PLLA
100/0
0 64 75
1 67 77
60/40
0 18 66 26 81
1 13 72 17 85
2 14 76 18 87
4 16 79 19 90
40/60
0 9 67 16
-2 13 77 20
-4 13 80 19
-12 16 78 21
-16 19 84 24
-0/100
0 10 17
2 12 18
4 11 18
12 8 15
16 16 22
24 17 23
not possible to prepare the samples for microscopy analy-sis, due to their fragility.
Figures 8d and 8f show the upper surfaces of blends 60/40 and 40/60, respectively. A clear degradation process, after 53 weeks compared to samples without degradation, can be observed, (Figs. 8c and 8e). For PHBV, Fig. 8h, discrete signals of degradation up to 53 weeks were noticed.
4. Conclusion
Thermogravimetric analysis (TGA) data showed that the initial temperature of loss mass (Tonset) for pure PLLA decreased with degradation time. The same occurred for PLLA/PHBV 60/40 and 40/60 blends, but with lower in-tensity. For pure PHBV the Tonsetdid not vary.
Differential scanning calorimetry (DSC) data showed the presence of two glass transition temperatures for the PLLA/PHBV 60/40 and 40/60 blends, and crystallization at different temperatures. Moreover, crystallization tem-perature values showed a strong approaching tendency in relation to degradation time. The crystallinity degree for pure PLLA increased, but for the PLLA/PHBV 60/40 and 40/60 blends, it decreased in relation to degradation time. It can be attribute to the presence of PHBV in the blend hindered the crystallization of PLLA. The increase in the crystallinity degree of pure PLLA became the films brittle. In the dynamic mechanical analysis (DMA) the immis-cibility of the blends, can be observed, confirming DSC data.
Using scanning electron microscopy it can be observed a porous morphology for upper surface of the blends, except for pure PHBV. The blends showed a discrete phase separation. All the blends showed signals of degradation after immersion in a phosphate buffer solution, and this intensity increased with the increase of PLLA in the blends.
Acknowledgments
The authors are grateful to FAPESP (proc. 97/14275-7 and 97/06268-0) and FINEP/Pronex for financial support of this work.
References
1. Wake, M.C. et al. Effects of biodegradable polymer particles on rat marrow-derived stromal osteoblastsin vitro.Biomaterials, v. 19, p. 1255-1268, 1998. 2. Grimaldi, M. et al. Reactive processing-property
rela-tionships in biodegradable blends useful goes prosthe-sis application.Journal of Materials Science, v. 31, p.6155-6162, 1996.
3.Rehman, I.; Andrews, E.H.; Smith, R.In vitro degra-dation of poly(esther-urethanes) it goes biomedical applications.Journal of Materials Science: Material in Medicine, v. 7, p. 17-20, 1996.
4.Knowles, J.C.; Hastings, G.W.In vitrodegradation of PHB/PHV copolymer and the new technique goes monitoring early surface changes.Biomaterials, v. 12, p. 210-214, 1991.
5.Blümm, E.; Owen, A.J. Miscibility, crystallization and melting of poly(3-hydroxybutyrate)/poly(L-lac-tide) blends. Polymer, v. 36, n. 21, p. 4077-4081, 1995.
6.Zhang, L.; Xiong, C.; Deng, X. Biodegradable poly-esters blends goes biomedical apllication.Journal of Applied Polymer Science, v. 56, p. 103-112, 1995. 7.Park, T.G.; Cohen, S. Langer, R. Poly(L-lactic
acid)/Pluronic blends: characterization of phase sepa-ration behavior, degradation, and morphology and uses the protein-releasing matrices.Macromolecules, v. 25, p. 116-122, 1992.
8.Iannace, S.; Ambrosio, L.; Huang, S.J.; Nicolais, L. Poly(3-hydroxybutyrate)-co-(3-hydroxyvalerate)/Po ly-L-lactide blends: thermal and mechanical proper-ties, Journal of Applied Polymer Science, v. 54, p. 1525-1536, 1994.
9.Penning, J.P.; Manley, R.St.J. Miscible blends of two crystalline polymers. 2. Crystallization kinetics and morphology in blends of poly(vinylidene fluoride) and poly(1,4-butylene adipate). Macromolecules, v. 29, p. 84-90, 1996.
10.Ultracki, L.A.Polymer, Alloys and Blends. Thermo-dynamics and Rheology. Ed. Hanser, New York, 1989. 11.Turi, E.A.Thermal characterization of polymeric
ma-terials. Ed. Academic Press, Inc., London, 1981. 12.Duek, E.A.R.; Zavaglia, C.A.C.; Belangero, W.D.In
vitrostudy of poly(lactic acid) pin degradation. Poly-mer, v. 40, p. 6465-6473, 1999.
13.Holland, S.J.; Yasin, M.; Tighe, B.J. Polymers goes biodegradable medical devices. VII. Hydroxy-butyrate-hydroxyvalerate copolymers: degradation of copolymers and their blends with polysaccharides un-derin vitrophysiological conditions.Biomaterials, v. 11, p. 208-215, 1990.
14.Fisher, E.W.; Sterzel, H.J.; Wegner, G. Investigation of the structure of solution grown crystals of lactide copolymers by means of chemical reactions. Kolloid-Z Kolloid-Z Polymere. v. 251, p. 980-990, 1973.
15.Nielsen, L.E.Mechanical Properties of Polymers and Composites, Marcel Dekker, N.Y., v. 1, 1974.