*e-mail: [email protected]
Trabalho apresentado no I Simpósio Mineiro de Ciências dos Materiais, Ouro Preto, Novembro de 2001.
Tailoring Activated Carbon by Surface Chemical Modification
with O, S, and N Containing Molecules
Rachel RibeiroVieira Azzi Rios, Dênio Eduardo Alves, Ilza Dalmázio, Sílvio Fernando
Vargas Bento, Claudio Luis Donnici, Rochel Monteiro Lago*
Dep. Química, ICEx, UFMG, 31270-901 Belo Horizonte - MG, Brazil
Received: November 11, 2001; Revised: March 24, 2003
In this work the surface of activated carbon was chemically modified in order to introduce O, S and N containing groups. The activated carbon surface was selectively oxidized with concen-trated HNO3 under controlled conditions. Characterization by thermogravimetric analyses, infra-red spectroscopy and NaOH titration suggested the formation of mainly –COOH and small amounts of –OH groups, with concentration of approximately 4.1021 groups/g of carbon. These -COOH
functionalized carbons showed high adsorption capacity for metal cations in aqueous solution in the following order: Pb+2>Cu+2>Ni+2>Cd+2~Co+2>Ca+2, suggesting a cation exchange mechanism
via a surface complex [–COO-M+2]. These –COOH
surf groups can be reacted with SOCl2 to produce
a surface acylchloride group, -COCl. This surface -COCl group proved to be a very reactive and versatile intermediate for the grafting of different S and N containing molecules onto the carbon surface, such as 1,2-ethaneditiol (EDT-, HSCH2CH2SH) 1,7-dimercapto-4-thioheptane (DMTH-HSCH2CH2CH2SCH2CH2CH2SH) or 1,2-ethylenediamine (EDA- NH2CH2CH2NH2) and
triethyltetraamine, TEA (H2NCH2CH2NHCH2CH2NHCH2CH2NH2). The characterization of these materials was carried out by TG, IR and TPDMS (Temperature Programmed Decomposition Mass Spectrometry) experiments suggesting the formation of thioesther and amide surface groups, i.e. –COSR and –CONHR, with yields of approximately 50 and 75% for the reaction with DME and EDA, respectively. Preliminary adsorption experiments showed that these materials can efficiently remove metals such as Pb+2, Cu+2 and Ni+2 from aqueous medium.
Keywords:activated carbon, surface modification, functionalization, cation exchange, heavy metals
1. Introduction
Surface modification1 has a fundamental role on the
application of organic and inorganic supports in industrial and environmental processes, such as selective purification processes, gas separation, solvent recovery, drinking water purification, adsorption of taste, odor and other micro-pol-lutants2, ion exchange properties for metal adsorption3,
cata-lyst preparation4, adhesion phenomenon4,6, electrode
modi-fication7 and polymer technologies8.
Activated carbon is one of the most important industrial adsorbent/support and can be prepared by carbonization and activation of a large number of raw materials such as coco-nut shells, wood, peat and coal. These carbons show high-developed porous structure and a large internal specific sur-face area, which is generally greater than 400 m2/g but
of-ten exceeds this value, reaching 1000 m2/g 3-5. Due to this
high surface area and porous structure9 it can adsorb gases
and compounds dispersed or dissolved in liquids10,11. The
type of contaminant to be adsorbed and the adsorption/ remotion efficiency of these carbons is strongly dependent on their surface chemical features. Therefore, the surface chemical modification of carbon is of great interest in order to produce materials for specific applications. This modifi-cation has been mainly carried out by oxidative methods, producing a more hydrophilic structure with a large number of oxygen-containing groups. Various reagents have been used as oxidants: concentrated nitric or sulfuric acid, so-dium hypochlorite, permanganate, bichromate, hydrogen peroxide, transition metals and ozone-based gas mixtures12.
It was found that the type of surface structures and the ex-tent of their formation depends on the oxidizing agent, the concentration and the pH of the oxidizing solution13-15.
is relatively well known, the functionalization with S and N containing molecules has been much less investigated.
In this work the activated carbon surface was chemi-cally modified in order to introduce oxygen, nitrogen and sulfur containing groups.
2. Experimental
2.1 HNO
3 Treatment (C/HNO3)
The activated carbon (20 g, Aldrich Norit, 930 m2/g)
was treated with 100 ml of concentrated HNO3 under re-flux for 2, 4, 8, 16 or 38 h. After rere-flux, the resulting mate-rial was filtered and extensively washed with hot distilled water until the cleansing water pH was approximately 7. The carbons were dried in vacuum at 60 °C for 24 h.
2.2 Reaction of the Activated Carbon with Thionyl Chloride (C/HNO
3/SOCl2)
The HNO3 treated carbon (0.80 g) was dried under vacuum at 80 °C to remove water and other substance which could interfere on the reaction. The reaction was carried out with 5 ml benzene and 5 ml of SOCl2 under reflux for 24 h. The mixture was dried in a rotatory-evaporator and extensively washed with benzene to eliminate residual SOCl2.
2.3 Reaction with Ethaneditiol (EDT, HSCH
2CH2SH) or
1,7-dimercapto-4-thioheptane (DMTH, HSCH
2CH2CH2SCH2CH2CH2SH)
After treatment with SOCl2 the material C/HNO3/SOCl2 (0.80 g) was reacted with 9 mmol of 1,2-ethaneditiol or 1,7-dimercapto-4-thioheptane in 5 ml of chloroform under reflux for 48 h. The product was washed extensively with CHCl3 and separated by centrifugation.
2.4 Reaction with Etilenodiamina (EDAH2NCH2CH2NH2) or Triethyltetraamine
(H2NCH2CH2NHCH2CH2NHCH2CH2NH2)
After treatment with SOCl2 the material (0.80 g) was reacted with of the amine (2.6 ml) in 6 ml of chloroform under reflux for 48 h. The product was extensively washed with CHCl3 and separated by centrifugation.
Thermogravimetric analyses were carried out in a Mettler TA 4000 System under N2 or air flow with a heating rate of 10 °C/min. Infrared spectroscopic analyses were obtained in a FTIR Mattson Instrument using KBr. BET surface areas were obtained in a Quantachrome Nova 1200 equipment with the carbon samples treated at 200 °C under vacuum for 3 h.
2.5 Temperature Programmed Decomposition Coupled with a Mass Spectrometer (TPDMS)
The TPDMS experiments were carried out in a HP 5989 II mass spectrometer using 5 mg sample in a direct probe equipped with a heating system which was inserted in the
MS chamber (P = 6.10-6 Torr). The probe was heated at
5°C/min up to 275 °C and all the volatile decomposition products were analyzed by the mass spectrometer.
2.6 Potentiometric Titration of the Carbon C/HNO3 with NaOH
The carbon (0.1 g) suspended in 25 ml of distilled water was titrated with a 0.02 M NaOH solution with continuous stirring. The titration was carried out under nitrogen atmos-phere to avoid interference of CO2 from the air. NaOH so-lution was added stepwise in 0.5 ml in intervals of 5-10 min to allow the reaction to take place and the pH to stabilize.
3. Results and Discussion
3.1 Treatment with HNO3
The controlled oxidation of the activated carbon was carried out with concentrated HNO3 under reflux for differ-ent periods. After this treatmdiffer-ent the obtained material was extensively washed with hot water and carefully dried in vacuum at 60°C. For comparison, the untreated original activated carbon was also washed with water and dried un-der vacuum. The mass balance with the weight losses ob-served after different reflux times is shown in Fig. 1.
It can be observed that the weight loss increases with the reflux time, probably due to the oxidation of the acti-vated carbon to gaseous products, e.g. CO2, and water solu-ble derivatives such as mellitic acid16.
Infrared spectroscopic analyses of the HNO3 treated car-bons (Fig. 2) showed strong absorption at approximately 1720 cm-1 (-C=O), 1550 cm-1 (-COO-), 1250 cm-1 (-C-O) and
3450 cm-1 (-OH) which can be assigned to carboxylic acid
groups16.
The HNO3 treated carbons were also analyzed by
thermogravimetry. Figure 3 shows the TG profiles for the different HNO3 treated carbons.
It can be observed that the untreated activated carbon showed very small weight decrease during TG analysis. On the other hand, the treated carbons showed significant weight loss after 200 °C. These weight losses observed for HNO3 treated carbons have been assigned mainly to the decompo-sition of carboxylic surface groups and in a lesser exten-sion to –OH groups according to the following processes2,16:
-COOHsurf → CO 2
-OHsurf→ CO
To estimate the surface concentration of carboxylic groups, TG experiments were carried out keeping the tem-perature at 750 °C until no weight loss was observed. The total weight loss obtained from 200 °C was considered to be related to the amount of CO2 formed. It was also carried out potentiometric titrations of the carbons with NaOH to obtain the number of acid sites.
The number of acid (COOH) sites for the different re-flux time obtained by both TG and NaOH titration is dis-played in Fig. 4.
It can be observed that up to 8 h reflux with HNO3 the –COOH concentration increases to ca. 2-4 . 1021 sites/g,
but it remains approximately constant even if the carbon is
Figure 3. TG profiles for the different HNO3 treated carbons.
Figure 4. Acid sites concentration (as –COOH) on carbon surface for the different reflux time.
Figure 5. Potentiometric titration of the carbons C/HNO3 with NaOH (0.02 M).
further refluxed with HNO3.
Figure 5 shows the NaOH titration curves. The obtained titration curves suggested that the number and the strength of surface acid sites tends to increase as the reflux time in HNO3 increased. For example, the carbon treated for 38 h with concentrated HNO3 showed the strongest acid sites whereas the treatment for 2-16 h did show much difference. Moreover, it can be observed the presence of two or more inflection points in the titration curve, which suggests the presence of sites with different acid strength.
It was also investigated the effect of the HNO3 treat-ment on the carbon surface area (Table 1).
The oxidation with concentrated HNO3 has a strong ef-fect on the carbon surface area, decreasing from 912 for the untreated carbon to 605 m2/g after 38 h reflux. This
de-crease in surface area is related to the destruction of the porous structure caused by the severe oxidation with con-centrated nitric acid.
These results suggest that a treatment with reflux time of 2 up to 8 h, will not strongly affect the activated carbon properties, since it produces a high concentration of sur-face acid sites, causes low weight losses and a relatively low decrease on surface area.
3.2 Adsorption Properties of –COOH Functionalized Carbons
The adsorption of chlorobenzene from water onto the carbons treated with HNO3 for different reflux time is shown in Fig. 6.
The treatment with HNO3 almost inhibit the adsorption of chlorobenzene. This is likely related mainly to presence of –COOH groups, which gives to the hydrophobic carbon surface a strong hydrophilic character.
On the other hand, the presence of these –COOH sur-face groups strongly increases the adsorption capacity for metal cations in water (Fig. 7).
It can be observed that as the –COOH surface concen-tration increases the adsorption capacity also increases, sug-gesting that the adsorption is probably taking place at the carboxylic groups via a cation exchange mechanism.
The following cation adsorption order was observed
Table 1. BET N2 surface area for the HNO3 treated carbons. HNO3 treatment time (h) BET surface area (m2/g)
0 912
2 831
4 821
8 792
16 722
38 605
Figure 6. Chlorobenzene adsorption capacity on carbon treated with HNO3 for different reflux time.
Figure 7. Metal cations adsorption on functionalized activated carbons.
Pb+2 > Cu+2 > Ni+2 > Cd+2 ~ Co+2 > Ca+2, suggesting that the
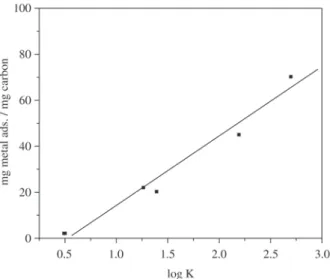
stability of the surface complex formed is important for the adsorption of the cation. In fact, the adsorption capacity is very well correlated with the stability constant of cation
complex formation with acetate (a model for the surface –COO- groups) in solution:
M+2 + CH
3COO
-↔ [M(CH 3COO)]
+K =
Figure 8 shows the correlation of the stability constants with the adsorption capacities.
It can be observed that as the stability (log K) increases the adsorption capacity of the carbons increases linearly.
This excellent cation exchange properties shown by these
carbon containing –COOH surface groups makes them promising adsorbents to remove metal contaminants in aque-ous effluents.
3.3 Carbon Surface Functionalization.
Functionalization of carbon surfaces with S and N con-taining groups have been carried out by different methods such as: treatment with sulfur17 and CS
2
18 at high
tempera-tures, direct reaction of surface COOH groups with H2NR compounds19 and direct surface deposition of pyrazolone
derivatives20. However, these proposed methods show in
general complex procedures with low efficiency. Hereon, it is described a simple and versatile method for the introduc-tion of heteroatoms such as S and N containing molecules onto carbon surface.
The following reaction scheme was used to introduce S and N groups on the carbon surface starting from the –COOH groups.
The S and N molecules used in this work are described in Table 2.
The IR spectra obtained for the –COOH, -COCl inter-mediates and the materials obtained by the reaction with EDT and EDA are shown in Fig. 9.
After the reaction with SOCl2, the IR spectrum (Fig. 9b) showed new and well defined bands at approximately 1700, 1350, 1210 and 790 cm-1 which are clearly related to the
formation of the group –COCl. The IR spectrum for C6H5COCl shows exactly the same bands. On the other hand, it can also be noticed the presence of the original bands, which might be indicating that not all the –COOH groups present on the carbon surface reacted with SOCl221.
The IR spectrum of the carbon after reaction with EDT (Fig. 9c) suggests the occurrence of the reaction of –COCl with the HSR compound to form –COSR. Typical bands of –COCl disappeared and well defined absorptions at 1400, 1200, 750 and 700 cm-1 related to the EDT molecule are
observed. The IR spectrum for the material obtained by the reaction with EDA (Fig. 9d) also suggested the reaction of HNHR with the surface group –COCl, with the presence of
Figure 8. Stability constants versus adsorption capacity for the different metal cations onto 16 h reflux treated carbon.
Figure 9. IR spectra for the (a) carbon treated with HNO3 (8 h); (b) after reaction with SOCl2, followed by reaction with; (c) HSCH2CH2SH (EDT) or (d) H2NCH2CH2NH2 (EDA).
Scheme 2. Reactions used to functionalize the carbon surface with S and N groups.
[M(CH3COO)]+
[M+2].[CH
3COO
the following bands: ~1720 cm-1 (-C=O), 1675 and
1600 cm-1 (-N-H), 1520 cm-1 (-RCONHR), 950-1000 cm-1
(DTE characteristic bands) and 1200 cm-1 (-C-N) and
3000-3500 cm-1 (N-H). Similar results have been observed
for the functionalization with DMTH and TEA, with the presence of bands typical of –COSR and –CONHR groups and also characteristic absorption presented by the R groups.
3.4 Thermogravimetric Analyses of the Functionalysed Carbons
TG analyses of the DMTH and TEA functionalysed car-bons are shown in Fig. 10
It can be observed for the EDT functionalyzed material in Fig. 9b a weight loss of ca. 46% centered at 250 °C. From this weight loss it is possible to estimate the concentration of the EDT groups grafted on the carbon surface of approxi-mately 2 mmol/g of carbon. Therefore, considering the –COOH concentration of ca. 4.1021 sites/g this weight loss
suggests that approximately 50% of these sites have been actually converted to the thio surface group -COSCH2CH2SH. From the EDA analysis (Fig. 9c), the weight loss of 62% at the temperature 300 °C, it can be estimated a concentration of surface groups of 3.4 mmol/g of carbon corresponding to a yield of approximately 75%. For both analyses the weigh losses observed at temperatures higher than 500 °C are re-lated to the oxidation of the carbon by air.
3.5 Temperature Programmed Decomposition/Mass Spectrometry Experiments (TPDMS)
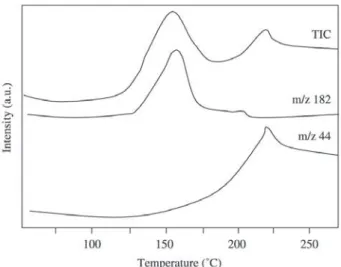
In these TPDMS experiments the functionalized carbons were heated in a He flow at 10 °C/min and upon the ther-mal decomposition the volatile products were analyzed by a mass spectrometer. The results are displayed in Fig. 11.
The TPDMS profile show two peaks in the total ion sig-nal (TIC) centered at 150 and 225 °C. It was observed that the peak at 150 °C is composed by several m/z fragments such as 182 (HSCH2CH2CH2SCH2CH2CH2SH+) (Fig. 11)
and 74 (CH2CH2CH2SH+) suggesting that these fragments
originate from the thermal decomposition of the surface DMTH group, which is released to the gas phase and de-tected by the mass spectrometer. The TPDMS peak at 225 °C is composed by a m/z signal 44, CO2, formed by the thermal decomposition of –COOH surface groups. Similar TPD profile was obtained for the HNO3 treated carbon.
Table 2. S and N molecules grafted on carbon surface.
Molecule Formulae
1,2-ethaneditiol (EDT) HSCH2CH2SH
1,6-dimercapto-4-thioheptane (DMTH) HSCH2CH2CH2SCH2CH2CH2SH
1,2-diaminoethane (EDA) NH2CH2CH2NH2
Triethyltetraamine (TEA) H2NCH2CH2NHCH2CH2NHCH2CH2NH2
Figure 11. TPDMS experiment with the DMTH functionalised carbon.
Figure 10. TG analyses of the (a) HNO3; (b) EDT; (c) EDA functionalyzed carbons in air.
4. Metal Adsorption
These sulfur and nitrogen functionalyzed carbons show great potential for the adsorption of heavy metals such as Hg2+, Zn2+, Cd2+ and Pb2+ ions due to the presence of surface
were also tested for the adsorption of Pb+2, Cu+2 and Ni+2 in
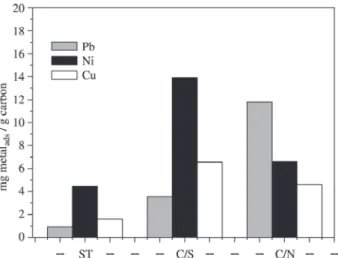
aqueous solution. The comparison of the adsorptions on the untreated carbon, the EDT (C/S) and EDA (N/C) functionalyzed carbons are shown in Fig. 12.
It can be seen that the functionalization of the carbon strongly increases its adsorption for the different metals stud-ied. The results suggested that the EDT funtionalyzed ma-terial can adsorb more efficiently Ni+2 whereas the EDA
carbon showed a stronger interaction with Pb+2 cations.
5. Conclusion
Activated carbon can be tailored by surface chemical modification to produce materials with unique properties and for specific applications. These modifications can be carried out via the key surface intermediate: -COOH. The carbon containing –COOH groups shows excellent cation exchange properties and can be used as adsorbent for metal contaminants in water. These –COOHsurf groups can be con-verted to -COCl surf which is a very reactive and versatile group for the grafting of other molecules onto the carbon surface. From this acylchloride intermediate several S and N molecules, for example HSR and HNR2, can be easily bounded to the carbon surface. These S and N functionalized carbon show great potential as adsorbent of metals, spe-cially heavy metals which represent a serious environmen-tal problem nowadays.
Acknowledgements
The authors are grateful for funding from PRPq/UFMG, CAPES, FAPEMIG and CNPq.
Figure 12. Adsorption of Pb+2, Cu+2 and Ni+2 in aqueous solution on untreated carbon (ST) and on the EDT (C/S) and EDA (N/C) functionalyzed carbons.
References
1. Spencer, N.D. Advanced Surfaces: Their Tailoring and Analysis, Chimia, v. 52, p. 598, 1998.
2. Bansal, R.C.; Donnet, J.B.; Stoeckli, F. Active Carbon, Marcel Dekker Inc., New York, p. 27-35, 1988. 3. Shim, J.W.; Lee, S.M.; Rhee, B.S.; Ryu, S.K. Adsorption
of Ni(II), Cu(II), Cr(VI) from multicomponent aqueous solution by pitch-based ACF. In: Extended abstracts,
European Carbon Conference, Newcastle, UK, , British Carbon Group, p. 242-243, 1996.
4. Rodriguez-Reinoso, F. The role of carbon materials in heterogeneous catalysis. Carbon, v.36, p.159, 1998. 5. Peebles, L.H.Jr. In: Carbon fibers: formation, structure,
and properties, CRC, Ann Arbor, p. 125 chapter 8, 1994. 6. Park, S.J.; Kim, M.H. J. Mater. Sci., v. 35, p. 1901, 2000. 7. E.C. Peters, M. Petro, F.Svec and J.M.J. Frechet, Anal.
Chem., v. 70, p. 2288, 1998.
8. M.V. Michel, C. Marzin, G. Tarrago and J. Durand, J. Appl. Polym. Sci., v. 70, p. 359, 1998.
9. Gregg, S.J.; Sing, K.S.W. In: Adsorption, Surface Area and Porosity, Academic Press, London, p. 121-189, 1982. 10. Matson, P.; Mark, H.B. Activated carbon: Surface Chem-istry and Adsorption from Solution. Marcel Dekker, New York, 1971.
11. Ruthven, D.M. Principles of Adsorption and Adsorp-tion Processes. John Wiley & Sons Inc. New York, 1984. 12. Lisovskii, A.; Semiat, R.; Aharoni, C. Carbon, v. 35,
p.1639, 1997.
13. Ramos, M.A.; Serrano, V.G.; Calahlorro, C.V.; Peinado, A.J.L. Spec. Lett., v. 26, p. 1117, 1993
14. Ogino, K. Studies Surface Sci. Catalysis, v. 80, p. 491, 1992.
15. Bradley, R.H.; Sutherland, I.; Sheng, E. J. Chem. Soc. Faraday Trans., v. 91, p.3201, 1995.
16. Boehm, H.P. Adv. Catal., v. 16, p. 179, 1966.
17. Boehm, H.P.; Diehl, E.; Heck, W. J. Chem. Soc. Ind., v. 369, 1966.
18. Boehm, H.P.; Tereczik, B.; Schanz, K. Proc. Colloque Intern. Adsorption Interfaces gaz/solide, Aix-en-Pro-vence, 1981, Elsevier, p. 395, 1982.
19. Puri, B.P.; Hazra, R.S. Carbon,v. 9, p. 123, 1971. 20. Pittman, C.U.; He, G.R.; Wu, B.; Gardner, S.D. Carbon,
v. 35, p. 317, 1997.
21. Lakov, L.; Vassileva, P.; Peshev, O. Carbon, v. 37, p. 1655, 1999.
22. Zawadzki, J. Infrared spectroscopy in surface chemis-try of carbons. In: Chemistry and Physics of Carbon. P. A. Thrower (Ed.), vol. 21, Marcel Dekker, New York, p. 147-386, 1989.