Determination of
CTOD
Cin Fibre Metal Laminates
by ASTM and Schwalbe Methods
E.M. Castrodezaa, J.M. Rodrigues Touçaa, J.E. Perez Ipiñab*, F.L. Bastiana
a Laboratório de Compósitos, COPPE/Universidade Federal do Rio de Janeiro
C. P. 68505, 21945-980 Rio de Janeiro - RJ, Brazil
b Grupo Mecánica de Fractura, Universidad Nacional del Comahue/CONICET,
Calle Buenos Aires 1400, 8300 Neuquén, Argentina
Received: August 28, 2001; Revised: March 12, 2002
Fibre Metal Laminates (FMLs) have arisen as a demand of the aeronautical industry to use thin sheets with high resistance to fatigue crack growth, high damage tolerance, corrosion resist-ance and high specific strength. Considering these requirements, FMLs are an advantageous choice when compared to metal alloys currently used. In order to employ FMLs in aircraft structures, designers must hold a deep knowledge of a wide set of their properties including fracture ness. The aim of this work was to evaluate the available methodologies to measure fracture tough-ness at instability (CTODC) in unidirectional fibre metal laminates reinforced with aramid fibres (ARALL®). To achieve this, tests were performed to obtain traditional and Schwalbe CTODs by
using experimental ASTM based techniques, especially adapted to these laminates. Results achieved point out that Schwalbe method is more appropriate and also that there are differences between both CTOD parameters.
Keywords: fibre metal laminates, crack tip opening displacement, composites
1. Introduction
Fibre Metal Laminates (FMLs) are structural compos-ite materials. They consist of thin aluminium alloy sheets bonded alternately with fibre-reinforced epoxy layers. These laminates are increasingly being employed in the aeronau-tical industry for structural applications, which require thin sheets with high mechanical and fatigue strengths1. The first
researches on these composites were held in Delft Univer-sity, Holland, during the 80’s2,3. Nowadays, laminates
com-mercially available are reinforced with either glass (GLARE®) or aramid (ARALL®) fibres, although there are
experiences with other materials combinations4-6.
Because these materials were developed for aeronauti-cal applications, it is necessary to have a proper knowledge of their fracture and fatigue properties. One of the most re-markable characteristics in FMLs is the crack bridging mechanism. When a fatigue crack grows perpendicularly to the fibres direction, it propagates preferentially through the aluminium layers while a controlled delamination be-tween the metallic layers and the polymeric matrix causes little damage to the fibres. Thus, a large quantity of fibres
remains intact behind the crack tip on the aluminium layers taking up part of the loading. This reduces the level of ef-fective crack tip stress intensity factor in the aluminium, diminishing the crack propagation rate. This mechanism produces crack growth rates down to 100 times lower than in monolithic aluminium alloys7,8. Due to their excellent
fatigue properties, most of the research was focused on this aspect. On the other hand, there are few experimental works on monotonic fracture of these materials9,10.
From literature10, and also based on load versus
load-line displacement (P-v) records showing departures from linearity, it was found that determination of fracture tough-ness by using linear-elastic fracture mechanics is not ad-equate11,12. Fracture toughness evaluation of FMLs should
be carried out using elastic-plastic methodologies even when they present brittle fracture or instabilities similar to pop-ins. There are two elastic-plastic parameters widely accepted by the fracture community: J-Integral and CTOD13.
Schwalbe’s CTOD (δ5)14 is a relatively new methodology
which fracture community is discussing and analysing. Both parameters are applied to different materials.
*e-mail: pipina@uncoma.edu.ar
In the present work, two CTOD based methodologies (ASTM and Schwalbe’s CTOD) were employed to evalu-ate critical fracture toughness (CTODC) of ARALL 2 and 3 laminates with reinforcing fibres oriented transversally to the notch. A comparison between results obtained was made in order to prove the equivalence between methodologies and their applicability to these laminates as to characterise their fracture toughness.
2. Materials and Methods
Materials
Unidirectional laminates ARALL 2 and ARALL 3 were tested. These laminates consist of alternating layers of thin aluminium alloy sheets bonded together by fibre reinforced epoxy adhesive. A schematic representation of ARALL 3, of 2/1 stacking sequence, can be seen in Fig.1. All ARALL laminates are reinforced by unidirectional aramid fibres. ARALL 2 is made of sheets of 2024-T3 alloy, while ARALL 3 is made of 7475-T76 alloy and deformed up to 0.5% after cure in order to reverse undesirable residual stress arisen during cure. After this deformation process, stress in the aluminium layers become compressive whereas in fibre-reinforced layers become tensile, thus improving fatigue properties. These laminates are manufactured with differ-ent lay-ups, represdiffer-ented by n/m (n = m + 1), where n is the number of aluminium layers and m is the number of pre-impregnated fibre layers. Volume fraction of fibres in prepregs is 50%, fibres oriented parallel to the rolling di-rection of the aluminium sheets15. Some mechanical
prop-erties and characteristics of these laminates are shown in Table 116.
Methodologies
Tests were carried out following mainly a methodology proposed for JC tests of fibre-metal laminates17. This
meth-odology precludes the use of test specimens according to standards (with few modifications) and either avoids or takes into account problems (buckling, indentations, notch acu-ity, critical point definition, etc.) which arise when ASTM
procedures are straightforwardly applied. Studies on the applicability of ASTM and Schwalbe’s methodologies to measure CTOD on these materials were carried out.
Test Specimens
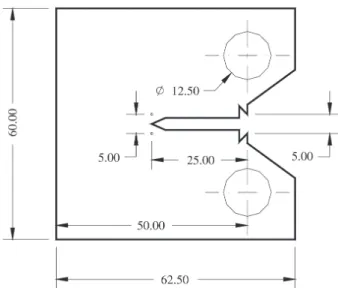
Test specimens used were of the compact tension type (C(T)), with fibres oriented transversely to the notch. Their dimensions are shown in Fig. 2. The thickness of the speci-mens corresponded to the laminate thickness itself, much smaller than that preferred by the ASTM standard, although still within the standard. Test specimens were machined in a similar way to ordinary metallic test specimens but they were not fatigue pre-cracked. For FMLs, minimum tough-ness is achieved by testing specimens with sharp notch in-stead of fatigue pre-cracked ones17.
Schwalbe CTOD (δ5)
Recently, δ5 was introduced as an experimental tech-nique for measuring Crack Tip Opening Displacement (CTOD)18. It can be employed to determine crack growth
resistance curves as well as initiation or critical toughness values. Several experiments performed have confirmed that δ5 can be used as an operational definition of CTOD with the following advantages18: δ
5 is measured locally next to the crack tip and independently of the global behaviour; as a consequence of direct measurement of the crack tip dis-placement, there is no need of calibration functions. This makes it possible to determine δ5 for any test specimen or structural component having a crack. By this method, CTOD
is measured on one side surface of test specimens at points located 2.5 mm each side from the tip of the fatigue pre-crack or notch.
Figure 1. Schematic representation of ARALL laminates in 2/1
In order to avoid damage of fibre-reinforced epoxy lay-ers, the marks to fix the extensometer tips on one external aluminium layer were hand-made using a 0.60 mm diam-eter drill. Depth of the marks was less than the aluminium layer thickness.
Equations to calculate CTOD (δ)
To calculate CTOD according to ASTM, standard equa-tions were slightly modified to adapt them to orthotropic materials. The elastic component was calculated from the relation developed by Paris and Sih19 for these materials, as
follows: ' 2 1 11 66 12 2 / 1 11 22 22 11 2 1 1 2 2 2 E K a a a a a a a K G = + + = (1)
where a
ij are the components of the compliance matrix of the laminate. E’ was considered to be an “apparent” elas-tic modulus of the orthotropic material in the specific direc-tion. The plastic component calculation was performed with-out modifications. So, the expression used was:
(
)
(
)
[
W a a z]
v a W
E K
YS − + +
− + = 0 0 p pl 0 p ' 2 1 r r 2σ δ (2)
where a0 = original crack length; K = stress intensity factor; σYS = tensile yield limit; vpl = plastic component of the displacement at the crack mouth opening; z = clip-gauge knife height and rp = rotational factor calculated in accord-ance with ASTM13.
Tests
Eight specimens were tested: two for ARALL 2 3/2, and three for each ARALL 3 3/2 and ARALL 3 4/3. Tests were carried out under constant displacement rate of 0.5 mm/ min in an INSTRON 1125 testing machine. The crack mouth opening displacement (CMOD) was measured through a clip gauge in the load-line. In this way CMOD and load-line-displacement values coincide.
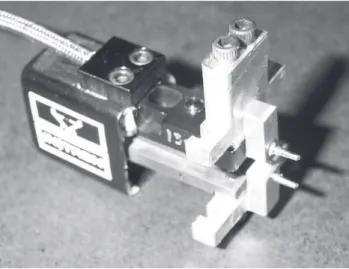
Critical fracture toughness is calculated at the point where the first significant load drop occurs. The amount of load drop necessary to be considered significant was estab-lished in a similar way to the pop-in instabilities
characteri-Figure 3. Modified commercial extensometer (INSTRON) for δ5 measurement.
Figure 4. Experimental configuration for δ5 measurements.
Table 1. Basic mechanical properties of ARALL 2 3/2, ARALL 3 3/2 and ARALL 3 4/3 laminates (in the fibre direction)15.
Material σYS σUT εUT ET EC ρ Thickness Metallic %
[MPa] [MPa] [%] [GPa] [GPa] [kg/m3] [mm] [Vol]
ARALL 2 3/2 337 662 2.0 68.0 64.0 2300 1.35 67.9
ARALL 3 3/2 565 765 1.8 68.2 66.2 2300 1.34 67.9
ARALL 3 4/3 565 786 1.7 68.9 66.2 2270 1.83 65.3
sation procedure given by ASTM E 182013, although
con-servatively setting at 2% the slope difference between the straight lines instead of the 5% recommended by the stand-ard17. Fracture toughness values were in all cases calculated
using the initial crack length.
Figure 5.P vs. v and P vs. δ5 curves of ARALL 2 3/2 (test specimen B).
Figure 6.P vs. v and P vs. δ5 curves of ARALL 3 3/2 (test specimen A).
3. Results
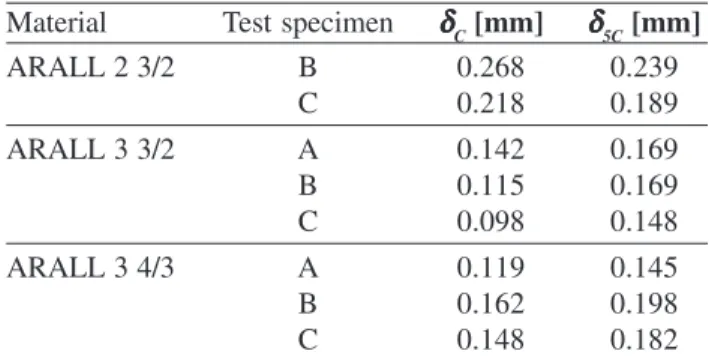
Table 2. Critical values of the ASTM CTOD (δ) and SCHWALBE CTOD (δ5).
Material Test specimen δδδδδC [mm] δδδδδ
5C [mm]
ARALL 2 3/2 B 0.268 0.239
C 0.218 0.189
ARALL 3 3/2 A 0.142 0.169
B 0.115 0.169
C 0.098 0.148
ARALL 3 4/3 A 0.119 0.145
B 0.162 0.198
C 0.148 0.182
Figure 7.CTOD vs. δ5 curve of ARALL 2 3/2 (test specimen B).
Figure 8.CTOD vs. δ5 curve of ARALL 3 3/2 (test specimen A).
to be introduced later, are representative of the ones ob-tained in all tests. Critical ASTM values, δC, were calcu-lated using equation (2) with rp values recommended by the standard, while critical δ5C values were directly obtained from the record. Table 2 shows δC and δ5C values for every specimen tested. Table 3 shows mean and standard devia-tion of these values. CTOD vs. δ5 curves for ARALL 2 3/2 and ARALL 3 3/2 laminates are shown in Figs. 7 and 8, respectively.
4. Discussion
Instabilities similar to pop-ins occurred during all tests. Thus, characterisation of fracture toughness at instability by using the proposed testing methodology, to which fol-lows a procedure based on pop-in analysis17, proved
ad-equate. Stable crack growth in the aluminium layers before reaching the critical point was not observed.
CTOD values for ARALL 2 were higher than those for ARALL 3 in all cases as can be seen in Tables 2 and 3. The higher toughness of ARALL 2 compared to ARALL 3 is thought to be related to both its lower mechanical strength –σYS and σUT values– and its higher ductility (see Table 1). On comparing these results, it is remarkable that the criti-cal toughness values, δ5C, for ARALL composites with lower strength and higher ductility follow the same trend observed in ordinary metallic materials. This brings up the impor-tance of the aluminium layers in this kind of composites whose mechanical behaviour is very different from that of polymeric matrix laminates.
δ5C values for the two lay-ups studied for ARALL 3 are
Table 3. Mean and standard deviation values of the results in Ta-ble 2.
Material Lay-up δC [mm] δ5C [mm] ∆δ (%) ARALL 2 3/2 0.243 ± 0.035 0.214 ± 0.035 13.55
ARALL 3 3/2 0.118 ± 0.022 0.162 ± 0.012 27.16 4/3 0.143 ± 0.022 0.175 ± 0.027 18.29
similar. Preliminary tests with ARALL 3 2/1 (0.82 mm in thickness) agree with this tendency.
δC values for ARALL 3 were, in average, 27.2% lower than those of δ5C for the 3/2 lay-up and 18.3% lower than those of δ5C for the 4/3 lay-up, whereas for ARALL 2 δC values were, in average, 13.6% higher than δ5Cvalues. These differences between critical values led to analyse them in more detail by depicting the evolution of ASTM CTOD
At critical points, the elastic component of CTOD was larger than the plastic one in ARALL 3, while this relation-ship was the opposite in ARALL 2.
From these analyses, the difference in CTOD values could be due to the combination of an underestimation of the elastic component and an overestimation of the plastic one in the ASTM CTOD calculation.
A more detailed analysis will be performed in a future stage in order to evaluate the applicability of ASTM equa-tions for the calculation of elastic and plastic CTOD com-ponents. Values of m, which is a factor in the relation be-tween δ and K (m = 2 in the standard), and rp will be specifi-cally investigated. As a first approach, and until more spe-cific research is carried out, Schwalbe’s methodology, in which CTOD is directly measured, has so far proved more appropriate for FMLs. This methodology implementation in a testing laboratory turned out very simple.
5. Conclusions
• Instabilities similar to pop-in phenomenon in welded joints of steel were recorded in all load vs. displace-ment curves of laminates studied.
• The use of an experimental methodology17 developed
for these materials proved adequate.
• Critical fracture toughness values were higher in ARALL 2 than in ARALL 3. Besides, δ5C values in ARALL 3 were similar in both lay-ups studied (3/2 and 4/3).
• In ARALL 3 δC values were lower than δ5C , whereas in ARALL 2 this relation was the opposite.
• The difference in CTODs measured applying the two methodologies could be due to underestimation of the elastic component plus overestimation of the plastic component of the ASTM CTOD.
• δ5C is considered the best choice for CTOD measure-ments in FMLs until further research on δC is performed.
Acknowledgements
To Eduardo Benotti (U.N. del Comahue) for the ma-chining of test specimens. To CNPq, FINEP, CONICET, CAPES and SETCIP for their financial support. To CNPq for the scholarship of Enrique M. Castrodeza.
References
1. Vogelesang, L.B.; Vlot, A. Journal of Materials Process-ing Technology, v. 103, p. 1-5, 2000.
2. Bucci, R.J.; Mueller, L.N.; Vogelesang, L.B.; Gunnik, J.W. In: Vasudevan, A.K., Doherty, R.D., Eds., Treatise on Materials Science and Technology, Academic Press Inc., CA, USA, p. 295, 1989.
3. Vlot, A.; Van Ingen, J.W.; Journal of Composite Materi-als, v. 32, p. 1785-1805, 1998.
4. Lin, C.T.; Kao, P.W.; Yang, F.S. Composites, v. 22, p. 135-141, 1991.
5. Shihong, L.; Benlian, Z.; Qiyun, Z.; Xianrong, B. Com-posites, v. 25, p. 225-228, 1994.
6. Johnson, W.S.; Li, E.; Miller, J.L. Applied Composite Materials, v. 3, p. 379-390, 1996.
7. Castrodeza, E.M.; Yawny, A.; Perez Ipiña, J.E.; Bastian, F.L. Journal of Composite Materials, v. 36, p. 387-400, 2002.
8. Marissen, R. Engineering Fracture Mechanics, v. 19, p. 261-277, 1984.
9. Macheret, J.; Bucci, R.J. Engineering Fracture Mechan-ics, v. 45, p.729-739, 1993.
10. Caprice, M.D.; Oriunno, M.; Vermeeren, C. Engineer-ing Fracture Mechanics, v. 49, p.727-740, 1994. 11. Castrodeza, E.M. Tese M.Sc., COPPE/UFRJ, RJ, Brasil,
p. 120, 1998.
12. Castrodeza, E.M.; Perez Ipiña, J.E.; Bastian, F.L. Anais do 14º CBECIMAT, São Paulo, SP, CD-ROM, 2000. 13. ASTM E 1820, In: 1999 Annual Book of ASTM
Stand-ards, v. 3.01, American Society for Testing and Materi-als, PA, USA, p. 509, 1999.
14. Schwalbe, K.H.; In: Reuter, W.G.; Underwood, J.H.; Newman, J.C. Eds., Fracture Mechanics, ASTM STP 1256, American Society for Testing and Materials, PA, USA, p. 763, 1995.
15. Papakyricou, M.; Schijve, J.; Stanzl-Tschegg, E. Fa-tigue and Fracture of Engineering Materials and Struc-tures, v. 20, p. 1573-1584, 1997.
16. Structural Laminates Company, QA Reports No. B0319B-2, B1008B-1, B0904A-3, New Kensington, PA 15068, 1994.
17. Castrodeza, E.M.; Perez Ipiña, J.E.; Bastian, F.L. Fa-tigue & Fracture of Engineering Materials & Structures, 2002 (accepted for publication).
18. Schwalbe, K.-H.; The Engineering Flaw Assessment Method (EFAM) – Document EFAM 96, GKSS Report 98/E/40, Germany, 1998.