ABSTRACT: Considering the potential of tridimensional computed tomography (3D-CT) as a predictor of real bone dimensions, nine dried human skulls with maxillary edentulism were evaluated using images obtained by 3D-CT, prior to the installation of zygomatic implants, in order to obtain the measurements of the implants. In the analysis of correlation between the two 3D-CT examiners, a 75% agreement was found, and no correlation was found be-tween them and the surgical measurement. The worst result was the surgical one, possibly because an inaccurate probe was used. Based on the obtained data, we concluded that the probe used is inaccurate, suggesting that the surgical probe be changed in its measurement scale. Agreement between surgeon and radiologist could possibly be obtained by using insertion guides, since what might have possibly caused the discrepancy in the results is the fact that the 3D-CT examiners and the surgeon used different implant insertion points. It is also possible that a larger sample might produce a more accurate evaluation, thus improving the results.
DESCRIPTORS: Atrophy; Dental implantation; Maxilla; Tomography, X-ray computed.
RESUMO: Considerando-se o potencial da tomograia computadorizada tridimensional (TC-3D) como preditor de dimensões ósseas reais e avaliando-se nove crânios humanos secos com edentulismo maxilar, foi feito um estudo utilizando-se o recurso das imagens obtidas por TC-3D, previamente à execução da técnica de ixação zigomática, para mensurar o comprimento de tais ixações. Na avaliação da concordância interexaminador da TC-3D, houve uma boa correlação entre o primeiro e segundo (75%), e ausência de correlação entre estes e a medida cirúrgica. Contextualizando, o pior resultado foi o cirúrgico, possivelmente pelo fato de utilizar uma sonda imprecisa. Diante dos dados obtidos, concluiu-se que a sonda utilizada é imprecisa, sugerindo uma mudança na mesma quanto ao seu escalonamento e que medidas para aproximar as linguagens do cirurgião e do radiologista talvez fossem con-seguidas com a utilização de guias de inserção, pois o que possivelmente ocasionou a discrepância nos resultados foi o fato de os examinadores 1 e 2 da TC-3D medirem um local de inserção da ixação e o cirurgião inserir esta em outro. É possível que uma amostra maior, por proporcionar avaliações mais abrangentes, possa incrementar os resultados ora encontrados.
DESCRITORES: Atroia; Implante dentário; Maxila; Tomograia computadorizada por raios X.
INTRODUCTION
The development of implantology has increased the options available for the treatment of total and partial edentulism.1,2,4,10,12,17,18,22 Osseo-integrated
implants are proving to be a successful method for the replacement of lost teeth and this requires accurate diagnostic information to avoid damage to the anatomical vital structures during surgical manipulation. It is essential to have diagnostic resources that reflect the area to be operated on with accuracy in size, volume, and shape as well
as the density of the alveolar bone and its corti-cals.3-8,11,16,19,20,23
With the advances in dental implants, it is necessary to include additional treatment planning procedures to optimize the position and angle of the implants and, therefore, increase the possibility of a successful treatment. Computed tomography (CT) is one of these diagnostic procedures, origi-nally introduced as a medical diagnosis technique and later used in odontology.8,9,13,21,23 CT offers
* Professor, School of Dentistry, Metropolitan Union of Education and Culture, BA, Brazil.
** PhD, Professor, Department of Propaedeutics and Integrated Clinic, School of Dentistry; ***PhD, Professor, Collective Health Institute, School of Medicine – Federal University of Bahia.
Length determination of zygomatic implants using tridimensional
computed tomography
Determinação do comprimento de fixações zigomáticas a partir
de tomografia computadorizada tridimensional
ter visualization of the structures than any other radiological method.6,20,22
It is the aim of this research to evaluate and introduce 3D-CT as a diagnostic instrument in the pre-surgical planning for zygomatic fixation.
MATERIAL AND METHODS
Measurement of the length of zygomatic fixa-tions was evaluated in nine dried human skulls with maxillary edentulism, provided by the De-partment of Biomorphology Science, Science and Health Institute, Federal University of Bahia (UFBA), BA, Brazil, using three-dimensional CT images prior to the execution of the zygomatic fixa-tion technique.
In order to obtain the images of the maxillary zygomatic complex for the pre-surgical planning of the zygomatic implants, a high resolution spi-ral CT equipment was used (CT Synergy Helicoi-dal, General Electric Company, Milwaukee, WI, USA).
In the supine position with the sagittal plane perpendicular to the horizontal plane and the Frankfort plane parallel to the opening of the gan-try, the skull was connected to a support for this purpose. Luminous beams helped in the correct placement of the sagittal plane and the Frankfort plane (Figure 1).
In order to obtain the image, a lateral topogram was made available, and, based on this, the area
of interest for the procedure of the tomographic cuts was delimited.19,20 A total of 53 axial cuts were
obtained in each skull from half of the orbit height to the alveolar ridge.
For analysis of the images, a specific code was used in the production and identification of the tomograms in order for them to be identified by the examiners during their evaluation.
A protocol for the measurements was devised for two experienced radiologists in 3D-CT and the measurements were obtained in a single reading, by each examiner.
Clog area
Using an angle measuring tool, with the im-age at 45°, a line was drawn lightly touching the posterior edge of the orbit and another line that followed the tangent of the inferior edge of the or-bit. The clog area corresponded to the triangular space, the base of which was the orbitary edge up to the limit of the drawn lines.
Clog point
As the clog area was established with the im-age at 45°, this point was defined as being at half course of the angle bisector formed between the lines that followed the tangent of the orbit, up to the orbitary contour. Therefore, the median point of the bisector.
Insertion point
Using a linear measuring tool, with the im-age at 45°, the insertion point was defined at the height of the alveolar ridge which corresponded to the second premolar, receding 5 mm in the cra-nial direction. In order to improve accuracy while determining this point, an imaginary line was es-tablished as a parameter from the infra-orbitary foramen to the alveolar ridge.
All the procedures were made at 45° and checked both at the sagittal and frontal planes in order to double check the correct placement of the points used to estimate the size of the zygomatic fixation.
Then, an estimation was made of the length of the zygomatic fixations in the 3D-CT images from the insertion point up to the clog point (Figure 2).
The accuracy evaluation was based on the measurements of the fixations obtained by the surgeon using the gold standard probe. These measurements were later compared with the to-mographic measurements.
The surgeon, not guided by 3D-CT, carried out the surgery in the skulls according to the in-structions of the placement fixation protocol.15 A
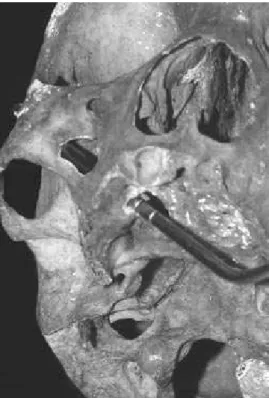
rectangular bony window of access was created, tangential to the zygomatic pillar, at the level of the maxillar sinus, which allowed the direction of the drill to be adjusted. A set of drills suitable for perforation and enlargement of the fixation trajec-tory was used (Figure 3).
Statistical analysis tested for adherence to theoretical normal distribution, and the three measurements for examiners 1 and 2 and the surgeon were found to have normal distribution
(pe1 = 0.9442, pe2 = 0.9442 and ps = 0.5713,
respec-tively). The coefficient of variation was obtained as a measure of precision. Spearman’s correlation was used as a measure of conformity.
RESULTS
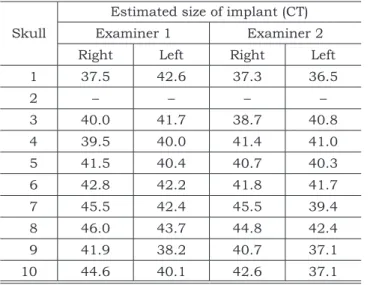
Table 1 shows the results of the length of im-plants estimated using the 3D-CT images, and Table 2 shows the length of the implants chosen during surgery.
FIGURE 2 - Sequence of the construction of the clog area, clog point and insertion point.
FIGURE 3 -Probing.
Clog point
The standard bias was found to be small in relation to the mean, indicating good accuracy of the measurements. According to the coefficient of variation (Cv) the surgeon was least accurate
and examiner 1 was the most accurate. Taking into consideration that the implants vary from 30 to 52.5 mm, the mean was established around 42 mm. This result is comparable to clinical and literature data, which give the length of implants most often used as 45 mm. In the sample, 75% of the estimations of the length of the implants measured 42.8 mm (Table 3).
From these three measurements, a good corre-lation was found between examiners 1 and 2 (75%), even though they were working with millimeters. The correlation between examiner 1 and the sur-gical measurement was 0.0069, and between ex-aminer 2 and the surgical measurement, 0.2027. Spearman’s correlation was used.
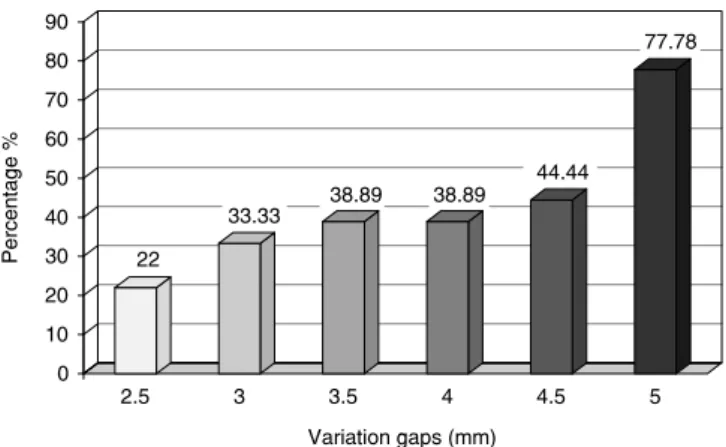
Only 4 of 18 (22%) measurements occurred within the interval (Table 4). As the gap increased, there was a progressive increase in concordance. The biggest coincidence occurred at an interval of
± 5 mm, which corresponds to 77.78% (Graph 1). The major gap in coincidence indicated problems with probe inaccuracy, which outlines the scale of variation of the implant; therefore, the established gold standard was considered inaccurate. The probe has gaps of 5 mm; some special implants have inaccurate readings due to being between two markings.
DISCUSSION
The increase in people’s expectations, the increasing number of older people, and the cor-responding reality of dental health in Brazil all justify investments in acquiring knowledge on new techniques, including the research described here on improved planning for a technique that leads to a better quality of life.3,5,10
We must take into consideration that, in phys-iological terms, each patient has individual skull metric characteristics.3,7,8
The placement of zygomatic implants is a com-plex surgical procedure and the variation in zygo-TABLE 1 - Estimation of the values of the length (mm)
of implants in dried skulls from 3D-CT (examiners 1 and 2).
Skull
Estimated size of implant (CT)
Examiner 1 Examiner 2
Right Left Right Left
1 37.5 42.6 37.3 36.5
2 – – – –
3 40.0 41.7 38.7 40.8
4 39.5 40.0 41.4 41.0
5 41.5 40.4 40.7 40.3
6 42.8 42.2 41.8 41.7
7 45.5 42.4 45.5 39.4
8 46.0 43.7 44.8 42.4
9 41.9 38.2 40.7 37.1
10 44.6 40.1 42.6 37.1
TABLE 2 - Values of the length (mm) of implants in dried skulls during surgery.
Skull Size of zygomatic implant (Surgery)
Right Left
1 40.0 40.0
2 35.0 35.0
3 45.0 37.5
4 42.5 45.0
5 50.0 45.0
6 47.5 47.5
7 40.0 37.5
8 47.5 45.0
9 45.0 45.0
10 40.0 42.5
TABLE 3 - Descriptive statistics of the measurements of the length (mm) of implants for examiner 1 (e1), examiner
2 (e2), and the surgeon (s).
Variant n Mean SD Cv Min 0.25 Median 0.75 Max
sm 18 43.47 3.65 8.39 37.50 40.00 45.00 45.00 50.00
e1 18 41.70 2.34 5.61 37.50 40.00 41.80 42.80 46.00
e2 18 40.54 2.54 6.26 36.50 38.70 40.75 41.80 45.50
matic bone anatomy indicates the necessity for a planning system with the excellence of 3D-CT. The extra effort is appropriate when weighed against the occasional risk involved when the planning steps are not respected.6,11,14,22,23
Pre-surgical planning for dental implants is crucial for the success of the treatment in the long term. The imaging examination, which checks the data as close to reality as possible, is an essential element in this process.9
The smallest measurement error was –5.5 mm and the largest was +8.5 mm for examiner 1, and –5.5 mm and +9.29 mm for examiner 2.
The method was considered acceptable (sug-gesting, through 3D-CT, three possible lengths of implants for the surgical procedure), although the use of an insertion guide and a probe with more accurate markings should be incorporated.
The probe which comes with the kit for zygo-matic fixation has intervals of 5 to 5 mm, and 30 to 50.0 mm.15 Based on literature reports, clinical
findings and on the sample used in this research, the majority of these fixations are 42 mm, thus a probe with more accurate intervals, following clini-cal reality, is crucial.
The variation in the dimensions of the zygo-matic bone may lead to errors, even with 3D plan-ning, generating potential risk.14,21,22 The deviations
from the planning, which occur at surgery, may be explained by factors such as limitations in mouth opening and a more posterior position of the bone structures to be implanted.4
The internal anatomic reference necessary for the insertion of the fixation (5 mm above the alveolar ridge), as established by the surgeon, dif-fers from the external reference estimated by the radiologist. Establishing a point leading exactly to this external reference from the point of insertion
made internally requires a standardized language. 3D-CT is reproducible, taking into consideration anatomical points.19,21 On the other hand, the
sur-gery involved the surgeon’s experience and the use of an inaccurate probe.
Buccal markers should be adopted corre-sponding to the palatal insertion established in the pre-surgical clinical evaluation.
Agreement between the radiologist’s and the surgeon’s language may be obtained by using in-sertion guides. The cause of this discrepancy in the results was the fact that examiners 1 and 2, using 3D-CT, measured one place for implant insertion and the surgeon inserted it in a different place.
CONCLUSIONS
The gold standard was found to be inaccurate, and a change in the scale of the probe is suggested. The accuracy of the surgical measurement and the measurements by examiners 1 and 2 was 8.4%, 5.6% and 6.2%, respectively; the surgical result was the least accurate and examiner 1’s results were the most accurate.
There was agreement between the surgeon and the two examiner’s CT measurements, when the safety margin was 10 mm (gap of ± 5.0 mm).
3D-CT is a valuable and accurate tool, avail-able for pre-surgery planning of zygomatic fixa-tion. Insertion guides, as part of the surgical tools, and more accurate probes are necessary in order to obtain reliable measurements for the surgical procedure.
TABLE 4 - Distribution of the measurements in each variation gap tested.
Variation gaps (mm) n %
2.5 4 22.00
3.0 6 33.33
3.5 7 38.89
4.0 7 38.89
4.5 8 44.44
5.0 14 77.78
GRAPH 1 - Distribution of the measurements within each variation gap tested (n = 18).
0 22
33.33 38.89 38.89
44.44
77.78
10 20 30 40 50 60 70 80 90
2.5 3 3.5 4 4.5 5
Pe
rce
n
ta
g
e
%
REFERENCES
1. Adell R, Lekholm U, Gröndahl K, Bränemark PI, Lindstrom L, Jacobsson M. Reconstruction of severely resorbed maxil-lae using osseointegrated fixtures in immediate autogenous grafts. Int J Oral Maxillofac Implants. 1990;5(3):233-46. 2. Balshi TJ, Wolfinger GL. Treatment of congenital
ectoder-mal dysplasia with zigomatic implants: a case report. Int J Oral Maxillofac Implants. 2002;17(2):277-81.
3. Bedrossian E, Stumpel III L, Beckely M, Indersano T. The zygomatic implant: preliminary data on treatment of se-verely resorbed maxillae. A clinical report. Int J Oral Maxil-lofac Implants. 2002;17(6):861-5.
4. Bezerra FJ, Azoubel E. Alternativas cirúrgicas no tratamen-to da maxila atrófica. In: Bezerra FJB, Lenharo A. Terapia clínica avançada em implantodontia. São Paulo: Artes Mé-dicas; 2002. p. 159-92.
5. Boyes-Varley J, Howes DG, Lownie JF, Blackbeard GA. Sur-gical modifications to the Bränemark zygomaticus protocol in the treatment of the severely resorbed maxilla: a clinical report. Int J Oral Maxillofac Implants. 2003;18(2):232-7. 6. Cavalcanti MG, Yang J, Ruprecht A, Vannier MW.
Valida-tion of spiral computed tomography for dental implants. Dentomaxillofac Radiol. 1998;27(6):329-33.
7. Dutra V. Diagnóstico por imagens em implantodontia. In: Dinato JC, Polido WD, editores. Implantes osseointegrados: cirurgia e prótese. São Paulo: Artes Médicas; 2001. p. 45-61.
8. Fanton RFQ. Manual básico introdutório à tomografia com-putadorizada. São Paulo: INCOR; 1990.
9. Frederiksen NL. Diagnostic imaging in dental implantol-ogy. Oral Surg Oral Med Oral Pathol Oral Radiol Endod. 1995;80(5):540-54.
10. Henry PJ. A review of guidelines for implant reha-bilitation of the edentulous maxilla. J Prosthet Dent. 2002;87(3):281-8.
11. Jacobs R, van Steenberghe D. Radiographic plan-ning and assessment of endosseous oral implants. Berlin: Springer-Verlag; 1998.
12. Matsumoto MA, Francischone CE, Sartori IMA, Tokut-sune E, Nary Filho H. Fixação zigomática. Pesqui Odontol Bras. 2000;14 (Suppl 1):21.
13. Nary Filho H, Ilg JP. Atrofia severa de maxila. In: Di-nato JC, Polido WD, editores. Implantes osseointegrados: cirurgia e prótese. São Paulo: Artes Médicas; 2001. p. 343-72.
14. Nkenke E, Hahn M, Lell M, Wiltfang J, Schultze-Mosgau S, Stech B et al. Anatomic site evaluation of the zygomatic bone for dental implant placement. Clin Oral Implants Res. 2003;14(1):72-9.
15. Nobel Biocare AB. Zygomatic fixation protocol manual. Sweden: Göteborg; 2000.
16. Poon CK, Barss TK, Murdoch-Kinch CA, Bricker SL, Miles DA, van Dis ML. Presurgical tomographic assessment for dental implants. 1. A modified imaging technique. Int J Oral Maxillofac Implants. 1992;7(2):246-50.
17. Renouart F, Rangert B. Fatores de risco em implanto-dontia – planejamento clínico simplificado para prognóstico e tratamento. Chicago: Quintessensse; 2001.
18. Rigolizzo MB. Bases anatômicas para ancoragem de implantes osseointegrados [Dissertação de Mestrado]. Bau-ru: Universidade do Sagrado Coração; 2002.
19. Rothman SG. Dental applications of computerized tomography: surgical planning for implant placement. Chi-cago: Quintessence Books; 1998.
20. Todd AD, Gher M, Quintero G, Richardson A. Interpre-tation of linear and computed tomograms in the assessment of implant recipient sites. J Periodontol. 1993;64(12):1243-9.
21. Uchida Y, Masaaki G, Katsuki T, Akiyoshi T. Measure-ment of the maxilla and zygoma as an aid in installing zygo-matic implants. J Oral Maxillofac Surg. 2001;59(10):1193-8.
22. van Steenberghe D, Malevez C, van Cleynenbreugel J, Serhal CB, Dhoore E, Schutyser F et al. Accuracy of drilling guides for transfer from three-dimensional CT-based plan-ning to placement of zygoma implants in human cadavers. Clin Oral Implants Res. 2003;14(1):131-6.
23. Williams MY, Mealey BL, Hallmon WW. The role of computerized tomography in dental implantology. Int J Oral Maxillofac Implants. 1992;7(3):373-80.