ABSTRACT: The microhardness of a bleaching-shade resin composite polymerized with different light-curing units was evaluated. Composite samples (3M ESPE Filtek Supreme) were applied to brass rings (2 mm in thickness, 5 mm in diameter). Three commercial LED lights were used to polymerize the specimens and the results were com-pared to those of a conventional halogen light. The light sources used in the present study were: Demetron Optilux 401 (QTH), 3M ESPE Elipar FreeLight (LED 1); Kerr L.E.Demetron I (LED 2), and ColtoluxLED lights (LED 3). The microhardness of the top and bottom surfaces was assessed with a digital Vickers hardness-measuring instru-ment, under load. At the bottom surface, no signiicant difference among the light sources was observed (two-way ANOVA). At the top surface, the QTH light source presented signiicantly higher hardness values compared to the values observed when LED 1 and LED 3 were used. There were no signiicant differences between the QTH and LED 2 light sources. Signiicantly higher hardness values were also found at the top surface when compared to the values observed at the bottom surface. The power density of the polymerization light sources seemed to be respon-sible for the observed resin composite hardness, not their irradiance.
DESCRIPTORS: Composite resins; Dental materials; Hardness.
RESUMO: Avaliou-se a microdureza de uma resina composta para dentes clareados fotoativada com diferentes fon-tes de luz fotoativadora. Espécimes de resina composta (3M ESPE Filtek Supreme) foram aplicados a cilindros de latão (2 mm de espessura, 5 mm de diâmetro). Três fontes comerciais de luz LED foram utilizadas para polimerizar os espécimes e os resultados foram comparados aos obtidos utilizando-se uma fonte de luz halógena convencional. As fontes de luz utilizadas no presente estudo foram: Demetron Optilux 401 (QTH), 3M ESPE Elipar FreeLight (LED 1); Kerr L.E.Demetron I (LED 2), e ColtoluxLED lights (LED 3). A microdureza das superfícies topo e base foram avaliadas com um microdurômetro digital (Dureza Vickers), sob aplicação de carga. Na superfície base não se observou diferença signiicante entre as fontes de luz utilizadas (ANOVA, dois critérios). Na superfície topo, a fonte de luz QTH apresentou valores de dureza signiicantemente maiores quando comparado aos valores apresen -tados quando LED 1 e LED 3 foram utilizadas. Não houve diferença signiicante entre QTH e LED 2. Observou-se também diferença signiicante entre os valores das superfície topo, que foram signiicantemente superiores, e base. A densidade de potência das fontes de luz fotoativadoras mostrou ser responsável pela dureza da resina composta e não a irradiância.
DESCRITORES: Resinas compostas; Materiais dentários; Dureza.
INTRODUCTION
Composite depth of cure varies with the amount of light penetrating the bulk material, with the exposure time, and with its composition.18
Ba-sically, the light output intensity determines the rate and extent of the polymerization process.21
However, the amount of light available to excite
the photoinitiator dramatically decreases from the top surface inward as a result of light absorption and scattering22 by the composite itself or by the
surrounding tissues/materials.6
Current light-curing units should produce adequate mechanical properties of resin-based
* Graduate Student; **Assistant Professors, Department of Restorative Dentistry; ***Assistant Professors, Department of Periodon-tics; ****Professor and Section Director, Department of Restorative Dentistry – School of Dentistry, University of Ponta Grossa.
Hardness of a bleaching-shade resin composite polymerized with
different light-curing sources
Microdureza de uma resina composta para dentes clareados
polimerizada com diferentes fontes de luz fotoativadora
restorative materials, although these properties at the bottom surface may be significantly inferior than at the top surface of the resin composite. Res-in polymerization should be optimized Res-in order to resist deterioration of the mechanical and chemi-cal properties: strength, hardness, stiffness, and wear resistance.5 However, there is no consensus
on the ideal power density needed to obtain opti-mal energy density, on the irradiance of the light source, and on the exposure time needed to cure resin composite sufficiently.7 These parameters
are of particular interest since, in practice, they are under control of the clinician.4,11
A wide variety of light-curing devices are cur-rently available.3,21 LED units generate power
densi-ty over a narrow spectral region within which cam-phorquinone, the commonly used photoinitiator, is known to abundantly absorb energy.12 On the other
hand, QTH and PAC lights are known to emit a comparatively much wider spectral range, covering even more of the region in which camphorquinone absorbs.4,12 It has been claimed that first- and
sec-ond-generation LED lights are not able to effectively polymerize bleaching-shade resin composites.20
Be-cause of its yellowish color, camphorquinone has been replaced by short wavelength excited photo-initiators in these restorative materials.14,20 As long
as LED units generate power density over a narrow spectral region,12 clinicians must be aware that the
wavelengths of the light emitted will not polymerize certain products having photoinitiators other than the conventional camphorquinone.
The purpose of this study was to evaluate the influence of different LED lights on the micro-hardness of a commercial bleaching-shade resin composite. Light units were selected to represent a variety of commonly used classifications: a con-ventional quartz-tungsten-halogen (QTH) light, a first-generation LED light source, and two sec-ond-generation light-emitting diodes. The following research hypotheses were tested relative to the values observed when using a conventional QTH light: (1) there will be no difference in the resin
composite microhardness values produced when using the different light sources; (2) comparing the mechanical properties of the top and bottom sur-faces of the specimen, the microhardness values of the restorative material will be similar irrespective of the light-curing sources used to polymerize it.
MATERIALS AND METHODS
Characterization of the light-curing units The spectral irradiant distribution of each light was previously measured using a laboratory-grade spectral radiometer with a 3-inch integrating sphere (DAS 2100, LabSphere Inc., North Sutton, NH, USA). The area under the spectral profile was integrated from 350 to 750 nm to provide total power emitted. Five replications were obtained for each light source and then the average total power was calculated (mW). The power was then divided by the cross sectional area of the fiberoptic tip (cm2)
to calculate power density (mW/cm2). Light
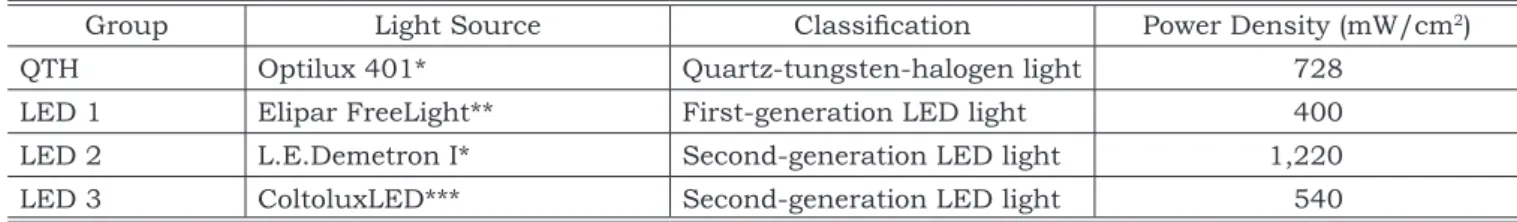
inten-sity was monitored throughout the experiment to ensure that a consistent intensity was maintained. The light-curing units used in the present study and the measured power density are described in Table 1. The differences in spectral emission pro-files are seen in Graph 1. The conventional quartz-tungsten-halogen light was used as control.
Specimen fabrication for microhardness analysis
A composite resin (Shade YT, Filtek Supreme, 3M ESPE, St. Paul, MN, USA) was evaluated in the present study. The restorative material was inserted into brass rings (2-mm thick, 5 mm in diameter). After resin application, a Mylar strip was applied to the surface of the unpolymerized resin composite, followed by the use of a glass slide to exert pressure and ensure proper adaptation of the composite. The glass slide was then removed, leaving the Mylar strip, after which the light-curing process was initiated. The light-curing tips were
TABLE 1 - Experimental groups and respective power density values.
Group Light Source Classiication Power Density (mW/cm2)
QTH Optilux 401* Quartz-tungsten-halogen light 728
LED 1 Elipar FreeLight** First-generation LED light 400
LED 2 L.E.Demetron I* Second-generation LED light 1,220
LED 3 ColtoluxLED*** Second-generation LED light 540
positioned at 0.1 mm from the top of the Mylar surface.
The resin composite was polymerized for 20 seconds according to the manufacturer’s in-structions. Five replications of each group were ob-tained. The top and bottom surfaces were divided into four areas and two readings of each area were taken at random positions. The microhardness of the upper and lower surfaces was assessed with a digital Vickers hardness-measuring instrument under load (HMV-2 Shimadzu, Shimadzu Scientific Instruments, Kyoto, Japan). The specimens were positioned centrally beneath the indenter of the hardness tester. The indentation was made with a 50 g load for 30 seconds, with a dwell time of 15 seconds.
The average Vickers hardness values of the five samples was obtained according to the light groups. The difference in microhardness between the upper and lower surfaces in each group was also analyzed. Statistical analysis of each param-eter was performed using a two-way ANOVA test among the different curing conditions. Tukey’s post-hoc test was performed as a multiple com-parison test, at a pre-set alpha of 0.05.
RESULTS
The QTH light provided a moderate to high power density, broad-banded spectral emis-sion (728 mW/cm2) ranging from 355 to 515 nm
(Graph 1). The lowest power density level was pro-duced by LED 1 (Elipar FreeLight) with a narrow spectral emission profile (400 mW/cm2). The
sec-ond-generation LED 2 provided the highest pow-er density, also within a narrow spectral region
(Graph 1). The power emitted from LED 2 exceeded that of the QTH light, within a narrow spectral band. LED 3 provided a similar narrow spectrum compared to that of the other LED lights, but at a low power density level (540 mW/cm2). The
spec-tra of LED lights vary in a range within which the photoinitiator camphorquinone characteristically absorbs energy (425 to 490 nm, with a peak of about 465 nm).
Table 2 displays the mean hardness values for the various light groups. The highest hardness val-ues were seen both at the top and bottom surfaces (69.75 and 62.73 respectively) when the QTH light was used to polymerize the bleaching shade resin composite. Statistical analysis showed that there was no statistical significance at the bottom sur-face when different light units were used. At the top surface, the QTH light provided significantly higher hardness values compared to when both the LED 1 and LED 3 were used (67.87 and 66.45 respec-tively). Using the LED 3 unit, the lowest hardness values were observed at both the top and bottom surfaces (66.45 and 60.96, respectively).
Statistical analysis also demonstrated signifi-cantly higher hardness values at the top surface compared to the values seen at the bottom surface (Table 3).
GRAPH 1 - Spectral proile of irradiance of the
light-curing units. 350 0 5 10 15 20
400 450 500 550 600
Wavelength (nm)
m
W
/n
m
QTH
LED 3
LED 2
LED 1
TABLE 2 - Vickers microhardness results and statisti-cal analysis.
Light source Surface Vickers hardness (± SD)
QTH Top 69.75 ± 1.59
a
Bottom 62.73 ± 1.57c
LED 1 Top 67.87 ± 0.79
b
Bottom 61.05 ± 0.87c
LED 2 Top 68.95 ± 1.45
a
Bottom 62.21 ± 0.65c
LED 3 Top 66.45 ± 2.44
b
Bottom 60.96 ± 2.21c
n = 5. Top surface results: Superscript letter a, and b: signifi-cantly different (p < 0.05). Bottom surface results: Superscript letter c: not significant (p > 0.05).
TABLE 3 - Comparison between top and bottom sur-faces.
Surface Vickers hardness (± SD)
Top 68.25 ± 1.99a
Bottom 61.74 ± 1.54b
DISCUSSION
The first hypothesis was proven not valid by the experimental data. Statistically higher hardness values were found when the QTH light was used to polymerize the resin composite compared to when both the first-generation LED 1 and the second-gen-eration LED 3 were used. When the hardness values of the halogen light were compared to those of LED 2, statistically equivalent values were observed. The reason that explains the significantly lower hardness mean value when both LED 1 (Elipar FreeLight) and LED 3 (ColtoluxLED) were used seems to be related to their power density. Even though there is no light attenuation at the top surface when polymerizing the resin composite, both the halogen light and LED 2 (L.E.Demetron) produced higher hardness values when compared to the other lights.
To achieve bright white or translucent shades of resins, some manufacturers find it necessary to use less camphorquinone or another photoinitiator altogether.15 Photoinitiators such as
1-phenyl-1,2-propanedione (PPD) are photosensitizers of poten-tial value in reducing color problems associated with visible light-cured dental resins.17 In
combi-nation with camphorquinone, it acts synergisti-cally to produce a more efficient photoinitiation reaction.17 The PPD photoinitiator is excited at a
shorter wavelength (violet, at 405 nm).20 The
ab-sence of the photoinitiator camphorquinone in the resin composite used in the present study would certainly determine a lower effectiveness of both the generations of LED lights used. One can infer that both camphorquinone and the PPD photoini-tiator could be present in the resin composition as the QTH hardness values were higher than those of all the LED lights. On the other hand, the QTH values were equivalent to the values presented when LED 2 was used. In addition, at the bottom surface, when different light sources were used, no statistical difference were observed. Thus, it can be assumed that it might be not the irradiance, but rather the spectral output of the polymerization unit power density which is responsible for the bleaching-shade resin composite hardness. It can also be inferred that the presence of a photoinitia-tor other than camphorquinone is questionable.
The second hypothesis was also not upheld by the experimental data. Dissimilar hardness values were found when the top surface was compared to the bottom surface (Top: 68.25 ± 1.99; Bottom: 61.74 ± 1.54; p < 0.05). The top surface presented statistically higher hardness values compared to
the values found at the bottom surface (Table 3). The difference found when comparing the top and bottom hardness values can be explained by the fact that the amount of light available to excite the photoinitiator dramatically decreases from the top surface inward as a result of light absorption and scattering by the composite itself.6,21 Deeper
in the composite, light attenuation results in fewer excited camphorquinone molecules, a commonly used photoinitiator, and the probability of colli-sion with an amine decreases dramatically.22 The
mobility of the developing polymer chains becomes progressively more restricted as a consequence of the increase in viscosity, reduction in the free vol-ume, formation of microgels, and entanglement.16
The network becomes rigid and the chains become essentially immobile, and the propagation reaction is diffusion limited; thus, the overall conversion rate decreases.1 Some authors suggested that the
depth of cure may be defined as the level at which the hardness value is equivalent to at least 90% of the hardness at the top of the composite.13 It has
been also suggested that the gradient should not exceed 10 to 20% (hardness ratio of 0.8 or great-er).19 According to the results of the present study,
all light sources fulfilled this criterion effectively after polymerizing the 2-mm thick specimens.
Studies suggest that depth of polymerization, and consequently microhardness,23 is affected not
only by composite-related factors but also by light-related factors.25 Composite-related factors include
shade, translucency, and filler particle size, load and distribution. Light-related factors include light intensity, spectral distribution and expo-sure time.2,26 In the present study, different LED
lights were used to polymerize a bleaching-shade resin composite, and compared to a conventional QTH light. It was hypothesized that the LED lights would not be able to effectively polymerize this specific resin composite. According to the results, the hardness values of LED 2 were similar to the values observed when the halogen light was used. Despite the significant difference at the top sur-face between QTH and LED 1/LED 3, the values were quite high. There appears to be a good cor-relation between decreasing degree of conversion and decreasing hardness,8 fracture toughness,9
and abrasive wear resistance.10 To compensate for
using first-generation LED curing lights required considerably longer exposure durations than using the QTH curing light to adequately polymerize a resin composite.14
CONCLUSIONS
Under the conditions of this in vitro study, it can be concluded that:
1. The microhardness of a commercial bleaching-shade resin composite was influenced by the use of different LED light sources when com-pared to that produced by a halogen control (hypothesis 1 rejected);
2. The hardness values found at the bottom sur-face of the specimen were lower compared to the values observed at the top surface (hypoth-esis 2 rejected).
REFERENCES
1. Andrzejewska E. Kinetics of network formation during photopolymerization. Trans Acad Dent Mater. 2004;18:69-80.
2. Braga RR, Ferracane JL. Contraction stress related to degree of conversion and reaction kinetics. J Dent Res. 2002;81(2):114-8.
3. Burgess JO, Walker RS, Porche CJ, Rappold AJ. Light curing – an update. Compend Contin Educ Dent. 2002;23(10):889-96.
4. Daronch M, Rueggeberg F, de Goes MF. Monomer conver-sion of pre-heated composite. J Dent Res. 2005;85(7):663-7.
5. Davidson-Kaban SS, Davidson CL, Feilzer AJ, de Gee AJ, Erdilek N. The effect of curing light variations on bulk cur-ing and wall-to-wall quality of two types and various shades of resin composites. Dent Mater. 1997;13(6):344-52. 6. Emami N, Soderholm KJ, Berglund LA. Effect of light power
density variations on bulk curing properties of dental com-posites. J Dent. 2003;31(3):189-96.
7. Ernst CP. Clinical aspects of photopolymerization. In: Sci-entific insights into dental ceramics and photopolymer networks. Geneva: Academy of Dental Materials; 2004. p. 105-17.
8. Ferracane JL. Correlation between hardness and degree of conversion during the setting reaction of unfilled dental restorative resins. Dent Mater. 1985;1(1):11-4.
9. Ferracane JL, Berge HX. Fracture toughness of experi-mental dental composites aged in ethanol. J Dent Res. 1995;74(7):1418-23.
10. Ferracane JL, Mitchem JC, Condon JR, Todd R. Wear and marginal breakdown of composites with various de-grees of cure. J Dent Res. 1997;76(8):1508-16.
11. Halvorson RH, Erickson RL, Davidson CL. Energy dependent polymerization of resin-based composite. Dent Mater. 2002;18(6):463-9.
12. Hammesfahr PD, O’Connor MT, Wang X. Light-curing technology: past, present, and future. Compend Contin Educ Dent. 2002;23(9 Suppl 1):18-24.
13. Johnston WM, Leung RL, Fan PL. A mathematical model for post-irradiation hardening of photoactivated com-posite resins. Dent Mater. 1985;1(5):191-4.
14. Leonard DL, Charlton DG, Roberts HW, Cohen ME. Polymerization efficiency of LED curing lights. J Esthet Restor Dent. 2002;14(5):286-95.
15. Neumann MG, Miranda WG Jr, Schmitt CC, Ruegge-berg FA, Correa IC. Molar extinction coefficients and the photon absorption efficiency of dental photoinitiators and light curing units. J Dent. 2005;33(6):525-32.
16. Neves AD, Discacciati JA, Orefice RL, Yoshida MI. Influence of the power density on the kinetics of photopo-lymerization and properties of dental composites. J Biomed Mater Res B Appl Biomater. 2005;72(2):393-400.
17. Park YJ, Chae KH, Rawls HR. Development of a new photoinitiation system for dental light-cure composite res-ins. Dent Mater. 1999;15(2):120-7.
18. Pianelli C, Devaux J, Bebelman S, Leloup G. The mi-cro-Raman spectroscopy, a useful tool to determine the degree of conversion of light-activated composite resins. J Biomed Mater Res. 1999;48(5):675-81.
19. Pilo R, Cardash HS. Post-irradiation polymerization of different anterior and posterior visible light-activated resin composites. Dent Mater. 1992;8(5):299-304.
20. Price RB, Felix CA, Andreou P. Evaluation of a dual peak third generation LED curing light. Compend Contin Educ Dent. 2005;26(5):331-8.
21. Rueggeberg F. Contemporary issues in photocuring. Compend Contin Educ Dent Suppl. 1999;(25):S4-15; quiz S73. 22. Rueggeberg FA, Caughman WF, Curtis JW Jr, Davis
HC. Factors affecting cure at depths within light-activated resin composites. Am J Dent. 1993;6(2):91-5.
23. Rueggeberg FA, Craig RG. Correlation of parameters used to estimate monomer conversion in a light-cured com-posite. J Dent Res. 1988;67(6):932-7.
24. Ruyter IE, Oysaed H. Conversion in different depths of ultraviolet and visible light activated composite materials. Acta Odontol Scand. 1982;40(3):179-92.
25. Vandewalle KS, Ferracane JL, Hilton TJ, Erickson RL, Sakaguchi RL. Effect of energy density on properties and marginal integrity of posterior resin composite restorations. Dent Mater. 2004;20(1):96-106.
26. Yearn JA. Factors affecting cure of visible light acti-vated composites. Int Dent J. 1985;35(3):218-25.