Socio-demographic correlates of leisure time
physical activity among Portuguese adults
Correlatos sociodemográficos da prática de
atividade física de portugueses adultos
nos momentos de lazer
Factores sociodemográficos de la actividad física
en el tiempo de ocio de los adultos portugueses
1 Faculdade de Motricidade Humana, Universidade de Lisboa, Lisboa, Portugal. 2 Unidade de Investigação e Desenvolvimento em Educação e Formação, Universidade de Lisboa, Lisboa, Portugal. 3 Research Center in Sports Sciences, Health Sciences and Human Development, University Institute of Maia, Maia, Portugal.
4 Instituto Universitário de Lisboa, Centro de Investigação e Estudos de Sociologia, Lisboa, Portugal. 5 Faculdade de Educação Física e Desporto, Universidade Lusófona de Humanidades e Tecnologias, Lisboa, Portugal.
Correspondence A. Marques
Centro Interdisciplinar de Estudo da Performance Humana, Faculdade de Motricidade Humana, Universidade de Lisboa. Estrada da Costa, Cruz Quebrada / Lisboa 1499-002, Portugal.
Adilson Marques 1 João Martins 1,2 Hugo Sarmento 3
Madalena Ramos 4
José Diniz 1
Francisco Carreiro da Costa 1,5
Abstract
This study aimed to identify socio-demographic correlates of leisure time physical activity among Portuguese adults. Subjects aged 31-60 years (1,076 males, 1,383 females) were categorized into two groups according to recommended physical activities ranging from ≥ 10 or < 10 MET.hours.week-1. Leisure time physical activ-ity data was self-reported, including activities, duration of each session and frequency. Chi-square and logistic regression analyses were ap-plied to the results. Among men, having a high socioeconomic status (OR = 1.89; 95%CI: 1.30-2.76; p = 0.001) was associated with attaining the recommended level of physical activity. For women, middle education levels were associ-ated with physical activity (OR = 1.36; 95%CI: 1.01-1.85). Moreover, middle socioeconomic sta-tus (OR = 1.45; 95%CI: 0.80-1.91; p = 0.009) was also positively associated with meeting physical activities recommendations in the unadjusted analysis. Men and women had different patterns of socio-demographic correlates. An intervention designed to improve the levels of physical activ-ity among Portuguese adults may take these cor-relates into account.
Leisure Activities; Motor Activity; Adult
Resumo
O objetivo do estudo foi identificar os correlatos sociodemográficos associados à atividade física dos adultos portugueses nos momentos de lazer. Sujeitos com idades entre os 31-60 anos (1.076 homens, 1.383 mulheres) foram categorizados como fisicamente ativos ou pouco ativos, de acordo com as recomendações da atividade físi-ca (≥ 10 MET.horas/semana ou < 10 MET.horas/ semana). A atividade física foi autorreportada. O teste do qui-quadrado e regressões logísticas foram aplicados aos dados. Para os homens, um estatuto socioeconômico elevado estava asso-ciado ao cumprimento das recomendações da atividade física (OR = 1,89; IC95%: 1,30-2,76; p = 0,001). Para as mulheres, o nível educacional médio (OR = 1,36; IC95%: 1,01-1,85) e um esta-tuto socioeconômico médio (OR = 1,45; IC95%: 0,80-1,91; p = 0,009) estavam associados a cum-prir as recomendações da atividade física. Ho-mens e mulheres apresentaram diferentes cor-relatos associados à prática de atividade física. Intervenções com o objetivo de melhorar os ní-veis de atividade física devem considerar os dife-rentes correlatos identificados.
Introduction
The importance of physical activity (PA) on health is well established. PA can protect against health problems such as cardiovascular disease 1,
diabetes 2, obesity 3, osteoarthritis 4, mortality 5,
cancers 6, metabolic syndrome 7, and mental
problems 8. Therefore promoting engagement
in regular PA is considered an important step for public health, preventing a wide range of chronic diseases 2,9.
Despite evidence of the health benefits of PA, many people do not exercise enough to benefit their health 10,11. Furthermore, PA levels tend to
decrease with age 10, which means that older ages
are at risk. Knowing that the percentage of the Portuguese population engaged in regular PA is among the lowest in the European Union 10,11,12,
it is important to understand the related factors of PA. The study of correlates of PA in Portugal is particularly important because in the past de-cades Portugal has undergone a demographic transition, going from a predominately rural country to one where most of the population lives in urban areas. Therefore, it is important to understand the habits of the people that are now living in urban areas and the correlates of PA participation.
A better understanding of the contributing factors of PA is critical in designing effective in-tervention programs. Moreover, increasing the PA levels of Portuguese people is also important for the prevention of overweight and obesity, since the rate of overweight and obesity among the Portuguese population is amongst the high-est in the European Union 13,14.
In spite of a growing emphasis on the impor-tance of PA in promoting health, factors related to PA among Portuguese adults remains unclear. PA is a multi-faceted behavior influenced by en-vironmental, psychological, social and demo-graphic variables. The study on non-modifiable socio-demographic variables, such as age and gender, suggest that some groups of adults are more likely to have lower PA levels and are in more need of interventions or that the interven-tions must be more tailored towards the specific characteristics of these groups 15,16. Other
socio-demographic variables, such as, socioeconomic status (SES) have shown mixed findings with re-gard to PA 17,18,19,20. Since quantitative research
that explores the correlates of PA is still rather limited among Portuguese adults, this study aimed to identify the socio-demographic cor-relates that explain the recommended PA level among Portuguese adults.
Methods
Participants
Participants took part in an on-going study of their lifestyles as parents, teachers and school staff from seven schools in the Lisbon Metro-politan Area. The study was related to schooling, physical education and the promotion of active lifestyles. It was a population-based study inves-tigating factors associated with physical activity in children, adolescents, their parents, teachers, and school staff. Schools were randomly se-lected. A questionnaire was distributed to 4,687 adults aged 31-60 years. Of the 4,687 adults who received the questionnaire, 2,780 replied (rep-resenting a response rate of 59.3%). Among the 2,780 respondents, a number were dropped from the analysis for the following reasons: 120 had missing gender data, 57 reported physical limita-tions to practicing PA, 69 did not report informa-tion related to SES, and 75 had missing data for educational levels. The final sample was made up of 2,459 adults (1,076 male and 1,383 female) aged 31-60 years (43.4±6.1). The study was con-ducted according to ethical standards in sport and exercise science research 21, and received
approval from both the Ethics Council of the Faculty of Human Kinetics at the University of Lisbon and the Portuguese Data Protection Au-thority. Informed written consent was obtained from each participant.
Measures of physical activity
Leisure time PA (LTPA) was assessed by a self-report questionnaire. All participants were asked to report the details of their LTPA, including the activities, duration of each session, and fre-quency (number of sessions per week). In total, there were 22 activities adapted from Telama et al. 22. The test-retest reliability of the LTPA
ac-tivities was carried out within a one-week inter-val across 100 participants. These participants were recruited from among teachers, staff and students’ parents. They were approached after attending a parent meeting at the school and asked to voluntarily fill out the questionnaire. One week later, when they went to school to at-tend another meeting, they were asked to fill out the same questionnaire again. Using intra-class correlation coefficient (ICC), the reliability was high (ICC = 0.90 to 0.95). A metabolic equivalent (MET) value was assigned to each reported LTPA, as used in previous studies 23,24. The activities
were classified as light (< 3 METs), moderate (3-6 METs) and vigorous (> 6 METs) 25. Based on the
Con-trol and Prevention (CDC)/American College of Sports Medicine (ACSM) 26, the participants were
considered to have met the recommended PA levels if they reported engaging in moderate PA (MPA) ≥ 5 days per week for ≥ 30 minutes each day and/or vigorous PA (VPA) ≥ 3 days per week for ≥ 20 minutes each day, or both, achieving at least 10 MET-minute.hr.wk-1. Those participants
who reported some activity, but at a lower level than that recommended, were classified as not meeting the recommendation.
Socio-demographic variables
Socio-demographic variables included gender, age, SES and education levels. Age was classified in age-groups as follows: 31-40, 41-50, and 51-60 years old. SES was based on occupation and edu-cational level. Occupation titles were regrouped in order to classify the subjects as lower, middle, and upper class. The lower class included skilled and unskilled manual workers, farmers, and fish-ermen; the middle class included service occu-pations, such as nonprofessional health service workers, office clerks, and salespeople; the upper class comprised business-owners, executives, university-educated specialists and profession-als 27. Education level was based on the
Portu-guese educational system and grouped into three categories: 9 years of education or less (lower), 10-12 years of education (middle), and more than 12 years (high).
Procedures
Self-administered questionnaires were complet-ed by school teachers, school staff members and parents. After completing the informed written consent form, teachers and members of staff re-ceived an envelope containing a questionnaire and a letter explaining the purpose of the study. They were asked to complete the questionnaire and return it within two days. For the parents, students were asked to take home two envelopes (one for the father and one for the mother) each containing a questionnaire; a letter explaining the objectives of the study, instructions for com-pleting the questionnaire; and an informed writ-ten consent form. After completing the informed written consent form and the questionnaire, par-ents put them inside the envelopes and sealed them. The students then returned their parents’ sealed envelopes and gave them to the research team. After receiving the questionnaires, the data was added to a data base for analysis.
Statistical analysis
Bivariate relationships between PA (meeting PA recommendation vs. not meeting PA recom-mendation), age, SES, and educational level were tested using the chi-square test. The effects of each independent variable (age groups, SES, and educational level) on the categories of LTPA were assessed by logistic regression. Unadjusted and adjusted odds ratios (OR) with 95% confi-dence intervals (95%CI) were calculated. For the unadjusted model, PA was tested against each independent variable. Adjustments were then made for all studied variables and the model was also adjusted for body mass index (BMI). The OR was calculated against the reference catego-ries of subjects aged 31-40 years old, lower SES, and those with basic education. An OR greater than one reflects an increased likelihood of the recommended level of PA. The analyses were stratified by gender. All statistical analysis was performed using IBM SPSS Statistics 20.0 (IBM Corp., Armonk, USA). The significance level was set at 0.05.
Results
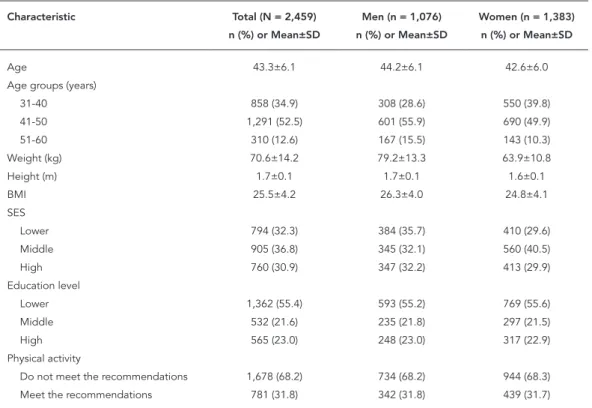
The general sample characteristics are present-ed in Table 1. The proportion of the total sub-jects who achieved the recommended PA levels in their LT (MPA ≥ 5*30 min/wk and/or VPA ≥ 3*20 min/wk, or both, achieving at least 10 MET-minute.hr.wk-1) was 31.8%. Most of the
respon-dents were 41-50 years of age (52.5%), which is understandable, because many had children attending elementary and secondary schools; 32.2%, 36.8%, and 30.9% were classified as hav-ing a lower, middle and high SES, respectively; 55.4% reported lower education levels, 21.6% had graduated from high school, and 23% had a uni-versity degree.
Table 2 shows the comparison of socio-de-mographic characteristics and correlates of LTPA between the two groups with different levels of LTPA according to the PA recommendations. The subjects who met PA recommended guidelines in leisure time accounted for a large percentage in the highest SES for men (χ2(2) = 13.238, p =
0.001) and middle SES for women (χ2(2) = 8.350,
p = 0.015). In addition, among women, those who met the PA recommendations were likely to have a lower education level (χ2(2) = 7.389, p = 0.025).
There were no significant differences related to age for either genders.
tendency of meeting PA recommendations. For women, middle SES (p = 0.009), and middle level of education (p = 0.007) had a 45% and a 47% greater chance of meeting PA recommendations during leisure time, respectively.
Table 4 presents the results of the adjusted regression analysis. For men, having a high SES remained significant after adjusting variables, a 93% greater chance of being physically active at the recommended level than those with low SES (p = 0.001). For women, those with middle edu-cation levels had a 41% greater chance of being physically active at the recommended level than those with lower education levels (p = 0.032), and having a middle educational level increased the likelihood of meeting PA guidelines by 34% more than those with lower educational levels.
Discussion
The current study examined the link between socio-demographic factors and engagement in the recommended PA level for Portuguese adults. From the results, three main findings were iden-tified. First, age was not significantly related with PA, which differed from what was found in previous studies 10,16,17. High SES for men and
middle SES for women were linked to meeting PA recommendations, confirming that SES is a sig-nificant correlate of PA 17,19. Third, educational
levels were only related with meeting the PA rec-ommendation for women. Though not related to the main goal of the study, it was also found that 31.8% of the study participants were physically active and achieved the PA recommended levels during leisure time, similar to findings observed
Table 1
General characteristics of the study population by gender.
Characteristic Total (N = 2,459) Men (n = 1,076) Women (n = 1,383) n (%) or Mean±SD n (%) or Mean±SD n (%) or Mean±SD
Age 43.3±6.1 44.2±6.1 42.6±6.0
Age groups (years)
31-40 858 (34.9) 308 (28.6) 550 (39.8)
41-50 1,291 (52.5) 601 (55.9) 690 (49.9)
51-60 310 (12.6) 167 (15.5) 143 (10.3)
Weight (kg) 70.6±14.2 79.2±13.3 63.9±10.8
Height (m) 1.7±0.1 1.7±0.1 1.6±0.1
BMI 25.5±4.2 26.3±4.0 24.8±4.1
SES
Lower 794 (32.3) 384 (35.7) 410 (29.6)
Middle 905 (36.8) 345 (32.1) 560 (40.5)
High 760 (30.9) 347 (32.2) 413 (29.9)
Education level
Lower 1,362 (55.4) 593 (55.2) 769 (55.6)
Middle 532 (21.6) 235 (21.8) 297 (21.5)
High 565 (23.0) 248 (23.0) 317 (22.9)
Physical activity
Do not meet the recommendations 1,678 (68.2) 734 (68.2) 944 (68.3)
Meet the recommendations 781 (31.8) 342 (31.8) 439 (31.7)
BMI: body mass index; SD: standard deviation; SES: socioeconomic status.
in developed countries 16,28,29, but higher than in
some developing countries 23,24. This difference
may reflect the availability of and accessibility to PA recreational activities in developed coun-tries, since LTPA is not common in developing countries 30.
From the preliminary analysis of data, men are not more active than women, unlike other
studies which showed that women were less likely to engage in PA that meets the guidelines 16,28,29.
This result is interesting and suggests that the dif-ference between men and women observed in other studies, may be related to PA in the work-place and while commuting.
Table 2
Characteristics of subjects according to physical activity classification by gender.
Characteristic Men Women
Do not meet the recommendations
(%)
Meet the recommendations
(%)
p-value Do not meet the recommendations
(%)
Meet the recommendations
(%)
p-value
Age groups (years) 0.672 0.317
31-40 29.5 26.9 39.7 39.9
41-50 55.0 57.6 50.7 48.1
51-60 15.5 15.5 9.5 12.0
SES 0.001 0.015
Lower 38.8 28.9 31.3 26.2
Middle 32.0 32.3 37.9 46.0
High 29.2 38.9 30.8 27.8
Education level 0.125 0.025
Lower 57.3 50.6 57.7 51.0
Middle 20.8 24.0 19.6 25.5
High 21.9 25.4 22.7 23.5
SES: socioeconomic status.
Table 3
Associations between socio-demographic and physical activity.
Explanatory variables Meeting physical activity recommendations
Men Women
Unadjusted OR (95%CI) p-value Unadjusted OR (95%CI) p-value
Age groups (years)
31-40 1.00 (reference) 1.00 (reference)
41-50 1.15 (0.85-1.54) 0.373 0.94 (0.74-1.20) 0.640
51-60 1.09 (0.73-1.64) 0.673 1.26 (0.86-1.85) 0.235
SES
Lower 1.00 (reference) 1.00 (reference)
Middle 1.35 (0.98-1.86) 0.067 1.45 (1.10-1.91) 0.009
High 1.79 (1.31-2.45) < 0.001 1.08 (0.80-1.45) 0.637
Education level
Lower 1.00 (reference) 1.00 (reference)
Middle 1.30 (0.94-1.79) 0.108 1.47 (1.11-1.95) 0.007
High 1.31 (0.96-1.79) 0.091 1.17 (0.88-1.55) 0.272
95%CI: 95% confidence interval; OR: odds ratio; SES: socioeconomic status.
significant association was not found between age and recommended PA levels. Knowing that certain age groups could skew the results, those who were over 60 years of age were removed from the sample (since they were more likely to have al-ready retired). This was necessary because there have been mixed reports about the relationship between age and LTPA, with some studies
find-ing an increase of LTPA after the aforementioned age 12,23, whereas others show a decrease 32,33.
Table 4
Adjusted odds ratio for physical activity among Portuguese adults.
Explanatory variables Meeting physical activity recommendations
Men Women
Adjusted OR (95%CI) p-value Adjusted OR (95%CI) p-value
Age groups (years)
31-40 1.00 (reference) 1.00 (reference)
41-50 1.16 (0.84-1.60) 0.377 0.94 (0.72-1.22) 0.462
51-60 1.12 (0.73-1.72) 0.596 1.46 (0.97-2.21) 0.095
SES
Lower 1.00 (reference) 1.00 (reference)
Middle 1.22 (0.85-1.75) 0.275 1.41 (1.03-1.79) 0.032
High 1.93 (1.31-2.84) 0.001 1.01 (0.71-1.45) 0.951
Education level
Lower 1.00 (reference) 1.00 (reference)
Middle 1.29 (0.90-1.83) 0.162 1.34 (0.97-1.84) 0.044
High 0.86 (0.58-1.28) 0.463 1.17 (0.84-1.63) 0.356
95%CI: 95% confidence interval; OR: odds ratio; SES: socioeconomic status. Note: analyses were adjusted for body mass index.
regardless of age. Although differences among age groups were not found, some differences could have been noticed due to the fact that age is related to different stages of life. Usually, young adults (31-40) have good biological function and their physical performance is not limited 34.
Therefore, it was expected they would also have higher levels of PA. Most middle age adults are experiencing the demands of a growing family as well as an increase in body fat, and are more focused on their jobs. These facts could lead to a decrease in the levels of PA. Some years later, during later middle-age, women reach the meno-pause, men reduce their output of sex hormones and, for men and women career opportunities have commonly peaked. This could also lead to a decline of PA.
Data from this study indicates that, among men, low SES respondents were less likely to meet the PA recommendations in leisure time. This finding is consistent with a number of stud-ies that indicated that the highest prevalence of physical inactivity is among lower SES adults 17,19.
However, this is contrary to findings among young Portuguese individuals, where the influ-ence of SES on adolescents’ self-reported PA was not found 18. Our findings support the
hypoth-esis that higher SES adults are more likely to fol-low preventive programs and health-promoting behavior, whether due to greater motivation or access to resources. On the other hand, women with middle SES were more likely to meet the
rec-ommendation for PA in leisure time than those from low and high SES. This confirms that people with low SES have a limited ability to control their PA in the face of inaccessible environments 19,35.
With regard to women with high SES, one can only speculate that they generally have high con-trol, high daily demands and long work hours, which might therefore reduce their time avail-able for LTPA.
Educational levels were not associated with meeting PA recommendations for men, but were for women. This result is not consistent with previous investigations which showed that participants who achieved a higher educational level showed lower prevalence of a sedentary lifestyle 12,17. Nevertheless, results from Japan
are similar to this Portuguese study for men and women 29, despite the variance in cultural
prac-tices. Among women, the results showed that the most educated were more likely to attain the recommended PA levels. However, the same is not seen among men. Because this factor has a different effect on men and women, attention should be given to developing intervention pro-grams which aim to increase PA participation. These factors confirm Varo et al. 12, which stated
that the correlation between PA and education level is notentirely understood.
recreational facilities are related to LTPA 15,36.
These findings highlight the importance of sup-portive environments for LTPA and emphasize the need to incorporate factors at multiple levels of influence in interventions to promote PA 37.
It is expected that the intervention would be different in rural and urban areas, however, al-though environments differ between rural and urban areas, the correlates of LTPA are similar among both urban and rural populations 38.
Fur-thermore, unfortunately the instrument used for data collection did not allow us to differentiate week day and weekend PA, though the potential for variability does exist. On weekends, men and women spend less time on low-intensity PA, and men spend more time on moderate PA than they do on weekdays 39. PA patterns on weekends are
different than on weekdays and might be related with walking to work, which is associated with overall higher levels of PA among adults 40.
The current investigation had a number of limitations. The analysis was cross-sectional, thereby making it impossible to determine cause and effect. PA was self-reported rather than ob-jectively measured, which means the results could be subject to bias. In addition, the study focused only on LTPA and did not include activi-ties at work, in the home or while commuting. Individuals who are inactive during leisure time may be more active in other contexts. The use of
only four socio-demographic variables is also a limitation, because there are other variables that could help to characterize the study population, such as, nationality, ethnicity, skin colour, marital status and neighborhood location. Nonetheless, the four variables used are the most important for the Portuguese context. Finally, this study was conducted in an urban area, and thus the results cannot be extrapolated to other populations, particularly adults from rural areas.
Conclusion
Resumen
Este estudio tuvo como objetivo identificar los corre-latos sociodemográficos de la actividad física, reali-zada durante el tiempo libre, en adultos portugueses. Los participantes con edades entre 31 y 60 años (1.079 hombres, 1.383 mujeres) fueron categorizados en dos grupos, de acuerdo con las recomendaciones de activi-dad física (≥ 10 MET.horas/semana ou < 10 MET.horas/ semana). La actividad física fue auto-reportada. Se ha aplicado el análisis de regresión logística y el chi- cuadrado. Los hombres que tienen un alto estatus so-cioeconómico (OR = 1,89; IC95%: 1,30-2,76; p = 0,001) se asociaron con la consecución del nivel recomendado de actividad física. Para las mujeres, el nivel de edu-cación medio (OR = 1,36; IC95%: 1,01-1,85) y el estado socioeconómico medio (OR = 1,45; IC95%: 0,80-1,91; p = 0,009) se asoció con la actividad física. Hombres y mujeres tienen diferentes patrones de correlatos socio-demográficos. Una intervención diseñada para mejorar los niveles de actividade física entre los adultos portu-gueses podrá adoptar dichas correlaciones en cuenta.
Actividades Recreativas; Actividad Motora; Adulto
Contributors
A. Marques participated in the design, data analysis and drafting the article. J. Martins contributed in the design and drafting the article. H. Sarmento collabo-rated on data analysis and writing the article. M. Ra-mos contributed to the data and statistical analyses and writing the article. J. Diniz and F. C. Costa partici-pated in the acquisition and analysis of the data, draf-ting the article and critically revising it for important intellectual content.
Acknowledgments
We thank Joyce Voelker for revising the document.
References
1. Hamer M, Chida Y. Active commuting and cardio-vascular risk: a meta-analytic review. Prev Med 2008; 46:9-13.
2. Zhang X, Geiss LS, Caspersen CJ, Cheng YJ, Engel-gau MM, Johnson JA, et al. Physical activity lev-els and differences in the prevalence of diabetes between the United States and Canada. Prev Med 2010; 50:241-5.
3. Chau JY, van der Ploeg HP, Merom D, Chey T, Bau-man AE. Cross-sectional associations between oc-cupational and leisure-time sitting, physical activ-ity and obesactiv-ity in working adults. Prev Med 2012; 54:195-200.
4. Egan BA, Mentes JC. Benefits of physical activity for knee osteoarthritis: a brief review. J Gerontol Nurs 2010; 36:9-14.
5. Manini TM, Everhart JE, Patel KV, Schoeller DA, Colbert LH, Visser M, et al. Daily activity energy ex-penditure and mortality among older adults. JAMA 2006; 296:171-9.
6. Anzuini F, Battistella A, Izzotti A. Physical activ-ity and cancer prevention: a review of current evi-dence and biological mechanisms. J Prev Med Hyg 2011; 52:174-80.
8. Penedo FJ, Dahn JR. Exercise and well-being: a re-view of mental and physical health benefits associ-ated with physical activity. Curr Opin Psychiatry 2005; 18:189-93.
9. Lee IM, Sesso HD, Oguma Y, Paffenbarger Jr. RS. Relative intensity of physical activity and risk of coronary heart disease. Circulation 2003; 107:1110-6.
10. European Commission. Sport and physical activ-ity. Brussels: Directorate-General for Education and Culture, Directorate-General for Communica-tion, European Commission; 2014.
11. Baptista F, Santos DA, Silva AM, Mota J, Santos R, Vale S, et al. Prevalence of the Portuguese popula-tion attaining sufficient physical activity. Med Sci Sports Exerc 2012; 44:466-73.
12. Varo JJ, Martinez-Gonzalez MA, De Irala-Estevez J, Kearney J, Gibney M, Martinez JA. Distribution and determinants of sedentary lifestyles in the Eu-ropean Union. Int J Epidemiol 2003; 32:138-46. 13. Sardinha LB, Santos DA, Silva AM, Coelho-e-Silva
MJ, Raimundo AM, Moreira H, et al. Prevalence of overweight, obesity, and abdominal obesity in a representative sample of Portuguese adults. PLoS One 2012; 7:e47883.
14. Organisation for Economic Co-operation and De-velopment. Health at a glance 2013. Paris: OECD Publishing; 2013.
15. Bauman AE, Reis RS, Sallis JF, Wells JC, Loos RJ, Martin BW. Correlates of physical activity: why are some people physically active and others not? Lancet 2012; 380:258-71.
16. Belanger M, Townsend N, Foster C. Age-related differences in physical activity profiles of English adults. Prev Med 2011; 52:247-9.
17. Dias-da-Costa JS, Hallal PC, Wells JC, Daltoe T, Fuchs SC, Menezes AM, et al. Epidemiology of leisure-time physical activity: a population-based study in southern Brazil. Cad Saúde Pública 2005; 21:275-82.
18. Mota J, Silva G. Adolescent’s physical activity: as-sociation with socio-economic status and parental participation among a Portuguese sample. Sport, Education and Society 1999; 4:193-9.
19. Wilson DK, Kirtland KA, Ainsworth BE, Addy CL. Socioeconomic status and perceptions of access and safety for physical activity. Ann Behav Med 2004; 28:20-8.
20. Kamphuis CB, van Lenthe FJ, Giskes K, Huisman M, Brug J, Mackenbach JP. Socioeconomic differ-ences in lack of recreational walking among older adults: the role of neighbourhood and individual factors. Int J Behav Nutr Phys Act 2009; 6:1. 21. Harriss DJ, Atkinson G. Update: ethical standards
in sport and exercise science research. Int J Sports Med 2011; 32:819-21.
22. Telama R, Naul R, Nupponen H, Rychtecky A, Vuolle P. Physical fitness, sporting lifestyles, and Olympic ideals: cross-cultural studies on youth sport in Europe. Schorndorf: International Council of Sport Science and Physical Education; 2002. 23. Chen YJ, Huang YH, Lu FH, Wu JS, Lin LL, Chang
CJ, et al. The correlates of leisure time physical ac-tivity among an adults population from southern Taiwan. BMC Public Health 2011; 11:427.
24. Trinh OT, Nguyen ND, Dibley MJ, Phongsavan P, Bauman AE. The prevalence and correlates of physical inactivity among adults in Ho Chi Minh City. BMC Public Health 2008; 8:204.
25. Ainsworth BE, Haskell WL, Herrmann SD, Meckes N, Bassett Jr. DR, Tudor-Locke C, et al. 2011 com-pendium of physical activities: a second update of codes and MET values. Med Sci Sports Exerc 2011; 43:1575-81.
26. Haskell WL, Lee IM, Pate RR, Powell KE, Blair SN, Franklin BA, et al. Physical activity and public health: updated recommendation for adults from the American College of Sports Medicine and the American Heart Association. Med Sci Sports Exerc 2007; 39:1423-34.
27. Raudsepp L, Viira R. Sociocultural correlates of physical activity in adolescents. Pediatr Exerc Sci 2000; 12:51-60.
28. Burton NW, Turrell G. Occupation, hours worked, and leisure-time physical activity. Prev Med 2000; 31:673-81.
29. Shibata A, Oka K, Nakamura Y, Muraoka I. Preva-lence and demographic correlates of meeting the physical activity recommendation among Japa-nese adults. J Phys Act Health 2009; 6:24-32. 30. Ku PW, Fox KR, McKenna J, Peng TL. Prevalence of
leisure-time physical activity in Taiwanese adults: results of four national surveys, 2000-2004. Prev Med 2006; 43:454-7.
31. Santos R, Aires L, Santos P, Ribeiro JC, Mota J. Prev-alence of overweight and obesity in a Portuguese sample of adults: results from the Azorean Physi-cal Activity and Health Study. Am J Hum Biol 2008; 20:78-85.
32. Lagerros YT, Bellocco R, Adami HO, Nyren O. Mea-sures of physical activity and their correlates: the Swedish National March Cohort. Eur J Epidemiol 2009; 24:161-9.
33. Martin SB, Morrow Jr. JR, Jackson AW, Dunn AL. Variables related to meeting the CDC/ACSM phys-ical activity guidelines. Med Sci Sports Exerc 2000; 32:2087-92.
35. Estabrooks PA, Lee RE, Gyurcsik NC. Resources for physical activity participation: does availability and accessibility differ by neighborhood socioeco-nomic status? Ann Behav Med 2003; 25:100-4. 36. Rech CR, Reis RS, Hino AA, Hallal PC. Personal,
social and environmental correlates of physical activity in adults from Curitiba, Brazil. Prev Med 2014; 58:53-7.
37. Sallis JF, Cervero RB, Ascher W, Henderson KA, Kraft MK, Kerr J. An ecological approach to cre-ating active living communities. Annu Rev Public Health 2006; 27:297-322.
38. Solomon E, Rees T, Ukoumunne OC, Metcalf B, Hillsdon M, Personal, social, and environmental correlates of physical activity in adults living in ru-ral south-west England: a cross-sectional analysis. Int J Behav Nutr Phys Act 2013; 10:129.
39. Buchowski MS, Acra S, Majchrzak KM, Sun M, Chen KY. Patterns of physical activity in free-living adults in the Southern United States. Eur J Clin Nutr 2004; 58:828-37.
40. Audrey S, Procter S, Cooper AR. The contribution of walking to work to adult physical activity levels: a cross sectional study. Int J Behav Nutr Phys Act 2014; 11:37.
Submitted on 01/Jul/2014