Received: 23 October, 2011. Accepted: 6 November, 2013
ABSTRACT
The area evaluated in this study was a continuous stretch comprising three vegetation formations: gallery forest, semi-deciduous seasonal forest and cerradão (woodland savanna). The aim of this study was to examine the tree community dynamics in a forest gradient—from gallery forest to cerradão—at Panga Ecological Station, in the city of Uberlandia, located in the state of Minas Gerais, Brazil. The study was based on data from a previous inventory of the continuous forest conducted in 211 permanent 10 × 10 m sample plots in eight parallel transect running perpendicular to Panga Creek. Trees with a diameter at breast height ≥ 4.77 cm were sampled in 1997, 2002 and 2007. With the exception of the cerradão, there was a net reduction in tree density over the studied period of ten years, because mortality rates were higher than the recruitment rates. The basal area increased during the period of the study, especially at cerradão. The mean mortality rate in the studied area was 2.64%.yr−1 and 3.36%.yr−1 for the 1997-2002 and 2002-2007 periods,
respectively, whereas the mean recruitment rate was 1.76%.yr−1 and 1.97%.yr−1, respectively. In general, mortality rates
and recruitment rates have increased during the two successive periods of measurement and showed an imbalance in favor of mortality for the semideciduous seasonal forest and the gallery forest. This fact, added to the low density and high basal area, suggest that there was a process of thinning in the tree community. However, at cerradão, there was an imbalance in favor of recruitment, with a consequent increase in density and basal area, indicating that the cerradão
is in a construction phase, which was further favored by a decrease in the occurrence of fire and other anthropogenic disturbances. When the turnover rates are taken into consideration, the global dynamics of the study area over the ten years evaluated can be expressed as cerradão > semideciduous seasonal forest > gallery forest.
Key words: Forest dynamics, gallery forest, semideciduous seasonal forest, woodland savanna, savanna
Mortality, recruitment and growth of the tree communities
in three forest formations at the Panga Ecological Station
over ten years (1997-2007)
1Ana Paula de Oliveira2,4, Ivan Schiavini2, Vagner Santiago do Vale2, Sérgio de Faria Lopes3, Carolina de Silvério Arantes2,
André Eduardo Gusson2, Jamir Afonso Prado Júnior2 and Olavo Custódio Dias-Neto2
1 Based on the doctoral thesis of the first author.
2 Universidade Federal de Uberlândia, Instituto de Biologia, Pós-Graduação em Ecologia e Conservação de Recursos Naturais, Uberlândia, MG, Brasil 3 Universidade Estadual da Paraíba, Departamento de Biologia Geral, Instituto de Ciências Biológicas, Pós-Graduação em Ecologia e Conservação,
Campina Grande, PB, Brasil
4 Author for correspondence: [email protected]
Introduction
Long-term studies on temporal changes in tropical for-est remnants are necessary to make the distinction between natural dynamic processes and changes resulting from hu-man activity (Korning & Balslev 1994a). Such studies can contribute to the prediction of forest growth and produc-tivity, facilitating the implementation of management pro-grams, as well as promoting the rational use and recovery of tropical forests (Carey et al. 1994). The changes that occur over time in tropical forests, in terms of their composition and structure, are the product of internal processes, such as competition for light (Harcombe et al. 2002), and external processes, such as climatic, geological and anthropogenic changes (Condit et al. 1992).
Forest communities that are free of anthropogenic disturbance display a dynamic equilibrium. Changes oc-cur continuously over time at the individual and popula-tion levels, due to a balance among growth, recruitment and mortality (Hartshorn 1980; Swaine et al. 1987; Felfili 1995b), as well as local extinctions, immigration of new species and ecological drift (Condit et al. 1992). Therefore, these communities do not constitute a single equilibrium stage but a mosaic of successional stages, with arrays of species and individuals in different phases of regeneration, subjected to recurrent disturbances at varying frequencies (Hartshorn 1980).
communities (Condit et al. 1992). With knowledge of the dynamic processes that modify the structure of a forest community, it is possible to infer the tendencies of a given ecosystem (Clark & Clark 1999) regarding changes in basal area, biomass and carbon balance (Lewis et al. 2009).
In tropical seasonal forests and in gallery forests sub-jected to annual climate seasonality, the rates of mortality and recruitment are higher than 3% per year (Paiva et al. 2007; Oliveira & Felfili 2008; Silva & Araújo 2009; Carvalho & Felfili 2011), whereas in wet forests these rates are lower, not exceeding 2% per year (Lang & Knight 1983; Manokaran & Kochummen 1987; Korning & Balslev 1994a; Rolim et al. 1999; Marques et al. 2009). Therefore, because of seasonal-ity, together with functional and successional ecological processes (Murphy & Lugo 1986; Swaine et al. 1990), the community dynamics are more accelerated in seasonal and gallery forests than in wet forests.
The aim of this study was to detect the patterns of mortality, recruitment and growth of the tree community of a forest gradient—from gallery forest to semideciduous seasonal forest to cerradão (savanna woodland)—in two successive five-year intervals (1997-2002 and 2002-2007). These forest formations are subjected to pronounced sea-sonality in the rainfall distribution, with a long period of low precipitation (Oliveira-Filho & Ratter 2002). We tested the following hypotheses: because the study site has a sea-sonal climate, it displays accelerated dynamics, with high mortality and recruitment rates; and the dynamic processes are most intense in the cerradão, followed by the seasonal forest and the gallery forest.
Material and methods
Study site
The study site is located at the Panga Ecological Station (PES), near the city of Uberlândia, which is in the state of Minas Gerais, Brazil, and comprises three continuous forest formations: gallery forest (surrounding the Panga Creek), semideciduous seasonal forest and cerradão (Fig. 1). Until 1984, the area now occupied by the PES was extensively used as agricultural land (Cardoso & Schiavini 2002). The PES was acquired in 1986 by the Federal University of Uberlândia. It has a total area of 403.85 ha and is located approximately 30 km from Uberlândia (Schiavini & Araújo 1989). The vegetation of the PES consists of several vegeta-tion formavegeta-tions found in the Cerrado (Savanna) Biome (sensu Ribeiro & Walter 2008), including forests, savannas and fields (Schiavini & Araújo 1989).
Within the PES, the gallery forest is distributed mainly along Panga Creek, which constitutes the northern border of the station, and, to a lesser extent, along the drainage chan-nels and small streams in its southeast portion (Schiavini & Araújo 1989). Although the semideciduous seasonal forest is physiognomically similar to the gallery forest, it is located
on an inclined relief, as an extension of the gallery forest, and possesses a characteristic flora (Schiavini & Araújo 1989). The cerradão is adjacent to the semideciduous seasonal forest, occupying a higher topographic position (Schiavini & Araújo 1989).
According to the Köppen classification system (Köppen 1948), the climate of the region is predominantly Aw type, with hot, humid summers and cold, dry winters (Alves & Rosa 2008). The mean annual precipitation is 1590 mm (± 247 mm), and the mean temperature is relatively uniform throughout the year. According to the Uberlândia Station of the 5th Meteorology District of the Brazilian Ministry of Agriculture and to the Climatology Station of the Federal University of Uberlândia, the wet season is from October to March and the dry season is from April to September.
gallery forest > cerradão. The study site is located between elevations of 739 m and 773 m, thereabout, and the creek shows a mean declivity of approximately 0.18% (Cardoso & Schiavini 2002).
Continuous survey and data analysis
The survey was conducted in 211 permanent, 10 × 10 m sampling plots, in eight parallel transects running per-pendicular to Panga Creek (Fig. 1). The transects end at the border between cerradão and cerrado sensu stricto (savanna). All individuals with a circumference at breast height ≥ 15 cm were sampled in 1997. The circumference data were transformed to diameter for the analyses employed in this study. In 2002 and 2007 the community was surveyed again, to record the growth (change in diameter), mortality and recruitment. The dataset from the surveys was used in order to calculate the demographic rates for both sampling periods (1997-2002 and 2002-2007).
The parameters of dynamics (mortality, recruitment and growth) were described for the study site as a whole, for each forest formation (gallery forest, semideciduous seasonal for-est and cerradão) and for each vertical stratum (understory, midstory, overstory and emergent layer). The Shannon index (H’) at the natural base was used as a measure of diversity and the Pielou index (J’) was used as a measure of evenness, following Magurran (2004). The structure of the community was described in terms of number of individu-als, basal area and distribution by diameter.
The classification of species according to their position in the vertical strata of the community was performed separately for each forest formation. The analysis of vertical stratification, adapted from Vale et al. (2009), was based on the height data for each species, with the aim to represent the true vertical position of the species (i.e., which stratum the species occupies when it reaches its maximum size) within the community. Only species with a minimum of ten individuals in the community in the 1997 survey were included in the analysis. The classification of strata consid-ered the following criteria and intervals:
• understory (Q3s ≤ Mc) • midstory (Mc < Q3s < Q3c) • overstory (Q3s ≥ Q3c ≤ D9c) • emergent layer (Q3s > D9c)
where Q3s and Q3c are the third quartiles of the heights of individuals, within a species and within the community, respectively; Mc is the median height of the individuals sampled in the community; and D9c is the ninth decile of the heights of the individuals sampled in the community.
The mean annual rates of mortality and recruitment were based on the logarithmic model (Swaine & Lieberman 1987). Because the basal area is also involved in the processes of mortality and recruitment, the mean annual rates of loss and gain in basal area of the individuals were estimated, as
described by Werneck & Franceschinelli (2004). To express the global dynamics, the rate of turnover in number of individuals was calculated from the mean rates of mortal-ity and recruitment, and the rate of turnover in basal area was calculated from the rates of loss and gain in basal area (Oliveira-Filho et al. 2007).
Growth is usually expressed in terms of diameter and basal area. Diameter is the main determinant of basal area, which justifies the preference for expressing growth in terms of diameter (Braga & Rezende 2007). The annual diameter increment (ADI) expresses the annual growth of an individual and is based on the difference in diameter between two peri-ods, divided by the time in years between the two measure-ments (Finger 1992). The mean incremeasure-ments were calculated for the surviving trees between the periods of 1997-2002 and 2002-2007. In calculating the mean ADI, we converted each of the negative ADIs recorded for some individuals to zero, thus assuming that there was no growth in the period, as adopted by Felfili (1995b). The negative ADIs represented less than 0.01% of the ADIs analyzed in the community.
The differences in the rates of mortality and recruitment among the vertical strata for each period were determined by the Kruskal-Wallis test, followed by the median test for multiple comparisons among the strata (Zar 2010). The median test quantifies the number of times each stratum appears above or below the median and compares this with the chi-square distribution in a contingency table of expected and observed values. The Wilcoxon nonparametric test was used in order to compare the two measurement periods (1997-2002 and 2002-2007) in terms of the mean rates of mortality and recruitment for each stratum (Zar 2010). The statistical analyses were performed at the 5% significance level with the Systat program, version 10.2 (Wilkinson 1990).
Results
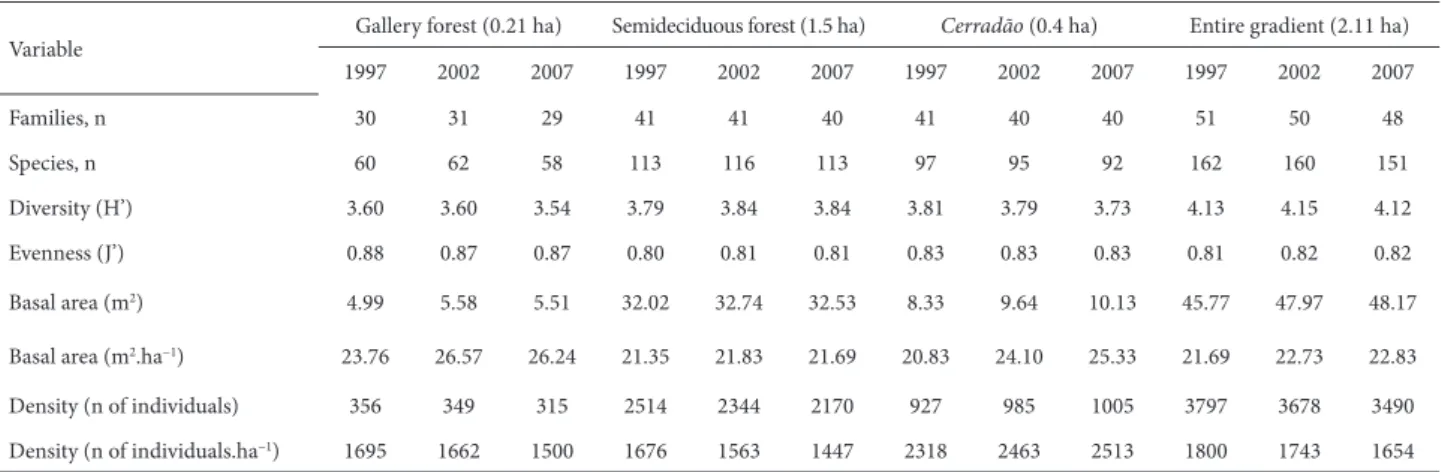
In 1997, the forest gradient showed a total of 3797 individuals, with a basal area of 23.95 m2/ha (Table 1). In
general, the results suggest a net reduction in density over the studied period of ten years (Tab. 1), because mortality rates were higher than were recruitment rates (Tab. 2), the only exception being the cerradão. The basal area of the gradient increased during the study period, especially for the cerradão (Tab. 1). As for the floristic composition, the number of species declined over the study period. The fluctuation in the number of species in the community is due to the entry and exit of rare species (n < 2), which did not alter the estimated values of diversity and evenness (Tab. 1). The same was observed for the botanical families. Among the rare species removed from the floristic list in the gradient are those whose occurrence was restricted to the cerradão and those that are typical of the adjacent area of cerrado sensu stricto (Appendix 1).
2002-2007, respectively. The recruitment rates for the same period were 1.76%.year−1 and 1.97%.year−1, respectively.
Between the two periods, the mortality and recruitment rates increased for all of the vegetation formations studied, except for the gallery forest, which showed a decrease in the recruitment rate (Tab. 2). All formations except the cerradão showed an imbalance in favor of mortality. Recruitment rates were higher in the cerradão: approximately 3% per year.
The semideciduous seasonal forest showed the greatest reduction in basal area for both measurement periods, due to the death of large trees, whereas the greatest gain, due to high recruitment, was in the cerradão (Tab. 2). When the turnover rates are taken into consideration, the global dynamics of the study area over the ten years evaluated can be expressed as cerradão > semideciduous seasonal forest > gallery forest.
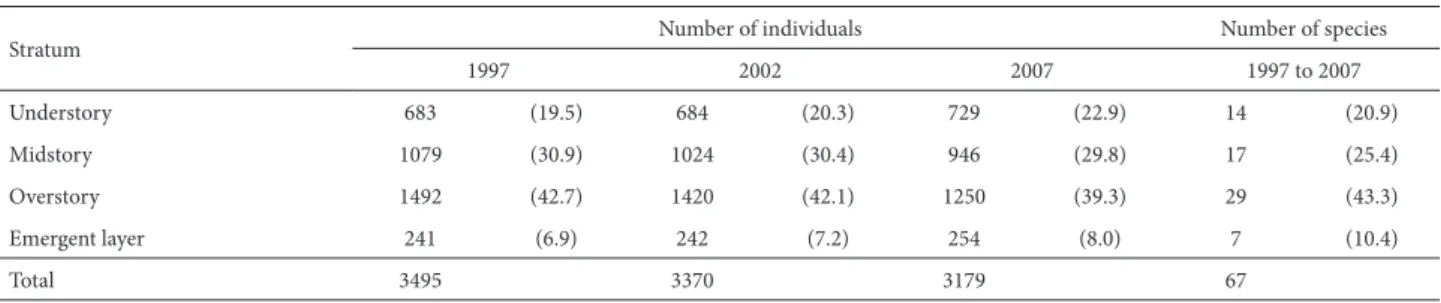
The species evaluated in the analysis of the vertical structure represented 92% and 41% of the number of indi-viduals and the number of species of the tree community, respectively. From 1997 to 2007, the species of the overstory and midstory dominated the gradient, followed by the spe-cies of understory and emergent layer (Tab. 3). There was
no change in the proportional distribution of species among the strata over the course of the study period.
In general, only the species of the emergent layer showed mortality rates below the mean of the forest gradient and lower than those of the remaining strata (Fig. 2). However, the difference was significant only for the 2002-2007 period (Kruskal-Wallis, H3,67 = 8.66; p = 0.03), the emergent layer
showing lower mortality than did the understory (median test, z = 2.87; p = 0.02). Only the understory showed mean annual recruitment rates above those found for the for-est community in both measurement periods (Fig. 2). A significant difference among the strata was observed only for recruitment rates in the 2002-2007 period (Kruskal-Wallis, H3,67 = 10.70; p = 0.01), the understory showing higher recruitment than did the overstory (median test, z = 2.81; p = 0.03).
Only the overstory showed a significant increase in mortality rates from the 1997-2002 period to the 2002-2007 period (Wilcoxon, Z = 3.42; p = 0.001). The overstory was also the only stratum to show a significant decrease in recruitment rates along these same periods (Wilcoxon, Z = 2.25; p = 0.002).
Table 1. Characteristics of the forest gradient and its vegetation formations in 1997, 2002 and 2007 at the Panga Ecological Station, in the city of Uberlândia, state of Minas Gerais, Brazil.
Variable
Gallery forest (0.21 ha) Semideciduous forest (1.5 ha) Cerradão (0.4 ha) Entire gradient (2.11 ha)
1997 2002 2007 1997 2002 2007 1997 2002 2007 1997 2002 2007
Families, n 30 31 29 41 41 40 41 40 40 51 50 48
Species, n 60 62 58 113 116 113 97 95 92 162 160 151
Diversity (H’) 3.60 3.60 3.54 3.79 3.84 3.84 3.81 3.79 3.73 4.13 4.15 4.12
Evenness (J’) 0.88 0.87 0.87 0.80 0.81 0.81 0.83 0.83 0.83 0.81 0.82 0.82
Basal area (m2) 4.99 5.58 5.51 32.02 32.74 32.53 8.33 9.64 10.13 45.77 47.97 48.17
Basal area (m2.ha−1) 23.76 26.57 26.24 21.35 21.83 21.69 20.83 24.10 25.33 21.69 22.73 22.83
Density (n of individuals) 356 349 315 2514 2344 2170 927 985 1005 3797 3678 3490
Density (n of individuals.ha−1) 1695 1662 1500 1676 1563 1447 2318 2463 2513 1800 1743 1654
Table 2. Parameters of the dynamics in the forest gradient and its vegetation formations over a period of ten years at the Panga Ecological Station, in the city of Uberlândia, state of Minas Gerais, Brazil.
Parameter Gallery forest Semideciduous forest Cerradão Entire gradient 1997-2002 2002-2007 1997-2002 2002-2007 1997-2002 2002-2007 1997-2002 2002-2007
M (%.year−1) 2.13 3.03 3.02 3.64 1.83 2.83 2.64 3.36
R (%.year−1) 1.57 0.84 1.40 1.76 2.79 2.83 1.76 1.97
TN (%.year
−1) 1.92 1.98 2.29 2.83 2.41 2.99 2.29 2.80
L (%.year−1) 1.81 2.15 2.07 2.37 1.07 2.30 1.84 2.33
G (%.year−1) 0.62 1.76 2.33 2.04 3.88 2.88 2.59 2.21
TBA (%.year
−1) 1.21 1.96 2.20 2.20 2.47 2.59 2.21 2.27
The mean ADIs of the forest gradient in the periods of 1997-2002 and 2002-2007 were 0.15 and 0.13 cm.year−1,
respectively. The variation between the two measurement periods, in terms of the ADIs calculated (Tab. 4), was high: 131% and 150% in the in the 1997-2002 and 2002-2007 periods, respectively. The median ADIs were much lower than were the means, showing a higher uniformity among the vegetation formations, except for the cerradão in the
Table 3. Changes in the distribution of species and individuals with higher density (n > 10) over a period of ten years (1997 to 2007), for each stratum of the forest gradient at the Panga Ecological Station, in the city of Uberlândia, state of Minas Gerais, Brazil. Numbers between parentheses are percentages in the strata.
Stratum Number of individuals Number of species
1997 2002 2007 1997 to 2007
Understory 683 (19.5) 684 (20.3) 729 (22.9) 14 (20.9)
Midstory 1079 (30.9) 1024 (30.4) 946 (29.8) 17 (25.4)
Overstory 1492 (42.7) 1420 (42.1) 1250 (39.3) 29 (43.3)
Emergent layer 241 (6.9) 242 (7.2) 254 (8.0) 7 (10.4)
Total 3495 3370 3179 67
1997-2002 period (Tab. 4). However, in the 2002-2007 pe-riod, the difference in the ADIs was altered in the sequence cerradão = gallery forest > semideciduous forest. The results of the Kruskal-Wallis test (H) and of the median test (z) for multiple comparisons among the vegetation formations are shown in Tab. 5.
Discussion
Over the ten-year period of monitoring in the gradient studied, we observed a reduction in tree density and an increase in basal area for the semideciduous forest and gal-lery forest. Similar patterns have been documented in other studies of gallery forests and semideciduous seasonal forests, as well as in those of areas of tropical forest, Atlantic Forest and deciduous forest (Tab. 6). According to Finegan (1996) and Guariguata & Ostertag (2001), over the course of the successional process, density tends to decrease in parallel with the increasing age of the forest, a pattern cited as one of the main characteristics of forest succession. The process of increasing basal area and decreasing tree density, also known as self-thinning (Oliveira-Filho et al. 1997), consists of the growth and accumulation of biomass by a few trees that survive intraspecific and interspecific competition, coupled with the mortality of various individuals, most with small diameters (Machado & Oliveira-Filho 2010). Thus, the for-est gradient tends to change from a community with high density of individuals to a community characterized by low tree density and increase in biomass by the individuals with larger size. This tendency, as observed here, is explained by the fact that the forest gradient is inserted in a protected area, with no occurrence of disturbances in the last 30 years.
The concomitant increase in basal area and density ob-served in the cerradão has also been reported for other areas of cerrado sensu stricto in Brazil (Henriques & Hay 2002; Libano & Felfili 2006; Roitman et al. 2008). The structure and composition of cerrado areas protected from fire have changed significantly over the years (Moreira 2000; Durigan & Ratter 2006; Cardoso et al. 2009), as, for example, the increases in density, basal area and number of species (19%, 15% and 35%, respectively) reported for a cerrado in south-eastern Brazil that was protected from fire (Roitman et al. Figure 2. Mean annual rates of mortality and recruitment of the tree species in
Table 6. Structural and demographic parameters of successive monitoring studies in permanent plots in tropical forest formations.
Author Vegetation Inclusion limit Period Basal area Mortality Recruitment Growth (m2.ha−1) (%.year−1) (%.year−1) (mean)
(Korning & Balslev 1994a) Tropical wet forest 10 cm 4.9 years 27.2-28.9 1.88 1.78 9.3 cm2
(Korning & Balslev 1994a) Tropical wet forest 10 cm 2.5 years 22.2-24.0 1.04 3.09 13.6 cm2
(Korning & Balslev
1994b) Tropical wet forest 10 cm 1983-1990 - - - 0.1 to 0.55 cm.year-1
(Lang & Knight 1983) Tropical wet forest 2.5 cm 1968-1978 25.7-31.4 2.23 0.86 0.1 to 1.5 cm.year-1 (Manokaran &
Kochummen 1987) Tropical wet forest 10 cm 1947-1981 32.4 2.02 - 0.08 to 0.49 cm.year-1
(Rolim et al. 1999) Atlantic Forest 10 cm 1980-1995 - 1.5 1.5
-(Marques et al. 2009) Atlantic Forest - non
floodable 4.4 cm 1991-2007 23.7-27.0 1.3 2.1 5.24 (10-3 cm.cm2.year-1)
(Marques et al. 2009) Atlantic Forest - floodable 4.4 cm 1991-2007 37.0-38.5 2 1.6 9.07 (10-3 cm.cm2.year-1)
(Gomes et al. 2003) Atlantic Forest 8 cm 1989-1995 17.0-19.5 1.67 3.46 0.28 to 1.44 %.year-1
(Felfili 1995b) Gallery forest 10 cm 1985-1991 30.4 3.5 2.7 0.25 cm.year-1
(Braga & Rezende 2007) Gallery forest 5 cm 1994-2005 - 5.55 1.42 0.20 cm.year-1
(Oliveira-Filho et al. 1997) Semideciduous forest 5 cm 1987-1992 18.8-21.5 2.56 2.99 1.43 cm.year-1
(Paiva et al. 2007) Semideciduous forest 5 cm 1989-2000 - 4.1 4.04
-(Silva & Araújo 2009) Semideciduous forest 3.18 cm 1990-2004 28.8-26.84 4.1 4.5
-(Swaine et al. 1990) Deciduous forest 10 cm 1979-1987 - 2.38 1.5 1 to 3.5 %.year−1
(Carvalho 2009) Deciduous forest 5 cm 2000-2006 14.9-16.5 2.77 4.43 0.25 cm.year-1
(Werneck &
Franceschinelli 2004) Deciduous forest 3.2 cm 1994-1998 23.7-24.2 5 2.1 -(Werneck &
Franceschinelli 2004) Deciduous forest 10 cm 1994-1998 19.5-20.4 2.3 2.3
-(Roitman et al. 2008) Cerrado sensu stricto 5 cm 1991-2004 8.1-9.2 1.93 3.72 0.096 cm.year-1
THIS STUDY Gallery forest 4.8 cm 1997-2007 23.8-26.2 2.11 and 2.98 1.72 and 0.97 0.14 and 0.13 cm.year-1
Semideciduous forest 4.8 cm 1997-2007 21.4-21.7 2.97 and 3.57 1.60 and 2.08 0.14 and 012 cm.year-1
Cerradão 4.8 cm 1997-2007 20.9-25.3 1.81 and 2.79 3.00 and 3.18 0.19 and 0.15 cm.year-1
Entire forest gradient 4.8 cm 1997-2007 21.7-22.8 2.60 and 3.31 1.98 and 2.29 0.15 and 0.13 cm.year-1 Table 4. Mean and median of the annual diameter increment of the forest gradient and its vegetation formations at the Panga Ecological Station, in the city of Uberlândia, state of Minas Gerais, Brazil, for the periods of 1997-2002 and 2002-2007.
Statistic Gallery forest Semideciduous forest Cerradão Gradient 1997-02 2002-07 1997-2002 2002-07 1997-02 2002-07 1997-02 2002-07
Mean (cm) 0.14 0.13 0.14 0.12 0.19 0.15 0.15 0.13
CV (%) 131 153 136 161 118 129 131 150
Median (cm) 0.06 0.06 0.06 0.03 0.13 0.06 0.06 0.06
N 320 300 2162 1954 846 855 3328 3109
CV – coefficient of variation; N – number of surviving individuals.
Table 5. Results of the median test (z) for multiple comparisons of the annual diameter increment among the vegetation formations for the periods of 1997-2002 (H3,6656 = 41.38; p = 0.001) and 2002-2007 (H3,6218 = 37.31; p = 0.001) at the Panga Ecological Station, in the city of Uberlândia, state of Minas Gerais, Brazil. Values with asterisk show a significant difference (p < 0.05).
1997 to 2002 2002 to 2007
Formation GF C SF FG Formation GF C SF FG
GF - 3.279* 0.663 0.494 GF - 1.972 1.743 0.521
C 3.279* - 6.285* 4.838* C 1.972 - 5.862* 4.243*
SF 0.663 6.285* - 2.484 SF 1.743 5.862* - 2.651*
FG 0.494 4.838* 2.484 - FG 0.521 4.243* 2.651*
2008). The pattern of increase in both density and basal area recorded in the cerradão studied here seems to be related to a decrease in the incidence of fire and of anthropogenic disturbances at the Panga Ecological Station.
The Shannon diversity indices found for all of the vegeta-tion formavegeta-tions studied here (H’ > 3.5) are within the range reported for other semideciduous forests in Brazil (Silva et al. 2004; Vale et al. 2009; Dias Neto et al. 2009; Prado-Júnior et al. 2010), as well as for other areas of cerradão (Pereira-Silva et al. 2004; Fina & Monteiro 2009). The final value calculated for the forest gradient as a whole (H’ > 4.10) is close to that observed for tropical forests (Knight 1975) and reflects the environmental heterogeneity of the forest gradient, which is related to the edaphic gradient (Moreno & Schiavini 2001) and to the topographic gradient (Cardoso & Schiavini 2002). Between the two measurement periods, there were minor changes in the floristic composition, relat-ed to the exit of rare species, often restrictrelat-ed to the cerradão, which forms the border with an area of cerrado sensu stricto. In general, the entry and exit of species in forest formations is observed for species with low abundance (Kellman et al. 1998; Nascimento et al. 1999; Pinto & Hay 2005).
The mean annual mortality rate of 2.64% calculated for the forest gradient for the 1997-2002 period (Tab. 6) is within the range of 2-3% per year reported for tropical forests (Manokaran & Kochummen 1987; Korning & Balslev 1994a) and deciduous forests (Swaine et al. 1990; Carvalho & Felfili 2011), as well as for other semideciduous seasonal forests (Oliveira-Filho et al. 1997) and gallery forests (Pinto & Hay 2005). The rate observed in the 2002-2007 period, approximately 3% per year, is also comparable to that re-ported in more recent studies of deciduous forests (Werneck & Franceschinelli 2004; Marin et al. 2005), semideciduous seasonal forests (Nascimento et al. 1999; Paiva et al. 2007; Silva & Araújo 2009; Machado & Oliveira-Filho 2010) and gallery forests (Felfili 1995b; Oliveira & Felfili 2008). The variation in mortality rates over time can be related to fac-tors such as climatic stresses (Slik 2004), longevity of the species that compose the community (Manokaran & Ko-chummen 1987; Felfili 1995a), anthropogenic disturbances (Gomes et al. 2003; Werneck & Franceschinelli 2004) and successional stage of the forest.
The annual recruitment rate found for the gradient (2.6-3.31% per year) is similar to the 2-3.5% per year reported for other semideciduous forests (Oliveira-Filho et al. 1997; Appolinário et al. 2005; Oliveira-Filho et al. 2007) and gallery forests (Felfili 1995a; Oliveira & Felfili 2008), as well as for deciduous forests (Werneck & Franceschinelli 2004). However, more recently, rates > 4% per year have been reported, having been attributed to post-disturbance recovery, in a semideciduous forest (Silva & Araújo 2009), and to increased rainfall, in a deciduous forest (Carvalho & Felfili 2011).
In general, the rates of mortality and recruitment in-creased between the two successive measurement periods
evaluated in the present study. For the semideciduous sea-sonal forest and the gallery forest, the imbalance in favor of mortality, the decrease in density and the increase in basal area suggest a process of self-thinning in the tree commu-nity. In the cerradão, however, the positive balance in favor of recruitment and the increases in density and basal area indicate that this vegetation formation is in the construction phase, which is favored by the decrease in the occurrence of fire and other anthropogenic disturbances (Cardoso et al. 2009), resulting in the expansion of the cerradão into areas of cerrado sensu stricto and in some areas of cerradão being supplanted by semideciduous forest.
There were no significant differences among the strata in terms of the mean annual rates of recruitment and mortality. We can highlight only the emergent layer, which had a lower mortality rate than did the understory, and the understory, which had a higher recruitment rate than did the overstory. The tendency for the mortality rate to be lower in the emergent layer than in the understory has also been found in studies of tropical forests. Manokaran & Kochummen (1987) reported differences in the mortality rates among groups of species in forests of dipterocarps in the sequence emergent layer < overstory < understory < shade-intolerant species. In tropical forests, the mean annual mortality rate has also been shown to decrease in parallel with increasing tree height, understory species showing the highest rate, followed by those of the midstory and overstory (Lang & Knight 1983; Korning & Balslev 1994b). According to Turner (2001), understory species show high mortality due to the risk of large trees falling and to competition; there-fore, these species should recruit more individuals than do overstory species, which grow faster and are more efficient in escaping the limiting conditions of the understory.
The ADIs recorded for the forest gradient in the two measurement periods were comparable to those obtained for some tropical wet forests in the Amazon (Uhl et al. 1988; Laurance et al. 1998) and lower than those obtained for tropical forests (Lieberman et al. 1985), gallery forests (Felfili 1995b; Braga & Rezende 2007; Oliveira & Felfili 2008) and deciduous forests (Carvalho & Felfili 2011). These values are typical of undisturbed forests, values > 0.3 cm.year−1 being found in disturbed environments, which
are subjected to timber exploitation (Silva et al. 1995) or display an edge effect with a predominance of pioneer and heliophytic species (Pulz 1998).
studied, probably because of the higher recruitment, which, in addition to the increase in basal area and tree density, suggests that this vegetation formation is in the construction phase.
Acknowledgments
This study was conducted as part of the doctoral thesis of the first author, under the auspices of the Federal University of Uberlândia Graduate Program in Ecology and Conserva-tion of Natural Resources. Financial support was provided by the Brazilian Coordenação de Aperfeiçoamento de Pessoal de Nível Superior (CAPES, Office for the Advancement of Higher Education; doctoral scholarship to APO).
References
Alves, K.A. & Rosa, R. 2008. Espacialização de dados climáticos do cerrado mineiro. Revista Horizonte Científico 2: 1-28.
Appolinário, V.; Oliveira-Filho, A.T. & Guilherme F.A.G. 2005. Tree popula-tion and community dynamics in a Brazilian tropical semideciduous forest. Revista Brasileira de Botânica 28: 347-360.
Braga, F.M.S. & Rez ende, A.V. 2007. Arboreal vegetation’s dynamic in Catetinho’s gallery forest, Brasilia-DF. Cerne 13: 138-148.
Cardoso, E.; Moreno , M.I.C.; Bruna, E.M. & Vasconcelos, H.L. 2009. Mu-danças fitofisionômicas no Cerrado: 18 anos de sucessão ecológica na Estação Ecológica do Panga, Uberlândia-MG. Caminhos de Geografia 10: 254-268.
Cardoso, E. & Schiavini, I. 2002. Relação entre distribuição de espécies ar-bóreas e topografia em um gradiente florestal na Estação Ecológica do Panga (Uberlândia, MG). Revista Brasileira de Botânica 25: 537-544. Carey, E.; Brown, S.; Gillespie, A. & Lugo, A. 1994. Tree mortality in mature lowland tropical moist and tropical lower montane moist forests of Venezuela. Biotropica 26: 255-265.
Carvalho, F.A. & Felfili, J.M. 2011. V ariações temporais na comunidade arbórea de uma floresta decidual sobre afloramentos calcários no Brasil Central: composição, estrutura e diversidade florística. Acta Botanica Brasilica 25: 203-214.
Clark, D.A. & Clark, D.B. 1999. Assessing the growth of tropical rain forest trees: Issues for forest modeling and management. Ecological Applications 9: 981-997.
Condit, R.; Hubbell, S.P. & Foster, R.B. 1992 . Short-term dynamics of a neotropical forest. Bioscience 42: 822-828.
Dias Neto, O.C.; Schiavini, I.; Lopes, S.F.; Vale, V.S.; Gusson, A.E. & Oliveira, A.P. 2009. Estrutura fitossociológica e grupos ecológicos em fragmento de floresta estacional semidecidual, Uberaba, Minas Gerais, Brasil. Rodriguésia 60: 1087-1100.
Durigan, G. & Ratter, J.A. 2006. Successional ch anges in cerrado and Cer-rado/Forest ecotonal vegetation in western São Paulo state, Brazil, 1962-2000. Edinburgh Journal of Botany 63: 119-130.
Felfili, J.M. 1995a. Diversity, structure and dyn amics of a gallery forest in Central Brazil. Vegetatio 117: 1-15.
Felfili, J.M. 1995b. Growth, recruitment and mort ality in the Gama gallery forest in Central Brazil over a 6-year period (1985-1991). Journal of Tropical Ecology 11: 67-83.
Fina, B.G. & Monteiro, R. 2009. Estudo da estrutu ra da comunidade ar-bustivo-arbórea de uma área de cerradão, município de Pirassununga (SP). Neotropical Biology and Conservation 4: 40-48.
Finegan, B. 1996. Pattern and process in neotropical secondary rain forests: The first 100 years of succession. Trends in Ecology & Evolution 11: 119-124.
Finger, C.A.G. 1992. Fundamentos de Biometria Florest al. Santa Maria. UFSM/CEPEF/FATEC.
Gomes, E.P.C.; Mantovani, W. & Kageyama, P.Y. 2003. M ortality and re-cruitment of trees in a secondary montane rain forest in Southeastern Brazil. Brazilian Journal of Biology 63: 47-60.
Guariguata M.R. & Ostertag, R. 2001. Neotropical sec ondary forest suc-cession: changes in structural and functional characteristics. Forest Ecology and Management 148: 185-206.
Harcombe, P.A.; Bill, C.J.; Fulton, M.; Glitzenstein, J.S.; Marks, P.L. & Elsik, I.S. 2002. Stand dynamics over 18 years in a southern mixed hardwood forest, Texas, USA. Journal of Ecology 90: 947-957.
Hartshorn, G.S. 1980. Neotropical forest dynamics. Bi otropica 12: 23-30. Henriques, R.P.D. & Hay, J.D. 2002. Pattern and dynam ics of plant popula-tion. Pp. 140-158. In: P. S. Oliveira & R. J. Marquis (Eds.). The cerrados of Brazil: ecology and natural history of a neotropical savanna. New York, Columbia University Press.
Kellman, M.; Tackaberry, R. & Rigg, L. 1998. Structur e and function in two tropical gallery forest communities: implications for forest conserva-tion in fragmented systems. Journal of Applied Ecology 35: 195-206. Knight, D.H. 1975. Phytosociological analysis of spec ies-rich tropical
forest on Barro Colorado Island, Panama. Ecological Monographs 45: 259-284.
Köppen, W. 1948. Climatología. México, Editora Fondo de La Cultura Económica.
Korn ing, J. & Balslev, H. 1994a. Growth and mortality of trees in Amazonian tropical rain-forest in Ecuador. Journal of Vegetation Science 5: 77-86. Korn ing, J. & Balslev, H. 1994b. Growth-rates and mortality patterns of
tropical lowland tree species and the relating to forest structure in Amazonian Ecuador. Journal of Tropical Ecology 10: 151-166. Lang , G.E. & Knight, D.H. 1983. Tree growth, mortality, recruitment, and
canopy gap formation during a 10-year period in a tropical moist forest. Ecology 64: 1075-1080.
Laur ance, W.F., Ferreira L.V.; Rankin-De Merona, J.M. & Laurance, S.G. 1998. Rain forest fragmentation and the dynamics of Amazonian tree communities. Ecology 79: 2032-2040.
Lewi s, S.L.; Lloyd, J.; Sitch, S.; Mitchard, E.T.A. & Laurance, W.F. 2009. Changing Ecology of Tropical Forests: Evidence and Drivers. Annual Review of Ecology Evolution and Systematics 40: 529-549. Liba no, A.M. & Felfili, J.M. 2006. Mudanças temporais na composição
florística e na diversidade de um cerrado sensu stricto do Brasil Cen-tral em um período de 18 anos (1985-2003). Acta Botanica Brasilica 20: 927-936.
Lieberman , D.; Lieberman, M.; Peralta, R. & Hartshorn, G.S. 1985. Mor-tality patterns and stand turnover rates in a wet tropical forest in Costa-Rica. Journal of Ecology 73: 915-924.
Machado, E.L.M. & Oliveira-Filho, A.T. 2010. Spatial patterns of tree community dynamics are detectable in a small (4 ha) and disturbed fragment of the Brazilian Atlantic forest. Acta botanica Brasilica 24: 256-268.
Magurran, A. 2004. Measuring Biological Diversity. Oxford, Blackwell Publishing.
Manokaran , N. & Kochummen, K.M. 1987. Recruitment, growth and mortality of tree species in a lowland dipterocarp forest in peninsular Malaysia. Journal of Tropical Ecology 3: 315-330.
Marin, G. C.; Nygard, R.; Rivas, B.G. & Oden, P.C. 2005. Stand dynamics and basal area change in a tropical dry forest reserve in Nicaragua. Forest Ecology and Management 208: 63-75.
Moreira, A.G. 2000. Effects of fire protection on savanna structure in Central Brazil. Journal of Biogeography 27: 1021-1029.
Moreno, M .I.C. & Schiavini, I. 2001. Relação entre vegetação e solo em um gradiente florestal na Estação Ecológica do Panga, Uberlândia (MG). Revista Brasileira de Botânica 24: 537-544.
Murphy, P.G. & Lug o, A.E. 1986. Ecology of tropical dry forest. Annual Review of Ecology and Systematics 17: 67-88.
Nascimento, H.E.M. ; Dias, A.S.; Tabanez, A.A.J. & Viana, V.M. 1999. Estrutura e dinamica de populaçoes arboreas de um fragmento de floresta estacional semidecidual na regiao de Piracicaba, SP. Revista Brasileira de Biologia 59: 14.
Oliveira-Filho, A.T.; C arvalho, W.A.C.; Machado, E.L.M.; Hihughi, P.; Apolinário, V.; Castro G.C.; Silva A.C.; Santos R.M.; Borges L.F.; Cor-rêa, B.S. & Alves, J.M. 2007. Dinâmica da comunidade e populações arbóreas da borda e interior de um remanescente florestal na Serra da Mantiqueira, Minas Gerais, em um intervalo de cinco anos (1999-2004). Revista Brasileira de Botânica 30: 149-161.
Oliveira-Filho, A.T.; Mello, J .M. & Scolforo, J.R.S. 1997. Effects of past disturbance and edges on tree community structure and dynamics within a fragment of tropical semideciduous forest in south-eastern Brazil over a five-year period (1987-1992). Plant Ecology 131: 45-66. Oliveira-Filho, A.T. & Ratter, J.A. 2002. Vegetation Physiognomies and
Woody Flora of the Cerrado Biome. Pp. 367. In: P. S. Oliveira & R. J. Marquis (Eds.). The Cerrados of Brazil: Ecology and Natural History of a Neotropical Savanna. New York, Columbia University Press,. Paiva, L.V.; Araújo, G.M. & Pe droni, F. 2007. Structure and dynamics of a
woody plant community of a tropical semi-deciduous seasonal for-est in the “Estação Ecológica do Panga”, municipality of Uberlândia, Minas Gerais, Brazil. Revista Brasileira de Botânica 30: 365-673. Pereira-Silva, E.F.L.; Santos, J.E.; Kageyama, P.Y. & Hardt, E. 2004. Florística
e fitossociologia dos estratos arbustivo e arbóreo de um remanescente de cerradão em uma Unidade de Conservação do Estado de São Paulo. Revista Brasileira de Botânica 27: 533-544.
Pinto, J.R. & Hay, J.D. 2005. Mudanças flor ísticas e estruturais na co-munidade arbórea de uma floresta de vale no Parque Nacional da Chapada dos Guimarães, Mato Grosso, Brasil. Revista Brasileira de Botânica 28: 523-539.
Prado-Júnior, J.A.; Vale, V.S.; Oliveira, A.P.; Gusson, A.E.; Dias Neto, O.C.; Lopes, S.F. & Schiavini, I. 2010. Estrutura da comunidade arbórea em um fragmento de floresta estacional semidecidual localizada na reserva legal da Fazenda Irara, Uberlândia, MG. Bioscience Journal 26: 638-647.
Pulz, F.A. 1998. Estudo da dinâmica e a modelagem d a estrutura diamé-trica de uma floresta semidecídua Montana na região de Lavras-MG. Dissertação de mestrado. Universidade Federal de Lavras, Lavras. Ribeiro, J.F. & Walter, B.M.T. 2008. As principais fitofi sionomias do bioma
Cerrado. Pp. 408. In: S. M. Sano; S. P. Almeida and J. F. Ribeiro (eds.). Cerrado: Ecologia e Flora. Brasília, Embrapa Cerrados: Embrapa Informação Tecnológica.
Roitman, I.; Felfili, J.M. & Rezende, A.V. 2008. Tree dynamic s of a fire-pro-tected cerrado sensu stricto surrounded by forest plantations, over a 13-year period (1991-2004) in Bahia, Brazil. Plant Ecology 197: 255-267. Schiavini, I. & Araújo, G.M. 1989. Considerações sobre a vege tação da
Reserva Ecológica do Panga (Uberlândia). Sociedade & Natureza 1: 61-66.
Silva, J.N.M.; Carvalho, J.O.P.; Lopes, J.D.A.; Almeida, B.F.; Costa , D.H.M.; Oliveira, L.C.; Vanclay, J.K. & Skovsgaard, J.P. 1995. Growth and yield of a tropical rain-forest in the Brazilian Amazon 13 years after logging. Forest Ecology and Management 71: 267-274.
Silva, M.R. & Araújo, G.M. 2009. Dinâmica da comunidade arbórea de u ma floresta estacional semidecidual em Uberlândia, MG, Brasil. Acta Botanica Brasilica 23: 49-56.
Silva, N.R.S.; Martins, S.V.; Meira Neto, J.A.A. & Souza, A.L. 2004. posição florística e estrutura de uma floresta estacional semidecidual montana em Viçosa, MG. Revista Árvore 28: 397-405.
Slik, J.W.F. 2004. El Nino droughts and their effects on tree species compo-si tion and divercompo-sity in tropical rain forests. Oecologia 141: 114-120. Swaine, M.D. & Lieberman, D. 1987. Note on the calculation of mortality
rates . Journal of Tropical Ecology 3: ii-iii.
Swaine, M.D.; Lieberman, D. & Hall, J.B. 1990. Structure and dynamics of a tr opical dry forest in Ghana. Vegetatio 88: 31-51.
Swaine, M.D.; Lieberman, D. & Putz, F.E. 1987. The dynamics of tree populatio ns in tropical forest - a review. Journal of Tropical Ecol-ogy 3: 359-366.
Turner, I.M. 2001. The ecology of trees in the tropical rain forest. Cam-bridg e, CamCam-bridge University Press.
Uhl, C.; Clark, K.; Dezzeo, N. & Maquirino, P. 1988. Vegetation dynamics in A mazonian treefall gaps. Ecology 69: 751-763.
Vale, V.S.; Schiavini, I.; Lopes, S.F.; Dias Neto, O.C.; Oliveira, A.P. & Gus son, A.E. 2009. Composição florística e estrutura do componente arbóreo em um remanescente primário de foresta estacional semidecidual em Araguari, Minas Gerais, Brasil. Hoehnea 36: 417-429.
Werneck, M.D. & Franceschinelli, E.V. 2004. Dynamics of a dry forest fragment afte r the exclusion of human disturbance in southeastern Brazil. Plant Ecology 174: 337-346.
Appendix 1. List of the tree species within the forest gradient studied at the Panga Ecological Station in Brazil. The species are shown in alphabetical order by botanical family (53 families comprising 165 species), followed by their respective occurrences in the vegetation formations during the interval from 1997 to 2007.
FAMILY Occurrence N
Species C SF GF 1997 2002 2007
ANACARDIACEAE
Astronium fraxinifolium Schott ex Spreng. X X 6 6 6
Lithraea molleoides (Vell.) Engl. X X X 84 48 25
Tapirira guianensis Aubl. X X X 102 110 103
ANNONACEAE
Annona crassifl oraMart. X 3 3 3
Cardiopetalum calophyllum Schltdl. X X 7 10 4
Duguetia lanceolata A.St.-Hil. X 1 1 1
Unonopsis lindmanii R.E.Fr. X X 4 6 8
Xylopia aromatica (Lam.) Mart. X X 28 38 43
APOCYNACEAE
Aspidosperma cuspa (Kunth) S.F.Blake ex Pittier X X X 97 94 91
Aspidosperma cylindrocarpon Müll.Arg. X X X 43 48 47
Aspidosperma olivaceum Müll.Arg. X 10 12 9
Aspidosperma parvifolium A.DC. X 26 26 23
Aspidosperma subincanum Mart. ex A.DC. X X 32 30 28
ARALIACEAE
Dendropanax cuneatus (DC.) Decne. & Planch. X X 11 13 14
Scheffl era macrocarpa (Cham. & Schltdl.) Frodin X 2 1 1
ARECACEAE
Acrocomia aculeata (Jacq.) Lodd. ex Mart. X 8 7 7
Syagrus fl exuosa (Mart.) Becc. X 1 1 1
ASTERACEAE
Piptocarpha rotundifolia (Less.) Baker X 1 -
-BIGNONIACEAE
Cybistax antisyphilitica (Mart.) Mart. X 1 1 1
Handroanthus impetiginosus (Mart. Ex DC) Mattos X X 3 2 2
Handroanthus umbellatus (Sonder) Mattos X X 5 5 4
Tabebuia roseoalba (Ridl.) Sandwith X X X 22 22 21
BORAGINACEAE
Cordia alliodora (Ruiz & Pav.) Oken X 1 1 1
Cordia sp. X X 6 5 4
BURSERACEAE
Protium heptaphyllum (Aubl.) Marchand X X 43 45 51
CANNABACEAE
Celtis iguanaea (Jacq.) Sarg. X 2 2 1
CARYOCARACEAE
-FAMILY Occurrence N
Species C SF GF 1997 2002 2007
CELASTRACEAE
Cheiloclinium cognatum (Miers.) A.C.Sm. X X 7 7 8
Maytenus fl oribunda Reissek X X 40 44 46
Plenckia populneaReissek X 4 4 2
CHRYSOBALANACEAE
Couepia grandifl ora (Mart. & Zucc.) Benth. ex Hook.f. X 1 1 1
Hirtella gracilipes (Hook.f.) Prance X 1 2 3
Licania humilis Cham. & Schltdl. X 1 1 1
CLUSIACEAE
Calophyllum brasiliense Cambess. X 12 18 16
Garcinia brasiliensisMart. X 2 2 3
Kielmeyera coriacea Mart. & Zucc. X 1 1
-COMBRETACEAE
Terminalia argentea (Cambess.) Mart. X X 6 6 6
Terminalia glabrescens Mart. X X X 65 64 68
Terminalia phaeocarpa Eichler X X 52 53 44
CONNARACEAE
Connarus suberosusPlanch. X 4 1 1
EBENACEAE
Diospyros burchellii Hiern. X 14 16 15
Diospyros hispida A.DC. X X 198 195 170
ERYTHROXYLACEAE
Erythroxylum deciduum A.St.-Hil. X X 14 9 7
EUPHORBIACEAE
Croton urucurana Baill. X X 3 1
-FABACEAE
Acacia polyphylla DC. X X 10 10 11
Acosmium subelegans (Mohlenbr.) Yakovlev X 16 15 9
Agonandra brasiliensis Miers ex Benth. & Hook. X X 2 3 3
Albizia niopoides (Spruce ex Benth.) Burkart X 2 2 3
Anadenanthera colubrina (Vell.) Brenan X X X 110 108 105
Apuleia leiocarpa (Vogel) J.F.Macbr. X 2 2 2
Bauhinia ungulata L. X X X 21 20 17
Bowdichia virgilioidesKunth X 8 8 6
Copaifera langsdorffi i Desf. X X X 46 50 56
Dalbergia miscolobium Benth. X 1 1 1
Dimorphandra mollis Benth. X 2 1 1
Enterolobium gummiferum (Mart.) J.F.Macbr. X 1 1
FAMILY Occurrence N
Species C SF GF 1997 2002 2007
Inga laurina (Sw.) Willd. X 2 2 2
Inga marginata Willd. X X 2 2 1
Inga vera Willd. X X 17 17 13
Lonchocarpus cultratus X 2 2 2
Machaerium acutifolium Vogel X X 50 47 40
Machaerium brasiliense Vogel X 9 12 12
Machaerium hirtum (Vell.) Stellfeld X X X 46 43 35
Machaerium stipitatum (DC.) Vogel X 8 8 8
Ormosia arborea (Vell.) Harms X 1 2 2
Piptadenia gonoacantha (Mart.) J.F.Macbr. X 6 4 4
Platypodium elegans Vogel X X X 40 42 40
Senna silvestris (Vell.) H.S.Irwin & Barneby X X X 8 8 7
Stryphnodendron polyphyllum Mart. X 1 -
-Sweetia fruticosa Spreng. X 9 11 13
LACISTEMACEAE
Lacistema aggregatum (P.J.Bergius) Rusby X - 1 1
LAMIACEAE
Aegiphila sellowianaCham. X 1 1 1
LAURACEAE
Aniba heringeri Vattimo-Gil X 4 3 3
Endlicheria paniculata (Spreng.) J.F.Macbr. X X 23 18 18
Lauraceae 1 X 1 1 1
Lauraceae 2 X 1 -
-Nectandra cissifl ora Nees X X 32 33 41
Ocotea corymbosa (Meisn.) Mez X X X 11 8 12
Ocotea minarum (Nees) Mez X X 15 17 16
Ocotea percoriacea (Meisn.) Kosterm. X 1 -
-Ocotea pulchella Mart. X X X 43 32 19
LECYTHIDACEAE
Cariniana estrellensis (Raddi) Kuntze X 10 10 10
LOGANIACEAE
Strychnos pseudoquina A.St.-Hil. X 1 -
-MAGNOLIACEAE
Magnolia ovata (A.St.-Hil.) Spreng. X 8 7 6
MALPIGHIACEAE
Byrsonima crassaNied. X 2 1 1
Byrsonima sp X 1 1 1
MALVACEAE
Apeiba tibourbouAubl. X 2 2 2
FAMILY Occurrence N
Species C SF GF 1997 2002 2007
Eriotheca gracilipes (K.Schum.) A.Robyns X 1 1
-Guazuma ulmifolia Lam. X X X 83 60 37
Luehea divaricata Mart. X X 28 24 23
Luehea grandifl ora Mart. & Zucc. X X 91 91 96
Pseudobombax tomentosum (Mart. & Zucc.) A.Robyns X X 6 5 5
MELASTOMATACEAE
Miconia albicans (Sw.) Triana X 4 6 8
Miconia calvescens Schrank & Mart. ex DC. X 1 1
-MELIACEAE
Guarea kunthiana A.Juss. X 1 1 1
Trichilia catigua A.Juss. X 1 1 1
Trichilia elegans A.Juss. X - - 1
Trichilia pallida Sw. X X 5 7 7
MORACEAE
Brosimum gaudichaudii Trécul X X 3 3 1
Ficus enormis (Mart. ex Miq.) Mart. X 1 1 1
Maclura tinctoria (L.) Steud. X 1 1
-MYRISTICACEAE
Virola sebiferaAubl. X X 2 2 7
MYRSINACEAE
Myrsine coriacea (Sw.) Roem. & Schult. X X X 15 15 10
Myrsine umbellata Mart. X X 60 61 45
MYRTACEAE
Calyptranthes widgreniana O.Berg X 10 9 6
Campomanesia velutina (Cambess.) O.Berg X 139 101 63
Eugenia aurata O.Berg X 1 1 1
Eugenia fl orida DC. X X X 20 22 22
Eugenia involucrata DC. X 16 23 25
Eugenia ligustrina (Sw.) Willd. X X 9 9 13
Myrcia castrensis (O. Berg) D. Legrand X 1 1
-Myrcia laruotteana Cambess. X 1 1
-Myrcia splendens (Sw.) DC. X X 66 45 31
Myrcia tomentosa (Aubl.) DC. X X 39 40 40
Myrcia variabilis DC. X 2 1
-Psidium rufum DC. X 5 5 5
Psidium sartorianum (O.Berg) Nied. X 5 5 8
Psidium sp X 4 4 4
NYCTAGINACEAE
Guapira noxia (Netto) Lundell X 2 2 2
FAMILY Occurrence N
Species C SF GF 1997 2002 2007
Neea hermaphrodita S.Moore X 2 2 2
OCHNACEAE
Ouratea castaneifolia (DC.) Engl. X X 10 10 12
OLACACEAE
Heisteria ovata Benth. - 1 1
OLEACEAE
Chionanthus trichotomus (Vell.) P.S.Green X X 11 13 13
PHYLLANTHACEAE
Margaritaria nobilis L.f. X 2 2 3
Phyllanthus acuminatus Vahl X 1 1 2
PICRAMNIACEAE
Picramnia sellowii Planch. X 1 1
-POLYGONACEAE
Coccoloba mollis Casar. X X 3 3 2
PROTEACEAE
Roupala brasiliensis Klotzsch X X 23 22 21
Roupala montana Aubl. X X 28 27 25
Rhamnidium elaeocarpum Reissek X X X 53 45 36
ROSACEAE
Prunus selowi X 3 2 1
RUBIACEAE
Cordiera sessilis X X X 193 237 327
Coussarea hydrangeifolia (Benth.) Müll.Arg. X X X 43 68 84
Coutarea hexandra (Jacq.) K.Schum. X 3 3 3
Faramea nigrescens Mart. X X X 20 35 50
Guettarda viburnoides Cham. & Schltdl. X X 50 45 40
Ixora gardneriana Benth. X 1 1 1
Rudgea viburnoides (Cham.) Benth. X X 36 37 44
Simira viridifl ora (Allemão & Saldanha) K.Schum. X 5 6 5
Tocoyena formosa (Cham. & Schltdl.) K.Schum. X 1 2 2
SALICACEAE
Casearia gossypiosperma Briq. X X 7 7 7
Casearia rupestris Eichler X X 15 13 12
Casearia sylvestris Sw. X X X 83 82 68
Prockia crucis P.Browne ex L. X 1 4 3
SAPINDACEAE
Allophylus sericeus X 2 1 1
Cupania vernalis Cambess. X X 112 77 65
Dilodendron bipinnatum Radlk. X 22 19 18
FAMILY Occurrence N
Species C SF GF 1997 2002 2007
Matayba guianensis Aubl. X X X 185 173 165
SAPOTACEAE
Chrysophyllum marginatum (Hook. & Arn.) Radlk. X X X 309 274 222
Pouteria gardneri (Mart. & Miq.) Baehni X X 13 13 13
Pouteria torta (Mart.) Radlk. X 8 10 11
SIPARUNACEAE
Siparuna guianensis Aubl. X 2 7 15
STYRACACEAE
Styrax camporum Pohl X X X 74 65 56
Styrax ferrugineus Nees & Mart. X 1 1 1
SYMPLOCACEAE
Symplocos pubescens Klotzsch ex Benth. X X X 23 26 26
URTICACEAE
Cecropia pachystachya Trécul X X X 9 8 10
VOCHYSIACEAE
Qualea dichotoma (Mart.) Warm. X X X 8 10 10
Qualea grandifl ora Mart. X X 89 85 82
Qualea multifl ora Mart. X 3 3 1
Qualea parvifl ora Mart. X 4 4 3
Vochysia tucanorum Mart. X X X 71 72 54