The decrease in uroporphyrinogen
decarboxylase activity induced by
ethanol predisposes rats to the
development of porphyria and
accelerates xenobiotic-triggered
porphyria, regardless of hepatic
damage
Laboratorio de Porfirias Experimentales y Metabolismo del Hemo,
Departamento de Química Biológica, Facultad de Ciencias Exactas y Naturales, Universidad de Buenos Aires, Buenos Aires, Argentina
M.C. Ríos de Molina, M.B. Mazzetti, M. Galigniana, C. Aldonatti, J.M. Tomio and L.C. San Martín de Viale
Abstract
We evaluated the porphyrinogenic ability of ethanol (20% in drinking water) per se, its effect on the development of sporadic porphyria cutanea tarda induced by hexachlorobenzene in female Wistar rats (170-190 g, N = 8/group), and the relationship with hepatic damage. Twenty-five percent of the animals receiving ethanol increased up to 14-, 25-, and 4.5-fold the urinary excretion of d-aminolevulinate, porphobilinogen, and porphyrins, respectively. Ethanol exacerbated the precursor excretions elicited by hexachlorobenzene. Hepatic por-phyrin levels increased by hexachlorobenzene treatment, while this parameter only increased (up to 90-fold) in some of the animals that received ethanol alone. Ethanol reduced the activities of uroporphy-rinogen decarboxylase, d-aminolevulinate dehydrase and ferroche-latase. In the ethanol group, many of the animals showed a 30% decrease in uroporphyrinogen activity; in the ethanol + hexachloro-benzene group, this decrease occurred before the one caused by hexachlorobenzene alone. Ethanol exacerbated the effects of hexa-chlorobenzene, among others, on the rate-limiting enzyme d -amino-levulinate synthetase. The plasma activities of enzymes that are mark-ers of hepatic damage were similar in all drug-treated groups. These results indicate that 1) ethanol exacerbates the biochemical manifesta-tion of sporadic hexachlorobenzene-induced porphyria cutanea tarda; 2) ethanol per se affects several enzymatic and excretion parameters of the heme metabolic pathway; 3) since not all the animals were affected to the same extent, ethanol seems to be a porphyrinogenic agent only when there is a predisposition, and 4) hepatic damage showed no correlationwith the development of porphyria cutanea tarda.
Correspondence
L.C. San Martín de Viale O’Higgins 4332, C1429BCF Buenos Aires (1429) Argentina
Fax: +54-11-4576-3342 E-mail: smartin@qb.fcen.uba.ar Research supported by CONICET (PIP 4464/96) and University of Buenos Aires (UBA-TW 03/98). C. Aldonatti is member of Technical Assistance Career and M.C. Ríos de Molina and L.C. San Martín de Viale are members of Scientific Research Career of CONICET, Argentina.
Received August 29, 2001 Accepted August 12, 2002
Key words
·Alcoholism ·Ethanol
·Heme metabolic pathway ·Hepatic damage
Introduction
Porphyrias are diseases associated with alterations of heme metabolic pathway en-zymes (1). Chronic alcoholism has been recognized as the main factor triggering porphyria cutanea tarda (PCT), the most common form of porphyria in humans, which is clinically characterized by severe cutane-ous photosensitivity. PCT patients can ac-cumulate porphyrins in the skin which un-dergo photoexcitation, leading to cell injury (1,2).
Biochemically, PCT is associated with a deficiency in uroporphyrinogen decarboxyl-ase (UroD) activity and with excessive uri-nary excretion and hepatic accumulation of higher carboxylated porphyrins (3-6). There are two main types of PCT: sporadic PCT (type I), and familial PCT (type II). The familial disease is inherited as an autosomal dominant defect in the UroD gene, and is manifested in all tissues (4,5). Patients with the sporadic type present the defective UroD only in the liver, and no related hereditary component is known (2). In both types of PCT, exogenous factors seem to be respon-sible for the clinical manifestation of the disease. Among these, alcohol and estrogens are considered to be the most important (2,7). Hexachlorobenzene (HCB), a xenobiotic with recognized porphyrinogenic activity (8), mimics human PCT when administered to rats.
Studies have been carried out to investi-gate the response of induced PCT to chronic alcohol treatment. Several investigators have reported alterations in different parameters of the heme pathway, but the situation re-mains unclear (2). Thus, the effects of com-bined exposure to other xenobiotics cannot be predicted since they generally vary ac-cording to the system studied. These varia-tions may be attributed to differences be-tween animal groups (9), the methodology applied in the determinations, or animal han-dling.
The present study was undertaken in or-der to obtain more information about this subject by evaluating: 1) the porphyrinogenic ability of ethanol, 2) the effect of ethanol intake on the development of experimental PCT induced by HCB, and 3) the possible relationship between porphyria and hepatic damage. To minimize the variations cited above, an attempt was made to identify as many key parameters as possible in the same animal. These parameters included: a) uri-nary excretion of porphyrins and precursors, b) hepatic levels of cytochrome P-450 and porphyrins, c) hepatic enzyme activities of the heme metabolic pathway, and d) the plasma activities of enzymes that are mark-ers of hepatic damage.
We used a model involving chronic alco-hol intake in order to avoid malnutrition, treatment rejection and/or severe hepatic damage.
Material and Methods
HCB (commercial grade), composed of 95% HCB and 5% tetrachlorobenzene and pentachlorobenzene, was a gift from Com-pañía Química S.A., Buenos Aires, Argen-tina. Uroporphyrin III was from Porphyrin Products, Inc. (Logan, UT, USA); uropor-phyrinogen was prepared by reduction with sodium amalgam (10). Aminolevulinate (ALA), porphobilinogen (PBG), Dowex 1-X8-400, and Dowex 50-X8-400 were from Sigma (St. Louis, MO, USA). Sephadex G-25 was purchased from Pharmacia (Uppsala, Sweden). Protoporphyrin IX was a generous gift from Dr. Moises Grinstein (Faculty of Sciences, University of Buenos Aires, Buenos Aires, Argentina). All other chemicals were of analytical grade.
Animals and treatments
conducted in accordance with international guidelines (Guide for Care and Use of Labo-ratory Animals, National Research Council, USA, 1996, and the Council of the European Communities Directive, 86/609/ECC). Ani-mals were maintained on a 12-h light/dark cycle, at 20-24ºC and 45-75% humidity, fed Purina 3 dietand water adlibitum, and ran-domly divided into four groups of 8 animals each. The reported data are the result of three independent experiments, since all controls were homogeneous.
The following groups were used: control, untreated group; ethanol, treated with 20% (v/v) ethanol in drinking water; HCB, treated with 1 g/kg body weight HCB, suspended in water (40 mg/ml) with the aid of Tween 20 (0.5%, v/v) and administered by gavage 5 days a week, and (ethanol + HCB), treated with ethanol and HCB as described for the ethanol and HCB groups. Feeding bottles were placed in the inverted position to re-duce ethanol evaporation. Moreover, the so-lution was replaced daily in order to reduce possible variation in ethanol concentration. Generally no deaths or external alterations resulted from treatment at this dose of HCB alone. The low level of toxicity was indica-tive of the minimal absorption of HCB across the intestinal tract when administered in water (11). In previous studies, no changes were observed in any of the parameters studied between animals treated with vehicle and untreated animals (data not shown). For this reason, vehicle-treated controls were omit-ted from this study.
Determination of urinary d-aminolevulinic
acid, porphobilinogen and porphyrins
For urine collection, animals were housed for 24 h in metabolic cages, fasted, allowed water ad libitum and 24-h urine was col-lected. Metabolites were measured every 2 days in aliquots of 2 ml and 0.1 ml from control and porphyric urine samples, respec-tively, as described previously (12).
Assays
Treatment lasted 1, 3, 6, or 8 weeks. At the end of treatment, animals from each group were anesthetized with ether, and arterial blood was collected into heparin and used for he-patic function tests. Animals were then sacri-ficed by decapitation and livers removed. Af-ter separating 1 g from each liver for d -amino-levulinate synthase (ALA-S) determination, a whole homogenate in 0.154 M KCl (1:5, w/v) was prepared for further determinations.
Hepatic porphyrin content
Total porphyrins were estimated spectro-photometrically in 5% HCl (w/v) as described by San Martín de Viale et al. (13).
Hepatic cytochrome P-450
The content of hepatic cytochrome P-450 was determined by the method of Omura and Sato (14).
Preparation of enzyme extracts
The whole homogenate (see Assays) was submitted to differential centrifugation. Mi-tochondria obtained by centrifugation at 11,000 g were washed with saline and used to measure ferrochelatase activity. Aliquots of the 11,000 g supernatant were used to measure ALA dehydrase (ALA-D) and UroD activities, while another aliquot was centri-fuged for 1 h at 105,000 g to separate micro-somes for cytochrome P-450 determination. All procedures were carried out at 4ºC.
Enzyme activities
UroD activity was measured in the 11,000
g supernatant using uroporphyrinogen III as substrate, and the reaction products were quantified by HPLC as methyl ester porphy-rins (12). Enzyme activity is reported as nmol decarboxylated uroporphyrinogen (sum of 7-, 6-, 5-, and 4-COOH porphyrinogen formed)/30 min per mg protein.
Ferrochelatase activity was measured using mitochondria disrupted by thermal shock as the source of enzyme and iron and protoporphyrin IX as substrates according to Ríos de Molina el al. (16). Activity is re-ported as nmol heme/30 min per mg protein.
Protein concentration
Protein concentration was determined by the method of Lowry et al. (17) using bovine serum albumin as standard.
Liver function tests
Alanine aminotransferase, aspartate ami-notransferase, alkaline phosphatase, g -gluta-myl transpeptidase, lactate dehydrogenase and pseudocholinesterase were measured using commercial kits (Wiener Lab., Rosario, Santa Fe, Argentina).
Statistical analysis
Results are reported as median and range and were analyzed statistically by nonpara-metric methods. Kruskal-Wallis ANOVA and the Mann-Whitney test for unpaired samples were employed since there was neither homo-scedasticity nor normal distributions.
Results
During the experimental period, treated animals did not suffer from dehydration or malnutrition; weight was similar in all ani-mals which, in general, appeared to be healthy. However, some rats receiving both drugs (2.5% of this group)showed a
signifi-cant loss of weight and weakness, and they died even though treatment was immedi-ately interrupted. All the other animals were in a healthy condition, and gained weight at the same rate during treatment.
The volume of aqueous alcohol ingested was 16.8 ± 2.8 ml/day and that of the animals receiving only water was 17.3 ± 1.0 ml/day. Therefore, the presence of ethanol in water did not affect the daily volume intake. The daily amount of ethanol ingested by each animal that received alcohol, expressed as g ethanol/kg body weight, was 14.4 ± 2.1 and 14.8 ± 1.3 g/kg in the ethanol and ethanol + HCB groups, respectively.
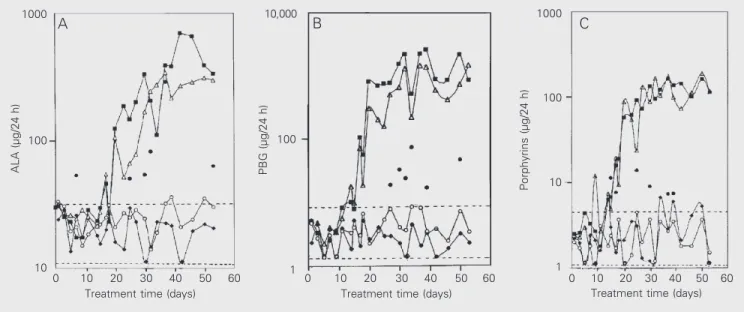
The evolution of the urinary excretion of ALA, PBG, and porphyrins is shown in Fig-ure 1A-C which shows data representative of three independent experiments.The ma-jority of the rats exposed to ethanol were not different from controls in terms of ALA, PBG and porphyrins. However, 25% of the animals (filled circles in Figure 1A-C) showed higher values than control for the heme intermediates measured. These values were 50-300 vs 21.3 ± 13.3 µg ALA/day (2.5- to 14-fold increase), 18-75 vs 3.0 ± 2.5 µg PBG/day ( to 25-fold increase) and 6-13 vs 2.9 ± 2.0 µg porphyrins/day (2- to 4.5-fold increase). Excretion of metabolites in-dicative of porphyria by animals treated with both drugs (ethanol + HCB), or with HCB alone, was considerably elevated beginning from the third week of exposure, and in-creased in a time-dependent way. In these groups, maximum values were 696 µg ALA/ 24 h (33-fold increase), 2,547 µg PBG/24 h (849-fold) and 164 µg porphyrins/24 h (16-fold) in the ethanol + HCB group, and 339 µg ALA/24 h (16-fold), 1,420 µg PBG/24 h (473-fold) and 189 µg porphyrins/24 h (67-fold) in the HCB group.
showed normal excretion values of all heme intermediates, even at the longest exposure time (data not shown).
The liver weight/body weight ratio of animals receiving HCB or ethanol + HCB treatments was 25-60% higher than controls (4.4 ± 0.4%) from the first week of exposure to the end of the experiment (Table 1). In addition, there were no significant differ-ences between the two experimental groups receiving HCB. Animals receiving only etha-nol were within the normal range.
HCB, alone or with ethanol, caused hepa-tocyte enlargement, whereas ethanol alone did not have this effect (data not shown).
The values of hepatic porphyrin of both HCB-treated groups were significantly higher than those of control animals, even during the first week of treatment (Table 1) and these increases were time-dependent for both groups. However, the extent of increase was related to treatment since it was lower in animals receiving both drugs than in those treated only with HCB. The median values obtained for the different times in the
etha-nol group did not differ statistically from the age-matched control. It is important to note that when the behavior of each individual animal was analyzed some alcohol-treated animals showed increases that reached 16-and 90-fold the control values by the sixth and eighth weeks, respectively.
Hepatic cytochrome P-450 is involved in the metabolism of a wide range of xeno-biotics, HCB among them. The results ob-tained (Table 1) show that the group receiv-ing only alcohol exhibited a slight, transient increase at the beginning of exposure, which was significantly different during the first and third weeks. Both HCB-treated groups displayed similar profiles even when the extent of the alterations differed according to the treatment and intoxication times. In these groups, cytochrome P-450 was rapidly induced since significant increases (two-fold) were found during the first week, with a subsequent reduction over time, but without attaining normal values.
The first, and rate-limiting, enzyme of the heme metabolic pathway, ALA-S, was
Figure 1. Daily urinary excretion of precursors and porphyrins as a function of treatment time. A, Excretion of d-aminolevulinate (ALA); B, excretion of porphobilinogen (PBG); C, excretion of porphyrins. Female Wistar rats received 20% ethanol in drinking water and hexachlorobenzene (HCB) by gavage as described in Material and Methods. The figure shows a representative excretion pattern corresponding to one of the three independent experiments. Each point indicates the mean urinary excretion of 4 animals per group. Control (lozenges); ethanol (circles); HCB (triangles); ethanol + HCB (squares); individual rats of the ethanol group with excretion values above the controls (filled circles). The range of control values is represented between dotted lines.
ALA (µg/24 h)
1000
100
10
Porphyrins (µg/24 h)
0 10 20 30 40 50 60
Treatment time (days)
0 10 20 30 40 50 60
Treatment time (days)
0 10 20 30 40 50 60
Treatment time (days)
B
PBG (µg/24 h)
10,000
100
1000
100
1
A
10
1
Table 2. Effect of treatments on hepatic heme metabolic enzymes.
Group Week ALA-synthase ALA-dehydrase Ferrochelatase
(U/mg protein) (U/mg protein) (U/mg protein)
Control 1 7.3 (4.7-8.7) 11.4 (9.1-13.5) 1.8 (1.5-2.2)
3 7.0 (4.8-12.1) 13.8 (11.6-16.2) 1.5 (1.4-2.2)
6 8.6 (7.5-11.4) 12.1 (10.0-14.4) 1.2 (1.1-2.6)
8 9.6 (5.8-11.0) 10.8 (7.6-16.6) 1.7 (1.1-2.0)
Ethanol 1 7.3 (5.8-15.6) 13.8 (12.1-16.6) 1.7 (1.5-1.8)
3 8.3 (6.2-12.5) 13.0 (9.9-17.7) 1.4* (1.3-1.5)
6 9.8 (6.7-14.7) 12.3 (11.5-15.7) 1.2* (1.0-1.8)
8 8.1 (5.0-12.5) 8.7* (6.0-9.0) 1.2** (0.7-1.5)
HCB 1 8.3 (4.2-10.4) 9.9 (8.8-12.0) 1.9 (1.5-2.7)
3 8.8 (5.2-22.3) 12.5 (8.1-14.6) 1.8 (1.6-2.4)
6 13.5** (8.3-20.8) 14.7 (4.8-30.8) 2.3* (1.3-4.9)
8 6.2** (6.4-41.6) 20.2 (7.1-27.8) 1.9* (1.3-2.4)
Ethanol + HCB 1 7.8 (4.2-14.6) 12.1+ (9.5-13.2) 1.9 (1.4-2.4)
3 8.3 (4.2-18.7) 12.4* (8.6-13.5) 1.6 (1.4-1.8)
6 22.0**++ (15.6-46.8) 15.4* (8.8-30.3) 2.6+ (1.4-4.4)
8 26.3** (7.5-54.9) 17.7* (12.3-22.0) 2.3* (1.4-2.9)
Data are reported as median and range (in parentheses). N = 6-8 animals per group. *0.05<P<0.1, **P<0.05 compared to the respective control (Mann-Whitney test).
+0.05<P<0.1, ++P<0.05 compared to the hexachlorobenzene (HCB) group (Mann-Whitney test).
Treatment conditions were as described in the legend to Figure 1. ALA = d-aminolevulinate.
Table 1. Effect of chronic ethanol and/or hexachlorobenzene (HCB) treatment on different hepatic param-eters.
Group Week Lw/Bw (%) Porphyrins (µg/g liver) Cytochrome P-450
(nmol/mg protein)
Control 1 4.2 (3.9-4.8) 0.9 (0.5-1.9) 0.91 (0.64-1.10)
3 4.5 (3.6-5.3) 1.1 (0.7-1.6) 0.98 (0.83-1.25)
6 4.2 (3.2-5.3) 1.0 (0.6-2.4) 0.99 (0.68-1.26)
8 4.7 (3.2-4.8) 1.2 (0.7-2.4) 0.94 (0.94-1.27)
Ethanol 1 4.4 (3.4-5.1) 0.8 (0.4-1.4) 1.29* (0.65-1.76)
3 4.2 (3.4-5.1) 1.2 (0.7-1.6) 1.30* (0.76-1.59)
6 4.1 (3.4-4.8) 1.0* (0.5-16) 1.10 (0.72-1.43)
8 4.0 (3.2-4.6) 1.4* (0.7-90) 0.95 (0.89-1.40)
HCB 1 6.7** (4.6-10.5) 3.5** (1.4-25) 2.13* (0.81-3.56)
3 6.1** (4.0-8.4) 71.0** (13.0-250) 2.51** (1.22-2.62)
6 5.4** (4.3-6.3) 191.0** (38.5-370) 1.68** (0.93-1.73)
8 6.2** (4.4-6.4) 249.0** (119-632) 1.31** (1.23-1.47)
Ethanol + HCB 1 7.0** (5.3-7.7) 2.5** (1.2-6.5) 1.70** (1.20-2.87)
3 5.6** (5.1-7.6) 89.0** (24-159) 1.98** (1.20-3.70)
6 4.8** (4.8-7.6) 89.0** (28-338) 1.24** (0.98-1.80)
8 5.4** (4.8-7.2) 148.0** (73-569) 1.45** (1.13-1.80)
Data are reported as median and range (in parentheses). N = 6-8 animals per group. Lw/Bw: liver weight/body weight ratio.
*0.05<P<0.1, **P<0.05 compared to the respective control (Mann-Whitney test).
measured in hepatic tissue (Table 2). Until the third week, there were no significant differences between the groups studied. Af-ter this time, ALA-S was induced in the HCB- and ethanol + HCB-treated groups and began to show differences between them, with significant and greater increases for the ethanol + HCB-treated group. Exposure to alcohol alone did not elicit any ALA-S in-duction.
The second enzyme of the pathway, ALA-D, was measured in the hepatic cytosol (Table 2). The ethanol treatment only pro-duced the expected reduction of this enzyme activity by the eighth week, and when ad-ministered together with HCB, the maximal increase was lower than that observed with HCB alone.
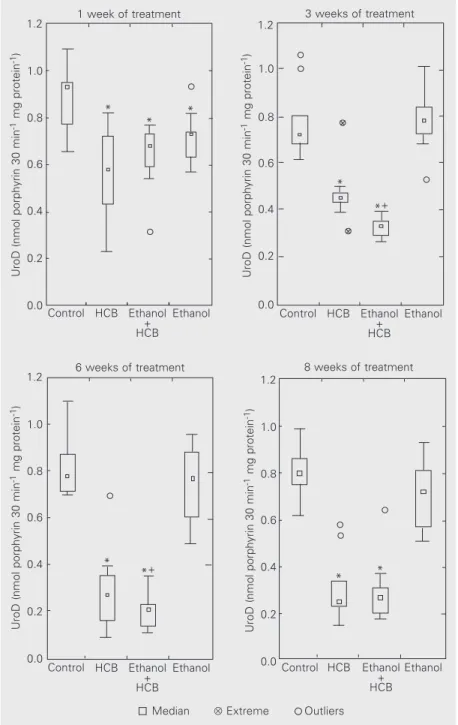
The fifth enzyme of heme metabolism and the target for HCB in sporadic induced porphyria, UroD, was measured using uro-porphyrinogen III as substrate (Figure 2). A 20 to 30% loss in UroD activity was ob-served in both groups treated with HCB from the first week, and the decrease reached 70% by the end of treatment. During the intermediate weeks, treatment with both drugs, ethanol + HCB, produced a more marked decrease in UroD activity than that observed in rats receiving only HCB. In the group treated only with ethanol, UroD activ-ity was significantly lower than control only during the first week. At the other times assayed, while there were no significant dif-ferences between the medians for the two groups (control and ethanol), the lower lim-its for the ethanol group were always below control, with UroD reductions of 18 and 30% compared to control at the third and sixth weeks, respectively.
Ferrochelatase, the last enzyme of the heme pathway, was reduced in a time-dependent manner after treatment with etha-nol. The effect was significant from the third week. Both groups treated with HCB showed statistically significant increases in this en-zyme activity after the sixth week of treatment.
The enzymes aspartate aminotransferase and alanine aminotransferase (biomarkers of hepatic cell damage), lactate
dehydrogen-Figure 2. Uroporphyrinogen decarboxylase (UroD) enzyme activity. The UroD activity control value was 0.80 ± 0.03 nmol uroporphyrin/30 min per mg protein. The enzyme was meas-ured at the times indicated for the different groups of animals, as described in Material and Methods. N = 6-8 animals per group. Values at the extremes of boxes represent the first and third quartiles. *P<0.05 compared to control (Mann-Whitney test). +0.05<P<0.1
com-pared to the hexachlorobenzene (HCB) group (Mann-Whitney test).
6 weeks of treatment 8 weeks of treatment
UroD (nmol porphyrin 30 min
-1 mg protein -1)
1.2
1.0
0.8
0.6
0.4
0.0 0.2
UroD (nmol porphyrin 30 min
-1 mg protein -1)
1.2
1.0
0.8
0.6
0.4
0.0 0.2
Control HCB Ethanol + HCB
Ethanol Control HCB Ethanol
+ HCB
Ethanol
* *
*+ *
Median ÄExtreme Outliers
UroD (nmol porphyrin 30 min
-1 mg protein -1)
1.2
1.0
0.8
0.6
0.4
0.0 0.2
Control HCB Ethanol + HCB
Ethanol
1 week of treatment 3 weeks of treatment
UroD (nmol porphyrin 30 min
-1 mg protein -1)
1.2
1.0
0.8
0.6
0.4
0.0 0.2
Control HCB Ethanol + HCB
Ethanol
*
* *
*
ase (sensitive to cellular injury, and a marker of hemolysis), g-glutamyl transpeptidase (a marker of biliary system obstruction), pseu-docholinesterase (a marker of exposure to xenobiotics), and alkaline phosphatase were measured as indicators of hepatic injury (Fig-ure 3). The profiles of all enzyme activities for the three treated groups, ethanol, HCB and ethanol + HCB, were similar, and the values showed time-dependent differences with respect to the control, particularly no-ticeable at the end of treatment. All the en-zymes assayed showed increases as a conse-quence of single (ethanol or HCB) or com-bined (ethanol + HCB) treatment, with the exception of pseudocholinesterase whose ac-tivity tended to decrease in response to the three treatments. In general, the greatest dif-ferences from control values were found in the group receiving both drugs (ethanol + HCB).
Discussion
In the present study, ingestion of 20% (v/v) alcohol did not cause any alterations in body weight or in the general appearance of the rats. For this reason, we believe that the metabolic alterations observed can be as-cribed to specific effects on hepatocytes gen-erated by the drugs, and are not of nutritional origin. Possibly, rats that received both drugs and died represent a group of more suscep-tible animals. In previous work we have identified three different groups of rats; one that is highly susceptible and responds to HCB treatment within a very short time, another that responds moderately and a third one that is less susceptible and could remain biochemically and biophysically stable even after long treatment (18). It has been sug-gested that this difference may be of multi-genic origin (9), as proposed by Elder (2) for
AST (units/l)
30
20
10
0
AP (units/l)
450
300
150
0
ALT (units/l)
45
30
15
0
GGT (units/l)
60
40
20
0
Pch x 1000 (units/l)
8
6
4
0
2 LDH (units/l)
400
300
200
0 100
0 2 4 6 8 10 0 2 4 6 8 10
0 2 4 6 8 10
0 2 4 6 8 10
0 2 4 6 8 10
Treatment time (weeks) Treatment time (weeks)
Figure 3. Hepatic enzymes as markers of liver injury. Data points indicate the median of 6-8 animals per group. Ethanol (circles); HCB (triangles); etha-nol + HCB (squares). The range of control values is represented between the dotted lines. *P<0.05 compared to controls (Mann-Whitney test). HCB = hexachlorobenzene; AST = as-partate aminotransferase; AP = alkaline phosphatase; PCh = pseudocholinesterase; ALT = alanine aminotransferase; GGT = g-glutamyl transpeptidase; LDH = lactate dehydrogenase.
** *
* *
*
* *
* *
*
*
* * *
*
* *
* ** *
* * **
* * * * *
* *
0 2 4 6 8 10
*
human acquired PCT. In this respect, the author defines as susceptible the subjects that can develop ethanol-induced PCT, with the mechanism involved being unknown.
Ibrahim et al. (19) also found different degrees of susceptibility to the inhibitory effect of ethanol on the heme metabolic pathway of rabbits.
The lack of alcohol-mediated induction of ALA-S activity observed (Table 2), in accordance with the results of Kondo and Shimizu (20), may be the consequence of the insufficient ethanol-induced decrease in UroD, which did not reach the 50% level necessary to deregulate the pathway (12). The decreased ferrochelatase activity ob-served for this group supports the interpreta-tion of Doss et al. (7,21), who attributed this reduction to the lack of the enzyme’s cofac-tor, pyridoxal phosphate. The decrease in ferrochelatase and UroD activities elicited in the ethanol-treated group would not be sufficient to reduce the ALA-S regulatory heme pool. The decreases observed here in these heme pathway enzymes agree with the reported in vivo effect of ethanol on them (22).
Nevertheless, the small but sustained block produced by ethanol at the level of UroD might be the cause of hepatic porphy-rin accumulation exhibited by all animals during the experiment, and of the increase in the excretion of porphyrins and their precur-sors observed in some of the exposed ani-mals. In the most susceptible animals, these increases exceeded 14, 25 and 4.5 times control values for ALA, PBG and porphy-rins, respectively. Although they did not reach the maximum values obtained with HCB, these significant increases may indicate an alteration in the heme metabolic pathway, specifically at the UroD level. This hypo-thesis is alsosupported by the increase in the hepatic porphyrin content shown by some animals in the ethanol group. However, the maximum values of ALA and PBG excre-tion in the ethanol + HCB group were
ap-proximately twice as high as those of the HCB group. Again, this would suggest that ethanol affects the development of HCB-induced porphyria.
These results agree with those of Doss (7), who found that patients who ingest more than 60 g/day of alcohol show a 3- to 6-fold increase over normal values in urinary ex-cretion of ALA, PBG, and porphyrins. Since an increase in urinary excretion of porphy-rins and precursors was not observed in most of the animals that received only ethanol, we suggest that the animals that do show in-creases might be predisposed to developing sporadic porphyria. Similarly, in humans, ethanol and various porphyrinogenic agents were reported to trigger porphyria only in susceptible subjects (2).
Since ethanol can generate free radicals (23), the early decrease in UroD activity produced by this drug may be due to UroD inhibitor formation through oxygen free radi-cal species (24).
The initial increase in P-450 content ob-served in the three treated groups corre-sponds to a primary response to administra-tion of the drug in the form of an inducadministra-tion of this hemoprotein due to its detoxifying func-tion. This is followed by a mechanism of adaptation to the treatment that leads to the normalization of cytochrome content (25). The most significant increases detected were observed in the group treated with both drugs at one week, and can be attributed to the sum of the effects of ethanol and HCB on the different P-450 isoforms involved in their metabolism (26,27).
de-crease in UroD occurred earlier, and in some weeks was greatest in the ethanol + HCB group, enzyme activity values were not suf-ficiently different from those of the HCB-treated animals to produce differences at the level of urinary porphyrin excretion (Figures 2 and 1C).
The lower increase in ALA-D activity observed in the group with double treatment compared to HCB alone shows that ethanol is able to modify the response to HCB.
Alcohol exacerbated the increase pro-duced by HCB in ferrochelatase levels at longer treatment times. Since ferrochelatase is the last enzyme of the pathway, this in-crease could be a compensatory response to the decrease in UroD.
ALA-S, ferrochelatase, and UroD were the heme metabolic pathway enzymes most affected in the group receiving both drugs, suggesting a synergistic effect of ethanol on the induction of experimental PCT by the fungicide. The differences in the levels of these enzyme activities did not result in in-creased porphyrin excretion or hepatic accu-mulation. This result can be attributed to a competition by the two drugs for some type of cytochrome which is responsible for the tetrapyrrole oxidation and excretion.
The liver weight/body weight ratio, a marker of macroscopic hepatic alteration, was modified by the fungicide HCB, but not by ethanol. Consequently, the enlarged hepa-tocytes in HCB-treated rats were probably due to changes in the reticuloendoplasmic system, as well as to the proliferation of small lipid droplets, as previously reported (28). The similar alterations in liver weight/
body weight ratio observed in both HCB groups, but not in ethanol-exposed rats, did not parallel the changes in plasma enzyme activities, since plasma enzyme levels were affected similarly in all treated groups. There-fore, hepatic damage was not correlated with development of porphyria, and we consider the alteration of the liver weight/body weight parameter to be related to the onset of spo-radic porphyria in experimental animals. Moreover, since alcohol treatment did not affect this ratio under our experimental con-ditions, ethanol would not generate
porphy-ria per se, but instead would predispose to,
and/or exacerbate, the disease induced by porphyrinogenic drugs such as HCB.
The mild effects caused by the alcoholic treatment applied here might be due to the dose of ethanol used. This treatment, how-ever, allowed us to conclude that this dose of alcohol may induce a pre-porphyric state without causing hepatic damage.
Although alcohol may induce sporadic porphyria only in genetically predisposed humans (2), the present results indicate that ethanol does exacerbate the biochemical manifestations in overt porphyrias. Conse-quently, since slightly porphyrinogenic com-pounds such as ethanol might produce a pre-porphyric state, it is advisable to avoid the intake of alcohol in all cases of suspected hepatoporphyria.
Acknowledgments
We thank Dr. A.S. Haedo for help and advice with the statistical evaluations.
References
1. Kappas SA, Sassa S, Galbraith RA & Nordmann Y (1995). The porphyrias. In: Scriver CR, Beaude AL, Sly S & Valle D (Editors), The Molecular and Metabolic Ba-sis of Inherited Disease. 7th edn. McGraw-Hill, New York, NY, USA, 2103-2160.
2. Elder GH (1998). Porphyria cutanea tarda. Seminars in Liver Disease, 18: 67-75. 3. Nacht S, San Martín de Viale LC &
Grinstein M (1970). Human porphyria cutanea tarda. Isolation and properties of the urinary porphyrins. Clinica Chimica Acta, 27: 445-452.
4. Kushner JP, Barbuto AJ & Lee GR (1976). An inherited enzymatic defect in porphy-ria cutanea tarda: Decreased uroporphy-rinogen decarboxylase activity. Journal of Clinical Investigation,58: 1089-1097. 5. De Verneuil H, Aitken G & Nordmann Y
cutanea: two different diseases. Human Genetics, 44: 145-151.
6. Ríos de Molina MC, Saraceno EF, Aldonatti C & San Martín de Viale LC (1987). Uroporfirinógeno decarboxilasa eritrocitaria: un método de detección de la porfiria cutánea tarda familiar latente. Archivos Argentinos de Dermatología, XXXVII: 1-11.
7. Doss MO (1985). Alcohol and porphyrin metabolism. In: Seitz HK & Kommerell C (Editors), Alcohol Related Diseases in Gas-troenterology. Springer Verlag, Berlin, Germany, 231-252.
8. San Martín de Viale LC, Viale AA, Nacht S & Grinstein M (1970). Experimental por-phyria induced in rats by hexachloroben-zene. A study of the porphyrins excreted by urine. Clinica Chimica Acta, 28: 13-23. 9. Smith AG & Francis JE (1993). Genetic variation of iron-induced uroporphyria in mice. Biochemical Journal, 291: 29-35. 10. Mauzerall D & Granick S (1958). Porphyrin
biosynthesis in erythrocytes. II. Uropor-phyrinogen and its decarboxylase. Jour-nal of Biological Chemistry, 232: 1141-1162.
11. Courtney KD (1979). Hexachlorobenzene (HCB): A review. Environmental Research, 20: 225-266.
12. Wainstok de Calmanovici R, Ríos de Molina MC, Taira de Yamamoto MC, Tomio JM & San Martín de Viale LC (1984). Mechanism of hexachlorobenzene induced porphyria in rat. Effect of phe-nobarbitone pretreatment. Biochemical Journal, 218: 753-763.
13. San Martín de Viale LC, Ríos de Molina MC, Wainstok de Calmanovici R & Tomio JM (1977). Porphyrins and porphyrinogen carboxylyase in hexachlorobenzene
in-duced porphyria. Biochemical Journal, 168: 393-400.
14. Omura T & Sato R (1964). The carbon monoxide-binding pigment of liver micro-somes. I. Evidence for its hemoprotein nature. Journal of Biological Chemistry, 239: 2370-2378.
15. Maines MD, Janousek V, Tomio JM & Kappas SA (1976). Cobalt inhibition of syn-thesis and induction of d aminolevulinate synthase in liver. Proceedings of the Na-tional Academy of Sciences, USA, 73: 1499-1515.
16. Ríos de Molina MC, Taira MC & San Martín de Viale MC (1989). Liver ferroche-latase from normal and hexachloroben-zene porphyric rats. Studies on their prop-erties. International Journal of Biochemis-try, 21: 219-225.
17. Lowry OH, Rosebrough NH, Farr AL & Randall RJ (1951). Protein measurement with the Folin phenol reagent. Journal of Biological Chemistry, 193: 265-271. 18. Vilas GL, Aldonatti C, San Martín de Viale
LC & Ríos de Molina MC (1999). Effect of alpha lipoic acid amide on hexachloroben-zene porphyria. Biochemistry and Molec-ular Biology International, 47: 815-823. 19. Ibrahim NG, Spieler PJ & Freedman ML
(1979). Ethanol inhibition of rabbit reticu-locyte heme synthesis at the level of d -aminolaevulinic acid synthetase. British Journal of Haematology,41: 235-243. 20. Kondo M & Shimizu Y (1986). The effects
of ethanol, estrogen, and hexachloroben-zene on the activities of hepatic delta-aminolevulinate synthetase, delta-amino-levulinate hydratase, and uroporphyrino-gen decarboxylase in male rats. Archives of Toxicology, 59: 141-145.
21. Doss MO, von Tiepermann R, Stutz G &
Teschke R (1981). Alcohol-induced de-crease in uroporphyrinogen decarboxyl-ase activity in rat liver and spleen. En-zyme, 26: 24-31.
22. Doss MO, Fühnel A & Gross U (2000). Alcohol and porphyrin metabolism. Alco-hol and AlcoAlco-holism, 35: 109-125. 23. Knecht KT, Bradford BU, Mason RP &
Thurman RG (1990). In vivo formation of a free radical metabolite of ethanol. Molec-ular Pharmacology, 38: 26-30.
24. Billi de Catabbi S, Wainstok de Calmanovici R, Minutolo C, Aldonatti C & San Martín de Viale LC (1999). Porphyria hepatic porphyrinogen carboxylase inhibi-tor and its interaction with the active site(s) of the enzyme. Biochemistry and Molecular Biology International, 47: 945-956.
25. Ríos de Molina MC, Suárez Lissi MA, Armesto A, Lafourcade C & Lissi E (1998). Rat urinary chemiluminescence. Effect of ethanol and/or hexachlorobenzene up-take. Journal of Bioluminescence and Chemiluminescence, 13: 63-68. 26. Ferioli A, Harvey C & De Matteis F (1984).
One possible mechanism involves the CYP1A-dependent oxidation of uropor-phyrinogen to uroporphyrin. Biochemical Journal, 224: 769-777.
27. Raucy JL, Kraner JC & Lasker JM (1993). Bioactivation of halogenated hydrocar-bons by cytochrome P-450 2E1. Critical Reviews of Toxicology, 23: 1-20. 28. Ríos de Molina MC, Iglesias S, Lauría L &