and structure of alluvial forest fragments in Southeast Brazil
Silva, AC.
a*, Higuchi, P.
aand van den Berg, E.
baDepartamento de Engenharia Florestal, Universidade do Estado de Santa Catarina – UDESC,
Av. Luiz de Camões, 2090, Bairro Conta Dinheiro, CEP 88520-000, Lages, SC, Brazil
bDepartamento de Biologia, Universidade Federal de Lavras – UFLA,
CEP 37200-000, Lavras, MG, Brazil *e-mail: [email protected]
Received January 12, 2009 – Accepted May 18, 2010 – Distributed August 31, 2010 (With 2 figures)
Abstract
In order to determine the influence of soil water table fluctuation on tree species richness and structure of alluvial forest fragments, 24 plots were allocated in a point bar forest and 30 plots in five forest fragments located in a floodplain, in the municipality of São Sebastião da Bela Vista, Southeast Brazil, totalizing 54, 10 × 20 m, plots. The information recorded in each plot were the soil water table level, diameter at breast height (dbh), total height and botanical identity off all trees with dbh ≥ 5 cm. The water table fluctuation was assessed through 1 m deep observation wells in each plot. Correlations analysis indicated that sites with shallower water table in the flooding plains had a low number of tree species and high tree density. Although the water table in the point bar remained below the wells during the study period, low tree species richness was observed. There are other events taking place within the point bar forest that assume a high ecological importance, such as the intensive water velocity during flooding and sedimentation processes.
Keywords: Atlantic Forest, tree species, water saturation, wetlands.
Efeitos da flutuação do nível freático sobre a riqueza e estrutura de comunidades
arbóreas de fragmentos de floresta aluvial na região sudeste do Brasil
Resumo
Com o propósito de avaliar a influência da flutuação do nível freático do solo sobre a riqueza de espécies arbóreas e a estrutura de fragmentos florestais aluviais, foram alocadas 24 parcelas em um dique marginal de floresta ciliar e 30 parcelas em cinco fragmentos localizados na planície de inundação no Município de São Sebastião da Bela Vista, na região sudeste do Brasil, totalizando 54 parcelas de 10 × 20 m. As informações coletadas em cada parcela foram: altura do nível freático do solo, diâmetro à altura do peito (DAP), altura total e identificação botânica de todas as árvores com DAP ≥ 5 cm. A flutuação do nível freático foi avaliada por meio de um poço de observação enterrado a uma profundidade de 1 m em cada parcela. Análises de correlação indicaram que, na planície de inundação, os locais com o nível freático do solo mais superficial possuíram menor número de espécies arbóreas e maior densidade de árvores. Apesar do dique marginal da floresta ciliar apresentar o nível freático no solo abaixo de 1 m de profundidade durante o período de estudo, nesse local foi observada baixa diversidade de espécies arbóreas. No dique marginal existem outros eventos com maior importância ecológica que podem explicar a baixa diversidade, tais como a velocidade do rio mais intensa durante enchentes e o processo de sedimentação.
Palavras-chave: Floresta Atlântica, espécies arbóreas, saturação hídrica, áreas inundáveis.
1. Introduction
Despite their ecological importance, Brazilian Atlantic Forests under alluvial influence have been rapidly decreasing in area since the second half of the 19th century because of the high demand for timber species and land conversion to urban areas, agriculture and pasture. Due to the high level of plant and animal endemism and biodiversity conservation threats, this region has been considered as
a global hotspot (Myers et al., 2000). Considering this scenario, information on how environmental heterogeneity influences the diversity and structure of tree community has become necessary for both restoration and conservation of these areas.
swamp forest (Silva et al., 2007). While the environment of alluvial forests are characterised by the occurrence of temporary floods lasting for a few hours or days, swamp forest soil remains waterlogged most of the year. Thus, physiognomic, floristic, structural, diversity and spatial patterns of trees varies between the two types of forest (Brinson, 1990; Schiavini, 1992; Lytle, 2001; Lytle and Poff, 2004; Vervuren et al., 2003; Silva et al., 2007).
Water saturation may lead to a decrease in soil air space and, subsequently, affect physico-chemical soil traits and gaseous exchanges of microorganisms and roots (Lobo and Joly, 2000). In these sites, only specialised species with physiological, morphological and/or ethological adaptations can maintain a viable population leading thus to the low plant diversity, when compared with non-flooded areas occurring in the same region (Armstrong et al., 1994; Blom and Voesenek, 1996; Naiman and Décamps, 1997; Lobo and Joly, 2000). This pattern is common in neotropical forests (e.g. Prance et al., 1976, for Brazilian Amazon; Metzger et al., 1998, Vilela et al., 2000, for Southeast Brazil; Bianchini et al., 2003, for Southern Brazil).
The intensity, frequency and duration of inundation are known important ecological factors affecting tree species richness and structure (Hosner, 1960; Gill, 1970; Junk, 1993; Klimesova, 1994; Lobo and Joly, 2000; Bianchini et al., 2003). Considering the importance of the inundation regime on tree community of tropical forests and that most studies demonstrate this influence using only indirect methods, with no quantification, in the present study we measured the influence of soil water table regime on tree richness and structure in Atlantic alluvial forests fragments in Southeast Brazil. The hypotheses were that: i) sites with a more superficial water table during a longer period of time show a lower tree richness; and ii) there are spatial variation in tree community structure reflecting the spatial and temporal heterogeneity in soil water table fluctuation.
2. Material and Methods
Alluvial forest fragments located in a point bar forest and in a floodplain (Figure 1) were studied within the Rio Sapucaí watershed in the municipality of São Sebastião da Bela Vista, Minas Gerais State, Southeastern Brazil (22° 06’ 16,7” S and 45° 48’ 26,4” W; 809 m above sea level). The area of each fragment were 8.15 ha (point bar); 7.47 ha (Frag. 1); 21.69 ha (Frag.2); 1.62 ha (Frag.3); 2.00 ha (Frag. 4) and 0.90 ha (Frag. 5). The point bar has a sloping surface of sand and coarse sediments deposited along a meandering stream with rapid water drainage after flooding. In contrast, the clays are deposited farther in to the floodplain, leading to a condition prone to soil water saturation (Ab’Sáber, 2000).
According to field observations and the knowledge of locals, the study area has suffered disturbance by human activities, such as cattle ranching and selective wood logging, reflecting the historical land use of the whole Brazilian Atlantic Forest, listed as one of the World
Hotspots by Myers et al. (2000). The climate is classified as Cwb (Köppen classification) with mild summer and a dry winter. The total annual rainfall varies from 1,300 to 1,700 mm, with a rainy season from December to February and a dry season from June to August (Brasil, 1992). The local topography is dominated by a flood prone area with flat to gently sloping area topography. The regional vegetation is classified according to IBGE (1992) as an alluvial semi-deciduous forest.
The data were collected within 54, 10 × 20 m, permanent plots covering an area of 1.08ha, allocated in the point bar forest (24 plots) and in five forest fragments in the floodplain area (six plots for each fragment). The plots were distributed in the area according to environmental condition (point bar and fragments in the floodplain), the form of the fragments and considering the potential edge effects. Apart from the smallest fragment in the area, all fragments have three plots allocated near the edge (within the first 15 m) and three plots within the fragment interior. The plots allocated in these two sectors were separated by a distance of 20 m. In the point bar forest, there were nine plots in the river-edge contact zone, nine plots in the pasture-edge contact zone, and six plots within the core area.
Water table fluctuation in each plot was measured by a ruler, every two months from 04/2005 to 03/2006, in an observation well, buried 1 metre vertically in the ground (Ivanauskas, 2002; Barddal et al., 2004). The wells were made of 50 mm diameter PVC pipes perforated with 5 mm holes spread along the entire length to allow flow
into the well from the sides in addition to the bottom. The pipes were topped by a metallic protection cap to prevent soil particles and litter from getting into the well. Soil physical properties were determined by composite soil samples, made up from three individual samples in each plot, collected from 0-20 cm depth and analysed at the UFLA (Federal University of Lavras) Soil Laboratory. The soil in the point bar was classified as fluvic neosol, and in the floodplain forest fragments as gleysol and cambisol (EMBRAPA, 1999).
All living trees within each permanent plot with a diameter at breast height (1.30 m) (dbh) ≥ 5 cm were measured (dbh and height), identified, and tagged. Specimen identification was done by consulting herbaria collections, specialised bibliographies and specialists. The botanical material was deposited in the UFLA herbarium (ESAL) and the species were classified according to the APG II (APG 2003).
Tree community structure was described in each plot by the quantitative parameters of absolute and relative density, and absolute and relative dominance. Tree richness was described by the number of species.
Spearman correlation was calculated to determine whether there was any association between the height of the soil water table in each plot, represented by the mean annual value and the annual highest value (January) (Nfrea), and each of the following variables: number of species (Ns), number of individuals (Ni), basal area (BA), and mean canopy height (H).
3. Results
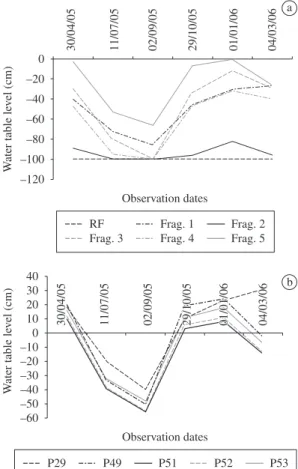
In the study area, there was a high heterogeneity in both space and time in the height level of soil water table (Figure 2a). While in some plots, mostly in fragments 1, 3, 4 and 5, it remained near the soil surface during the rainy season, in the point bar forest, the water table lay below the 1 metre wells during all the observation period. During several months, the soil water table remained above the soil surface in one plot (29) in fragment 1 and in four plots (49, 51, 52 and 53) in fragment 5, characterising a more selective environment (Figure 2b). The lowest level of soil water table was observed in September (Figure 2a and 2b).
The influence of water table level on the tree community richness and structure patterns varied according to the spatial scale analysed. For example, when the total study area (point bar plus floodplain forest fragments) was considered, in opposition to what was expected, there was a significant and positive correlation between the number of species and the level of soil water table (Table 1 and 2). This is the same to say that shallower levels of soil water table were followed by a higher number of species. When a smaller spatial scale is considered, within fragments with no spatial variation in soil water table (2, 3 and 4) no significant correlation with tree richness was detected. In contrast, within fragments with high spatial variation in soil moisture (5 and 1), ranging from plots with water table above the soil surface to well drained sites, there was
observed that the shallower the level of soil water table, the lower is the number of species, indicating a negative correlation (p < 0.05). Within plot 29 (Fragment 1), one of those with the water table above the soil surface, there was an elevated tree density (105) and low richness (four species) (Table 1) with a monodominance of Sebastiania commersoniana (Baill.) L.B. Sm. & Downs.
The correlation between the annual highest value of the soil water table level and the mean tree canopy height was negative (p < 0.10) just for the fragments 5 (–0.77). In this fragment, tree canopy height in well drained sites was higher than in poorly drained sites. The correlation between the number of individuals and the height level of soil water table was positive (p < 0.01) for the total area and floodplain forest fragments (Table 2), indicating that the shallower the water table, the higher was the tree density. There was no significant correlation between the basal area and the height level of soil water table level (Table 2).
Figure 2. Mean depth of water table level in six localities
of alluvial forest studied – point bar forest (PBF) and flood-plain forest fragments (Frag. 1, Frag. 2, Frag. 3, Frag. 4 and Frag. 5) – during one year; a) and depth of water table level on five plots of floodplain forest fragments with water table level above soil surface; b) in São Sebastião da Bela Vista, Minas Gerais, Brazil.
a
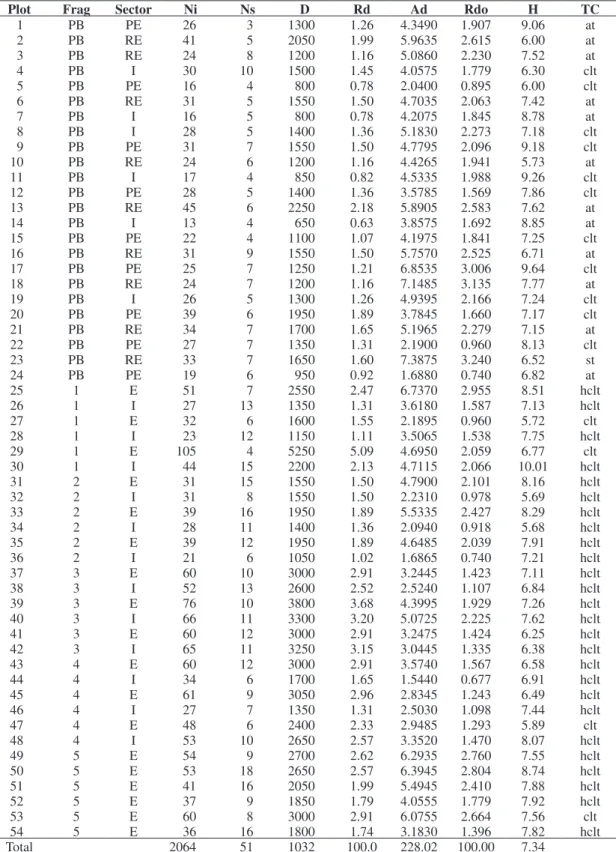
Table 1. Tree community structure of alluvial forest fragments in São Sebastião da Bela Vista, Minas Gerais, Brazil.
Plot Frag Sector Ni Ns D Rd Ad Rdo H TC
1 PB PE 26 3 1300 1.26 4.3490 1.907 9.06 at
2 PB RE 41 5 2050 1.99 5.9635 2.615 6.00 at
3 PB RE 24 8 1200 1.16 5.0860 2.230 7.52 at
4 PB I 30 10 1500 1.45 4.0575 1.779 6.30 clt
5 PB PE 16 4 800 0.78 2.0400 0.895 6.00 clt
6 PB RE 31 5 1550 1.50 4.7035 2.063 7.42 at
7 PB I 16 5 800 0.78 4.2075 1.845 8.78 at
8 PB I 28 5 1400 1.36 5.1830 2.273 7.18 clt
9 PB PE 31 7 1550 1.50 4.7795 2.096 9.18 clt
10 PB RE 24 6 1200 1.16 4.4265 1.941 5.73 at
11 PB I 17 4 850 0.82 4.5335 1.988 9.26 clt
12 PB PE 28 5 1400 1.36 3.5785 1.569 7.86 clt
13 PB RE 45 6 2250 2.18 5.8905 2.583 7.62 at
14 PB I 13 4 650 0.63 3.8575 1.692 8.85 at
15 PB PE 22 4 1100 1.07 4.1975 1.841 7.25 clt
16 PB RE 31 9 1550 1.50 5.7570 2.525 6.71 at
17 PB PE 25 7 1250 1.21 6.8535 3.006 9.64 clt
18 PB RE 24 7 1200 1.16 7.1485 3.135 7.77 at
19 PB I 26 5 1300 1.26 4.9395 2.166 7.24 clt
20 PB PE 39 6 1950 1.89 3.7845 1.660 7.17 clt
21 PB RE 34 7 1700 1.65 5.1965 2.279 7.15 at
22 PB PE 27 7 1350 1.31 2.1900 0.960 8.13 clt
23 PB RE 33 7 1650 1.60 7.3875 3.240 6.52 st
24 PB PE 19 6 950 0.92 1.6880 0.740 6.82 at
25 1 E 51 7 2550 2.47 6.7370 2.955 8.51 hclt
26 1 I 27 13 1350 1.31 3.6180 1.587 7.13 hclt
27 1 E 32 6 1600 1.55 2.1895 0.960 5.72 clt
28 1 I 23 12 1150 1.11 3.5065 1.538 7.75 hclt
29 1 E 105 4 5250 5.09 4.6950 2.059 6.77 clt
30 1 I 44 15 2200 2.13 4.7115 2.066 10.01 hclt
31 2 E 31 15 1550 1.50 4.7900 2.101 8.16 hclt
32 2 I 31 8 1550 1.50 2.2310 0.978 5.69 hclt
33 2 E 39 16 1950 1.89 5.5335 2.427 8.29 hclt
34 2 I 28 11 1400 1.36 2.0940 0.918 5.68 hclt
35 2 E 39 12 1950 1.89 4.6485 2.039 7.91 hclt
36 2 I 21 6 1050 1.02 1.6865 0.740 7.21 hclt
37 3 E 60 10 3000 2.91 3.2445 1.423 7.11 hclt
38 3 I 52 13 2600 2.52 2.5240 1.107 6.84 hclt
39 3 E 76 10 3800 3.68 4.3995 1.929 7.26 hclt
40 3 I 66 11 3300 3.20 5.0725 2.225 7.62 hclt
41 3 E 60 12 3000 2.91 3.2475 1.424 6.25 hclt
42 3 I 65 11 3250 3.15 3.0445 1.335 6.38 hclt
43 4 E 60 12 3000 2.91 3.5740 1.567 6.58 hclt
44 4 I 34 6 1700 1.65 1.5440 0.677 6.91 hclt
45 4 E 61 9 3050 2.96 2.8345 1.243 6.49 hclt
46 4 I 27 7 1350 1.31 2.5030 1.098 7.44 hclt
47 4 E 48 6 2400 2.33 2.9485 1.293 5.89 clt
48 4 I 53 10 2650 2.57 3.3520 1.470 8.07 hclt
49 5 E 54 9 2700 2.62 6.2935 2.760 7.55 hclt
50 5 E 53 18 2650 2.57 6.3945 2.804 8.74 hclt
51 5 E 41 16 2050 1.99 5.4945 2.410 7.88 hclt
52 5 E 37 9 1850 1.79 4.0555 1.779 7.92 hclt
53 5 E 60 8 3000 2.91 6.0755 2.664 7.56 clt
54 5 E 36 16 1800 1.74 3.1830 1.396 7.82 hclt
Total 2064 51 1032 100.0 228.02 100.00 7.34
Frag: forests fragments (point bar forest, PB, and floodplain forest fragments, 1, 2, 3, 4, 5). Sector: edge (E), pasture-edge contact zone (PE), river-edge contact zone (RE) and interior (I). Ni: number of tree individuals. Ns: number of species. D: absolute density (ind./ha). Rd: relative density (%). Ad: absolute dominance (m2.ha–1). Rdo: relative dominance (%). H: canopy mean
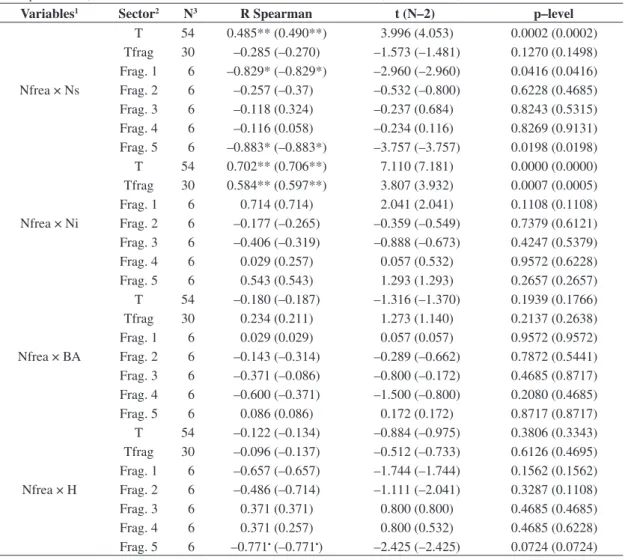
Table 2. Spearman correlation between the annual mean level and the annual highest value of soil water table (values be-tween parentheses), and the studied variables in São Sebastião da Bela Vista, Minas Gerais, Brazil.
Variables1 Sector2 N3 R Spearman t (N–2) p–level
Nfrea × Ns
T 54 0.485** (0.490**) 3.996 (4.053) 0.0002 (0.0002) Tfrag 30 –0.285 (–0.270) –1.573 (–1.481) 0.1270 (0.1498) Frag. 1 6 –0.829* (–0.829*) –2.960 (–2.960) 0.0416 (0.0416) Frag. 2 6 –0.257 (–0.37) –0.532 (–0.800) 0.6228 (0.4685) Frag. 3 6 –0.118 (0.324) –0.237 (0.684) 0.8243 (0.5315) Frag. 4 6 –0.116 (0.058) –0.234 (0.116) 0.8269 (0.9131) Frag. 5 6 –0.883* (–0.883*) –3.757 (–3.757) 0.0198 (0.0198)
Nfrea × Ni
T 54 0.702** (0.706**) 7.110 (7.181) 0.0000 (0.0000) Tfrag 30 0.584** (0.597**) 3.807 (3.932) 0.0007 (0.0005) Frag. 1 6 0.714 (0.714) 2.041 (2.041) 0.1108 (0.1108) Frag. 2 6 –0.177 (–0.265) –0.359 (–0.549) 0.7379 (0.6121) Frag. 3 6 –0.406 (–0.319) –0.888 (–0.673) 0.4247 (0.5379) Frag. 4 6 0.029 (0.257) 0.057 (0.532) 0.9572 (0.6228) Frag. 5 6 0.543 (0.543) 1.293 (1.293) 0.2657 (0.2657)
Nfrea × BA
T 54 –0.180 (–0.187) –1.316 (–1.370) 0.1939 (0.1766) Tfrag 30 0.234 (0.211) 1.273 (1.140) 0.2137 (0.2638) Frag. 1 6 0.029 (0.029) 0.057 (0.057) 0.9572 (0.9572) Frag. 2 6 –0.143 (–0.314) –0.289 (–0.662) 0.7872 (0.5441) Frag. 3 6 –0.371 (–0.086) –0.800 (–0.172) 0.4685 (0.8717) Frag. 4 6 –0.600 (–0.371) –1.500 (–0.800) 0.2080 (0.4685) Frag. 5 6 0.086 (0.086) 0.172 (0.172) 0.8717 (0.8717)
Nfrea × H
T 54 –0.122 (–0.134) –0.884 (–0.975) 0.3806 (0.3343) Tfrag 30 –0.096 (–0.137) –0.512 (–0.733) 0.6126 (0.4695) Frag. 1 6 –0.657 (–0.657) –1.744 (–1.744) 0.1562 (0.1562) Frag. 2 6 –0.486 (–0.714) –1.111 (–2.041) 0.3287 (0.1108) Frag. 3 6 0.371 (0.371) 0.800 (0.800) 0.4685 (0.4685) Frag. 4 6 0.371 (0.257) 0.800 (0.532) 0.4685 (0.6228) Frag. 5 6 –0.771• (–0.771•) –2.425 (–2.425) 0.0724 (0.0724)
1Variables: soil water table represented (Nfrea), number of species (Ns), number of tree individuals (Ni), tree basal area
(BA) and mean canopy height (H). 2Forests sectors: plots of total area (T), plots of all floodplain forest fragments (1, 2, 3,
4 and 5) (Tfrag), plots of the fragment 1 (Frag. 1), plots of the fragment 2 (Frag. 2), plots of the fragment 3 (Frag. 3), plots of the fragment 4 (Frag. 4) and plots of the fragment 5 (Frag. 5). 3N = number of plots within each sector. •significance at
10% of probability; *significance at 5% of probability; **significance at 1% of probability.
4. Discussion
While the temporal variation in the water table level occurred due to seasonal distribution of the rainfall, the spatial heterogeneity occurred as a function of the local microtopography and soil texture. As explained before, the point bar is formed by a zone characterised by a sloping surface of sand and coarse sediments deposited along a meandering and the floodplain is characterised by clay deposition (Ab’Sáber, 2000).
Considering that almost half of the plots were allocated within the point bar forest (24), the statistical analyses were strongly biased by this sector. In the point bar forest low species richness was observed (Table 1), ranging from three (plot 1) up to 10 species (plot 4). This fact could explain the pattern of positive correlation between the number of species and the level of soil water table, for the total
area. However, the low species richness in this sector is not related to the level of the water table, since no water was detected in the observation wells during the study period. Actually, the low richness of species in riparian forests is widely reported and is frequently associated to the disturbances caused by periodical flooding. According to field observations made by local inhabitants (e.g. the presence of soil substrate on seedling leave) in the study area, such disturbance has been very intensive. The burying of seedling and seeds and the removing of litter and soil seed bank would lead to a species selection and consequently reduce the plant diversity (Rodrigues and Shepherd, 2000).
water table just specialised species with physiological, morphological and/or ethological adaptations would maintain a viable population leading to low plant diversity. The present study strengthened these results, demonstrating the low tree species richness in areas with superficial water table in those fragments high spatial variation in the level of soil water table (Fragments 1 and 5). Additionally, in plot 29, where the water table remained above the soil surface, the species S. commersoniana was very abundant. This species shows flooding tolerance (Kolb et al., 1998; Lobo and Joly, 2000; Kolb et al., 2002) and its over abundance in areas with periodic flooding has been frequently reported in other studies (e.g. Gibbs and Leitão-Filho, 1978; Barddal et al., 2004). S. commersoniana has morphoanatomic and metabolic adaptations allowing its survival during waterlogged periods and growth after floodwaters recede.
The tree community structure was summarised by the tree canopy height, number of individuals and basal area. Considering the influence of water table level on mean tree canopy height, many authors (Soares-Silva et al., 1998; Araujo et al., 2004; Barddal et al., 2004) have found larger tree individuals present in well drained areas on riparian forests than in floodplains with a more waterlogged soil. The shallower root system of trees in such places leads to a higher incidence of large trees falling, due to poor root fixation in the soil, as well as a limitation in tree growth (Martinez-Ramos, 1985; Sampaio et al., 2000; Bianchini et al., 2003; Araujo et al., 2004; Barddal et al., 2004). Another feasible explanation could be the ecological dominance of species with small individuals, such as S. commersoniana which are very common in water saturated areas. The outcome is a high density of small trees due to an elevated recruitment rate of smaller tree individuals and sprouting of tree stems. However, this pattern can not be generalised, once in Amazonian Region there are many large commercial trees occurring in the floodplain forest known as “ varzea”. Factors such as frequency and intensity of floods, period of soil water saturation and past disturbance history play an important role on tree community structure.
While in well drained plots, the basal area was represented mainly by the sum of stems sectional area of few large trees, in plots with shallow water table the basal was represented by the sum of stems sectional area of many small trees. Several studies have reported elevated tree density in swamp (e.g. Toniato et al., 1998; Rocha et al., 2005) and alluvial forests (e.g. Barddal et al., 2004). The influence of soil water table on number of tree individuals depends on the spatial scale considered in the analyses, as demonstrated by the positive correlation between the number of individuals and the height level of soil water table for the total area and floodplain forest fragments (Table 2), and the lack of significance within isolated fragments.
The results of the present study demonstrated that the strategies for conservation and restoration of the Brazilian Atlantic alluvial fragments must consider that the tree community shows a high spatial heterogeneity in richness
and structure related to the height of the soil water table. Factors such as spatial and temporal variation of soil water table as well as flooding regimes lead to different environmental conditions in the point bar and floodplain forest fragments affecting the local tree community.
References
AB’SÁBER, NA., 2000. O suporte geoecológico das florestas beiradeiras (ciliares). In RODRIGUES, RR. and LEITÃO-FILHO, HF. (Eds.). Matasciliares: conservação e recuperação. São Paulo:
Universidade de São Paulo. p. 15-25.
ANGIOSPERM PHYLOGENY GROUP - APG II, 2003. An update of the Angiosperm Phylogeny Group classification for the orders and families of flowering plants. BotanicalJournalof theLinneanSociety, vol. 141, no. 4, p. 399-436.
ARAUJO, MM., LONGHI, SJ., BRENA, DA., BARROS, PLC. and FRANCO, S., 2004. Análise de agrupamento da vegetação de um fragmento de floresta estacional decidual aluvial, Cachoeira do Sul, RS, Brasil. CiênciaFlorestal, vol. 14, no. 1, p. 133-147.
ARMSTRONG, W., BRAENDLE, R. and JACKSON, MB., 1994. Mechanisms of flooding resistance in plants. Actabotanica Neerlandica, vol. 43, no. 4, p. 307-358.
BARDDAL, ML., RODERJAN, CV., GALVÃO, F. and CURCIO, GR., 2004. Caracterização florística e fitossociológica de um trecho sazonalmente inundável de floresta aluvial, em Araucária, PR. CiênciaFlorestal, vol. 14, no. 2, p. 37-50.
BIANCHINI, E., POPOLO, RS., DIAS, MC. and PIMENTA, JA., 2003. Diversidade e estrutura de espécies arbóreas em área alagável do município de Londrina, Sul do Brasil. ActaBotanica Brasilica, vol. 17, no. 3, p. 405-419.
BLOM, CWPM. and VOESENEK, LACJ., 1996. Flooding: the survival strategies of plants. TrendsinEcology&Evolution,
vol. 11, no. 7, p. 290-295.
BRASIL, 1992. Normaisclimatológicas: 1961-1990. Brasília:
Ministério da Agricultura e Reforma Agrária.
BRINSON, MM., 1990. Riverine forest. In LUGO, AE., BRINSON, MM. and BROWN, S. (Eds). Ecosystemsoftheworld15: forested
wetlands. Amsterdam: Elsevier. p. 128-145.
EMBRAPA, 1999. Sistemabrasileirodeclassificaçãodesolos.
Rio de Janeiro: Empresa Brasileira de Pesquisa Agropecuária. GIBBS, PE. and LEITÃO-FILHO, HF., 1978. Floristic composition of an area of gallery forest near Moji-Guaçu, State of São Paulo, SP, Brazil. RevistaBrasileiradeBotânica, vol. 1, no. 2, p. 151-156.
GILL, CJ., 1970. The flooding tolerance of woody species: a review. ForestryAbstracts, vol. 31, no. 4, p. 671-688.
HOSNER, JF., 1960. Relative tolerance to complete inundation of fourteen bottomland tree species. ForestScience, vol. 6, no. 3, p. 246-251.
INSTITUTO BRASILEIRO DE GEOGRAFIA E ESTATÍSTICA - IBGE, 1992. Manualtécnicodavegetaçãobrasileira. Rio de
Janeiro. (Manuais técnicos em geociências, 1)
IVANAUSKAS, NM., 2002. Estudodavegetaçãopresentenaárea decontatoentreformaçõesflorestaisemGaúchadoNorte-MT.
JUNK, WJ., 1993. Wetlands of tropical South America. In WHIGHAM, D., HEJNÝ, S. and DYKYJOVÁ, D. (Eds). Wetlands oftheworldI: inventory, ecology and management. Boston: Dr. W. Junk Publishing. p. 679-739.
KLIMESOVA, J., 1994. The effects of timing and duration of floods on growth of young plants of Phalarisarundinacea L.
and Urticadioica L.: an experimental study. AquaticBotany, vol. 48, no. 1, p. 21-29.
KOLB, RM., MEDRI, ME., BIANCHINI, E., PIMENTA, JA., GILONI, PC. and CORREA, GT., 1998. Anatomia ecológica de Sebastianiacommersoniana (Baillon) Smith & Downs
(Euphorbiaceae) submetida ao alagamento. RevistaBrasileira deBotânica, vol. 21, no. 3, p. 305-312.
KOLB, RM., RAWYLER, A. and BRAENDLE, R., 2002. Parameters affecting the early seedling development of four neotropical trees under oxygen deprivation stress. Annalsof Botany, vol. 89, no. 5, p. 551-558
LOBO, PC. and JOLY, CA., 2000. Aspectos ecofisiológicos da vegetação de mata ciliar do Sudeste do Brasil. In RODRIGUES, RR. and LEITÃO FILHO, HF. (Eds). Matasciliares: conservação
e recuperação. São Paulo: Universidade de São Paulo. p. 143-157.
LYTLE, DA., 2001. Disturbance regimes and life-history evolution.
AmericanNaturalist, vol. 157, no. 5, p. 525-536.
LYTLE, DA. and POFF, NL., 2004. Adaptation to natural flow regimes. TrendsinEcology&Evolution, vol. 19, no. 2, p. 94-100.
MARTÍNEZ-RAMOS, M., 1985. Claros, ciclos vitales de los árboles tropicales y regeneración natural de las selvas altas perenifolias. In GOMEZ-PÓMPA, A. and AMO, SR. (Eds). Investigaciones sobrelaregeneracióndeselvasaltasenVeracruz, Mexico. México:
Editorial Alhambra Mexicana. p. 191-239.
METZGER, JP., GOLDENBERG, RC. and BERNACCI, LC., 1998. Diversidade e estrutura de fragmentos de mata de várzea e de mata mesófila semidecídua submontana do rio Jacaré-Pepira (SP).
RevistaBrasileiradeBotânica, vol. 21, no. 3, p. 321-330. MYERS, N., MITTERMEIER, RA., MITTERMEIER, CG., FONSECA, GAB. and KENT, J., 2000. Biodiversity hotspots for conservation priorities. Nature, vol. 403, no. 6772, p. 853-858. NAIMAN, RJ. and DÉCAMPS, H., 1997. The ecology of interfaces: riparian zones. AnnualReviewofEcologyandSystematics, vol. 28,
no. 1, p. 621-658.
PRANCE, GT., RODRIGUES, WA. and SILVA, MF., 1976. Inventário florestal de um hectare de mata de terra firme, km 30 da estrada Manaus-Itacoatiara. ActaAmazonica, vol. 6, no. 1, p. 9-35.
ROCHA, CTV., CARVALHO, DA., FONTES, MAL., OLIVEIRA FILHO, AT., VAN DEN BERG, E., MARQUES, JJGSM., 2005. Comunidade arbórea de um continuum entre floresta paludosa e de encosta em Coqueiral, Minas Gerais, Brasil. RevistaBrasileira deBotânica, vol. 28, no. 2, p. 203-217.
RODRIGUES, RR. and SHEPHERD, GJ., 2000. Fatores condicionantes da vegetação ciliar. In RODRIGUES, RR. and LEITÃO FILHO, HF. (Eds). Matasciliares: conservação e recuperação.
São Paulo: Universidade de São Paulo. p. 101-107.
SAMPAIO, AB., WALTER, BMT. and FELFILI, JM., 2000. Diversidade e distribuição de espécies arbóreas em duas matas de galeria na micro-bacia do Riacho Fundo, Distrito Federal. Acta BotanicaBrasilica, vol. 14, no. 2, p. 197-214.
SCHIAVINI, I., 1992. Estruturadascomunidadesarbóreasde matadegaleriadaEstaçãoEcológicadoPanda(Uberlândia, MG). Campinas: Universidade Estadual de Campinas. [PhD thesis] SILVA, AC., VAN DEN BERG, E., HIGUCHI, P. and OLIVEIRA-FILHO, AT., 2007. Comparação florística de florestas inundáveis das regiões Sudeste e Sul do Brasil. RevistaBrasileiradeBotânica, vol. 30, no. 2, p. 257-269.
SOARES-SILVA, LH., KITA, KK. and SILVA, FC., 1998. Fitossociologia de um trecho de floresta de galeria no Parque Estadual Mata dos Godoy, Londrina, PR, Brasil. Boletimdo HerbárioEzechiasPauloHeringer, vol. 3, p. 46-62.
TONIATO, MTZ., LEITÃO FILHO, HF. and RODRIGUES, RR., 1998. Fitossociologia de um remanescente de floresta higrófila (Mata de Brejo) em Campinas, São Paulo. RevistaBrasileirade Botânica, vol. 21, no. 2, p. 197-210.
VERVUREN, PJA., BLOM, CWPM. and KROON, H., 2003. Extreme flooding events on the Rhine and the survival and distribution of riparian plant species. JournalofEcology, vol. 91,
no. 1, p. 135-146.