TREE COMMUNITY STRUCTURE IN A SEASONALLY DRY TROPICAL FOREST REMNANT, BRAZIL
Deborah Mattos Guimarães Apgaua1*, Polyanne Aparecida Coelho1, Rubens Manoel dos Santos1, Paola Ferreira Santos1, Ary Teixeira de Oliveira-Filho2
*Autor para correspondência: deborah_ufla@yahoo.com.br
ABSTRACT:Most studies on Seasonally Dry Tropical Forests (SDTFs) investigate phytogeographic patterns and floristic connections of this disjunct biome. However, little is known about the structural characteristics of SDTFs. We aimed to describe the structure of a SDTF in an ecotonal area between the Cerrado and Caatinga domains. In total, 79 tree species were recorded, and high values of Shannon diversity index (3.6 nats/individual) and equability (0.83) were observed. The diameter distribution for the species with higher cover values and for the entire community did not exhibit a reverse-J shaped distribution, which indicates the occurrence of different
growth strategies and ecological adaptations to water stress. The results did not indicate the formation of floristic groups, as the high
soil fertility in the study area results in a homogeneous environment. The structural characteristics of the study area associated with the soil composition highlight its importance for conservation and emphasize the need for community structure studies in SDTFs. Keywords: diameter distribution, Caatinga, phytosociology, conservation.
ESTRUTURA DA COMUNIDADE ARBÓREA DE UM FRAGMENTO DE FLORESTA TROPICAL SAZONALMENTE SECA, BRASIL
RESUMO: A maior parte dos estudos envolvendo as Florestas Tropicais Sazonalmente Secas aborda questões fitogeográficas e conexões florísticas deste bioma disjunto. Porém, pouco se conhece a respeito das características estruturais da FTSS. Devido a esta lacuna existente na literatura, buscamos descrever a estrutura de um fragmento remanescente de FTSS em uma área ecotonal entre domínio do Cerrado e da Caatinga. Ocorreram no estudo grande número de espécies arbóreas, 79, e altos valores para os índices de diversidade e equabilidade (3,6 nats/indivíduos e 0,83, respectivamente). A distribuição diamétrica para os indivíduos que apresentaram maiores valores de cobertura e para a comunidade não resultou em padrão de J-reverso, o que indica adaptações ecológicas ao stress hídrico adotadas em diferentes estratégias de crescimento. Não houve formação de grupos florísticos, já que a alta fertilidade do solo da área de estudo configura um ambiente homogêneo. A característica da área de estudo detectada através da estrutura, associada a dados edáficos, nos permitiu vislumbrar sua importância em termos de conservação e reforçar a importância de estudos com este enfoque nas FTSS.
Palavras-chave: distribuição diamétrica, Caatinga, fitossociologia, conservação.
1 Universidade Federal de Lavras - Lavras, Minas Gerais, Brazil
2 Universidade Federal de Minas Gerais - Belo Horizonte, Minas Gerais, Brazil 1 INTRODUCTION
The Seasonally Dry Tropical Forest (SDTF) biome
has physiognomic, taxonomic, and structural peculiarities due to a phytogeographical report in which provided its
disjunction along South America according to the refuge theory (PENNINGTON et al., 2000, 2006; PRADO; GIBBS, 1993).
The longest continuous extent of SDTFs occurs in the Caatinga domain as a mosaic of “ecoregions”
and “floristic units” (SANTOS et al., 2012; VELLOSO; SAMPAIO, 2002). This variability is caused mostly by
variations in climate, topography, edaphic conditions,
and human intervention among the areas (VELLOSO; SAMPAIO, 2002). Nevertheless, there are few studies
of plant communities in dry environments compared to
more humid ones in Brazil (LIMA et al., 2007; SILVA; SCARIOT, 2004). Even though several studies have focused on the phytogeography and florisitic connections of SDTFs (OLIVEIRA-FILHO et al., 2006; PENNINGTON et al., 2000; SANTOS et al., 2012), few studies aimed to examine their structural characteristics. Vegetation
structure studies are complementary to phytogeographic ones as they help understand the environmental and spatial
characteristics of SDTFs.
Vegetation structure varies greatly among SDTF
patches, mostly due to the environmental heterogeneity
along their distribution. Most vegetation structure
studies in the SDTF biome were done in the more xeric
NASCIMENTO, 2006), whereas few ones investigated the
ecotonal area between the Caatinga and Cerrado domains
(SANTOS et al., 2011, 2012). However, SDTF patches
have differences in tree species composition, abundance,
and individual size (SANTOS et al., 2007).
Because SDTFs occur in areas of high soil
fertility, they are subjected to disturbance by farming (PENNINGTON et al., 2000, 2006), and only few remnants with primary vegetation can be found in the area. The
settlement and development of the region caused the reduction and alteration of natural vegetation, and diversity studies of these communities are fundamental to design
conservation strategies for the remaining forests.
This study aimed to investigate the structure of the tree community of a Seasonally Dry Tropical Forest remnant in an ecotonal area between the Cerrado and
Caatinga domains in northern Minas Gerais, Brazil.
2 MATERIAL AND METHODS
2.1 Study area
The study was done in a SDTF remnant of
approximately 40 ha located in the municipality of Juvenília (14º26’04’’ S and 44º10’67’’ W). The area has
a gentle slope with the soil depth gradient characterized by shallower soils in its lowest part, rocky outcrops in its intermediate section, and deeper soils in its highest
part. The average annual rainfall is 1000 mm and the area experiences more rain from November to January (SANTOS et al., 2011).
2.2 Tree community survey
Sixty 20 x 20 m (400 m2) plots, totaling 2.4 ha,
were distributed along three transects 50 m apart from
each other, parallel to the largest dimension of the remnant
and following the soil depth gradient. At each point of the transect, two plots were established 10 m apart from each other, and the same procedure was repeated every 20 m. All individuals with DBH (diameter at breast height) ≥ 10 cm at 1.30 m from soil were recorded.
The botanical material was herborized and the control collection deposited in the Montes Claros
herbarium of Universidade Estadual de Montes Claros (UNIMONTES). The Angiosperm Philogeny Group II (ANGIOSPERM PHYLOGENY GROUP - APG, 2003) classification system was adopted.
2.3 Environmental variables
To determine the relationships between edaphic
variables and vegetation, three 0.5 l surface samples (0–20 cm depth) were taken per plot for analysis of particle size distribution and chemical composition of soils. The soil
samples were stored in plastic bags and taken to the Federal
University of Lavras Soil Analysis Laboratory (Laboratório de Análise de Solos da Universidade Federal de Lavras), where the following variables were measured: pH in water; levels of potassium (K), phosphorus (P), calcium (Ca), magnesium (Mg), and aluminum (Al); potential acidity (H+Al), sum of bases (Sb), effective CEC (t), CEC at pH 7.0 (T), aluminum saturation (m), base saturation (V), carbon (C), organic matter (OM), and sand, silt, and clay fractions. Laboratory procedures followed the Brazilian Agricultural Research Corporation protocols (EMPRESA BRASILEIRA DE PESQUISA AGROPECUÁRIA - EMBRAPA, 2006).
2.4 Tree community descriptive parameters
To describe tree community structure, the traditional quantitative parameters proposed by Mueller-Dombois and
Ellenberg (1974) were calculated per species: absolute density (AD, ind/ha); absolute frequency (AF, %); absolute dominance (ADo) expressed by basal area (m²/ha); and cover value (CV). The Shannon diversity index (H’) and Pielou equability (J’) measures of diversity (BROWER; ZAR, 1984) were also calculated. Tree density distributions
per diameter class were analyzed for the community and
for the 11 species of highest cover value. Class intervals
with growing ranges were used to compensate for the significant decrease in the number of individuals in larger diameter size classes, typical of a reverse-J shaped
negative exponential distribution (BOTREL et al., 2002). The Kruskal-Wallis test was used to assess if the number
of individuals in each diameter class was similar among
the three transects (ZAR, 2010).
2.5 Analysis of environmental variables
To correlate the environmental variables with vegetation variables, a Canonical correspondence
Analysis (CCA) was performed using Pc-ord-5 software (MCCUNE; MEFFORD, 2006). The abundance values
were log10 (a+1) transformed to compensate for deviations
Fifteen soil parameters [P, pH, K, Ca, Mg, H+Al, SB, (t), (T), V, OM, P-rem, sand, silt, and clay] were investigated, but after a preliminary analysis, 10 parameters
were removed as they were weakly correlated with the environmental data or redundant, which could result in high
collinearity. Thus, only the five variables [K, Ca, (T), OM, and P-rem] most strongly correlated with the ordination axes were analyzed.
3 RESULTS
3.1 Floristics, structure, and diversity
In total, 1828 individuals were sampled in the sixty plots, with a density of 761.67 ind.ha-1 and basal area of
40.657 m²ha-1. The individuals were distributed among 79
tree species belonging to 67 genera and 29 families (Table 1). The most representative families were: Fabaceae (22 species); Bignoniaceae, Euphorbiaceae, and Malvaceae
(five species each); Anacardiaceae and Rutaceae (four species each); Nyctaginaceae (three); followed by
Cordiaceae, Cactaceae, Lamiaceae, Malpighiaceae, Meliaceae, Moraceae, Myrtaceae, Polygonaceae, and
Rubiaceae (two species each), representing 55.2% of the sampled species. The other families (44.8%) were represented by a single species. The genus with the
highest species richness was Handroanthus (four species),
followed by Zanthoxylum (three species), Bauhinia,
Eugenia, Guapira, Manihot, Ptilochaeta, Senegalia, and
Senna (two species each), corresponding to 26.6% of the
sampled species. The 10 species with highest density
were Aspidosperma pyrifolium Mart., Commiphora
leptophloeus (Mart.) J.B. Gillet, Ptilochaeta glabra
Nied., Combretum duarteanum Cambess., Anadenanthera
colubrina (Vell.) Brenan, Handroanthus impetiginosus
(Mart. ex DC.) Mattos, Coccoloba schwackeana Lindau,
Coutarea hexandra (Jacq.) K.Schum., Myracrodruon
Table 1 - Species sampled in the floristic and structural surveys with their respective phytosociologic parameters in a SDTF remnant: (DA) Absolute Density; (FA) Absolute Frequency; Absolute Dominance (DoA); and cover value (VC).
Tabela 1 - Espécies amostradas nos levantamentos florístico e estrutural, com seus respectivos parâmetros fitossociológicos em um rema-nescente de FTSS. (DA) Densidade Absoluta; (FA) Frequência Absoluta; (DoA) Dominância Absoluta e (VC).
FAMILY SPECIES NI DA FA DOA VC
Anacardiaceae Cyrtocarpa caatingae Mitchell & Daly 1 0.42 1.67 0.00 0.03
Myracrodruon urundeuva Allemão 92 38.33 70.00 2.26 9.19
Schinopsis brasiliensis Engl. 6 2.50 5.00 0.02 0.23
Spondias tuberosa Arruda 7 2.92 11.67 0.24 0.90
Annonaceae Rollinia leptopetala R.E.Fr. 10 4.17 13.33 0.02 0.33
Apocynaceae Aspidosperma pyrifolium Mart. 60 25.00 40.00 0.16 2.12
Araliaceae Aralia warmingiana (Marchal) J.Wen 5 2.08 6.67 0.02 0.19
Arecaceae Syagrus oleracea (Mart.) Becc. 51 21.25 46.67 0.49 2.85
Bignoniaceae Handroanthus heptaphyllus (Martius) Mattos 1 0.42 1.67 0.00 0.04
Handroanthus impetiginosus (Mart. ex DC.) Mattos 80 33.33 40.00 0.59 3.92
Handroanthus ochraceus (Cham.) Mattos 29 12.08 15.00 0.27 1.60
Handroanthus spongiosus (Rizzini) S.O.Grose 19 7.92 15.00 0.17 1.02
Tabebuia roseoalba (Ridl.) Sandwith 45 18.75 38.33 0.10 1.52
Boraginacear Auxemma oncocalyx (Allemão) Taub. 4 1.67 5.00 0.07 0.31
Patagonula bahiensis Moric. 5 2.08 5.00 0.02 0.21
Burseraceae Commiphora leptophloeus (Mart.) J.B.Gillet 64 26.67 58.33 1.36 5.77
Cactaceae Cereus jamacaru DC. 7 2.92 11.67 0.06 0.35
Pereskia bahiensis Gürke 45 18.75 43.33 0.46 2.58
Cannabaceae Celtis brasiliensis (Gardn.) Planch. 2 0.83 3.33 0.00 0.06
Celastraceae Fraunhofera multiflora Mart. 33 13.75 35.00 0.24 1.62
Combretaceae Combretum duarteanum Cambess. 72 30.00 35.00 0.16 2.45
Erythroxylaceae Erythroxylum caatingae Plowman 15 6.25 16.67 0.02 0.47 Euphorbiaceae Cnidoscolus oligandrus (Müll.Arg.) Pax 6 2.50 10.00 0.02 0.24
Jatropha mollissima (Pohl) Baill. 3 1.25 3.33 0.01 0.10
Manihot anomala Pohl 3 1.25 3.33 0.00 0.09
Manihot dichotoma Ule 2 0.83 3.33 0.00 0.06
FAMILY SPECIES NI DA FA DOA VC
Sapium glandulosum (L.) Morong 10 4.17 15.00 0.01 0.30
Fabaceae Anadenanthera colubrina (Vell.) Brenan 79 32.92 48.33 0.45 3.49
Bauhinia cheilantha (Bong.) Steud. 19 7.92 15.00 0.02 0.56
Bauhinia forficata Link 31 12.92 35.00 0.03 0.93
Cassia ferruginea (Schrad.) Schrad. ex DC. 1 0.42 1.67 0.01 0.05
Chloroleucon dumosum (Benth.) G.P.Lewis 2 0.83 3.33 0.01 0.07
Dalbergia cearensis Ducke 41 17.08 28.33 0.15 1.56
Erythrina velutina Willd. 1 0.42 1.67 0.00 0.03
Holocalyx balansae Micheli 2 0.83 3.33 0.03 0.14
Lonchocarpus sericeus (Poiret) DC. 1 0.42 1.67 0.00 0.03
Luetzelburgia auriculata (Allemão) Ducke 12 5.00 11.67 0.02 0.40
Machaerium acutifolium Vogel 28 11.67 33.33 0.06 0.95
Mimosa tenuiflora (Willd.) Poir. 10 4.17 11.67 0.02 0.32
Piptadenia viridiflora (Kunth) Benth. 2 0.83 3.33 0.02 0.13
Plathymenia reticulata Benth. 3 1.25 3.33 0.02 0.15
Poincianella pluviosa (DC.) L. P. Queiroz 265 110.4 90.00 1.19 10.8
Pseudopiptadenia warmingii (Benth.) G.P.Lewis &
M.P.Lima
36 15.00 16.67 0.06 1.17
Pterocarpus villosus (Mart. ex Benth.) Benth. 3 1.25 1.67 0.01 0.10
Senegalia martii (Benth.) Seigler & Ebinger 11 4.58 16.67 0.03 0.39
Senegalia polyphylla (DC.) Britton & Rose 6 2.50 8.33 0.02 0.22
Senna multijuga (L.C.Rich.) H.S.Irwin & Barneby 1 0.42 1.67 0.00 0.03
Senna spectabilis (DC.) H.S.Irwin & Barneby 1 0.42 1.67 0.00 0.03
Sweetia fruticosa Spreng. 6 2.50 10.00 0.05 0.30
Lamiaceae Aegiphila sellowiana Cham. 9 3.75 11.67 0.04 0.36
Vitex laciniosa Turcz. 26 10.83 25.00 0.14 1.13
Lythraceae Lafoensia vandelliana Cham. & Schltdl. 2 0.83 3.33 0.00 0.07
Malpighiaceae Ptilochaeta bahiensis Turcz. 29 12.08 13.33 0.07 1.01
Ptilochaeta glabra Niedz. 65 27.08 50.00 0.12 2.12
Malvaceae Cavanillesia arborea (Willd.) K.Schum. 23 9.58 35.00 5.37 16.5
Ceiba pubiflora (A.St.-Hil.) K.Schum. 5 2.08 8.33 0.17 0.62
Luehea paniculata Mart. & Zucc. 7 2.92 6.67 0.03 0.28
Pseudobombax marginatum (A.St.-Hil.) A.Robyns 12 5.00 18.33 0.35 1.37
Sterculia striata A.St.-Hill. & Naudin 29 12.08 31.67 0.54 2.38
Meliaceae Cedrela fissilis Vell. 10 4.17 13.33 0.20 0.86
Trichilia hirta L. 15 6.25 18.33 0.16 0.89
Moraceae Ficus calyptroceras (Miq.) Miq. 3 1.25 5.00 0.02 0.13
Maclura tinctoria (L.) D.Don ex Steud. 4 1.67 5.00 0.02 0.18
Myrtaceae Eugenia florida DC. 50 20.83 38.33 0.13 1.76
Eugenia uniflora L. 33 13.75 31.67 0.04 1.03
Nyctaginaceae Bougainvillea praecox Griseb. 4 1.67 6.67 0.01 0.12
Guapira hirsuta (Choisy) Lundell 1 0.42 1.67 0.00 0.04
Guapira opposita (Vell.) Reitz 10 4.17 15.00 0.04 0.40
Polygonaceae Coccoloba schwackeana Lindau 87 36.25 60.00 0.22 3.04
Ruprechtia laxiflora Meisn. 11 4.58 15.00 0.04 0.42
Rubiaceae Coutarea hexandra (Jacq.) K.Schum. 90 37.50 43.33 0.15 2.91
Randia armata (Sw.) DC. 21 8.75 25.00 0.02 0.64
Rutaceae Balfourodendron molle (Miquel) Pirani 19 7.92 11.67 0.05 0.66
Zanthoxylum petiolare A.St.-Hil. & Tul. 4 1.67 6.67 0.01 0.13
Zanthoxylum riedelianum Engl. 4 1.67 6.67 0.01 0.13
Zanthoxylum stelligerum Turcz. 2 0.83 3.33 0.00 0.06
Salicaceae Casearia selloana Eichl. 11 4.58 11.67 0.02 0.36
Sapindaceae Dilodendron bipinnatum Radlk. 2 0.83 1.67 0.00 0.07
Solanaceae Capsicum parvifolium Sendtn. 2 0.83 3.33 0.00 0.06
Total 1827 761.6 1428.3 16.94 100
urundeuva Allemão, and Poincianella pluviosa
(DC.) L.P. Queiroz. The three species with highest
basal area values were Cavanillesia arborea (Willd.)
K.Schum (31.67%), M. urundeuva (13.85%), and C.
leptophloeus (8.03%), representing 53.04% of total
basal area. The species with highest cover value were
C. arborea (16.5%), P. pluviosa (10.8%), M. urundeuva
(9.2%), C. leptophloeus (5.8%), and H. impetiginosus
Two species included in the official list of
endangered species of the Brazilian flora were sampled in
the SDTF remnant: M. urundeuva (92 individuals, basal
area: 5.43 m², AD: 21.25 ind/ha, AF: 70%, CV: 9.19)
and Schinopsis brasiliensis Engl. (six individuals, basal
area: 0.056 m², AD: 2.5 ind/ha, AF: 5%, CV: 0.233). In addition, two species listed as “insufficient information”
were sampled: one individual of Cyrtocarpa caatingae J.D.
Mitch. & Daly (basal area: 0.001 m², AD: 0.417, AF: 1.667, CV: 0.029) and Handroanthus spongiosus (19 individuals,
basal area: 0.406 m², AD: 7.917, AF: 15%, CV: 1.019).
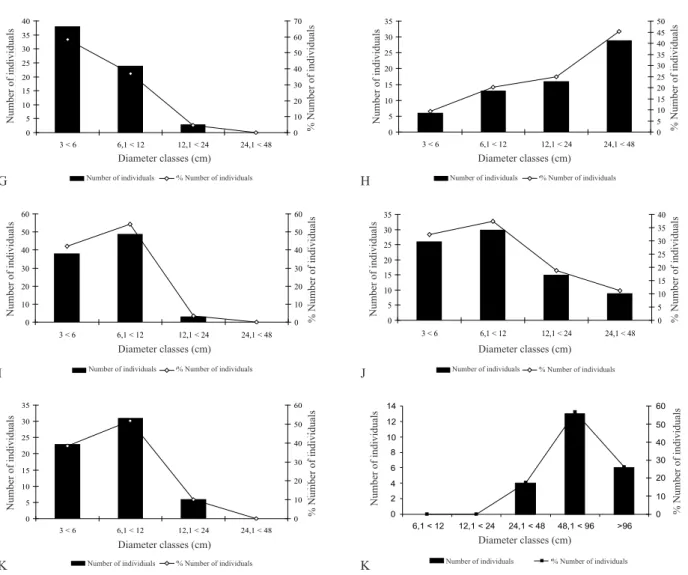
The diameter distribution of the tree community had a larger percentage of individuals in the second diameter
class (6.1–12 cm) (Fig. 1A).
The first diameter class (3–6 cm) corresponded to 33.6% of the individuals, the second class (6.1–12 cm) 38.0%, the third class (12.1–24 cm) 19.4%, and the fourth class (24.1–48 cm) 7.3% of all individuals sampled. The 48.1–96 cm class and those larger than 96.1 cm represented 1.7% and 0.3% of the individuals, respectively. Different
diameter distribution patterns were observed in the species
with greater cover value. For instance, M. urundeuva (Fig.
1B), A. colubrina (Fig. 1C), and P. pluviosa (Fig. 1D) exhibited a tendency towards the normal distribution, with
fewer individuals in the upper and lower diameter classes.
Conversely, C. schwackeana (Fig. 1E), C. duarteanum (Fig.
0 100 200 300 400 500 600 700 800
3>6 6>12 12>24 24>48 >48 Classes Diamétricas (cm)
N úm er o de Indi ví duos 0 5 10 15 20 25 30 35 40 % N úm er o de Indi ví duos
Número de Indivíduos % Número de Indivíduos
A 0 5 10 15 20 25 30 35
3 < 6 6,1 < 12 12,1 < 24 24,1 < 48 > 48 Classes Diamétricas (cm)
N úm er o de Indi ví duos 0 5 10 15 20 25 30 35 % N úm er o de Indi ví duos
Número de Indivíduos % Número de Indivíduos
B 0 5 10 15 20 25 30
3 < 6 6,1 < 12 12,1 < 24 24,1 < 48 Classes Diamétricas (cm)
N úm er o de Indi ví duos 0 5 10 15 20 25 30 35 40 % N úm er o de Indi ví duos
Número de Indivíduos % Número de Indivíduos
C 0 20 40 60 80 100 120 140
3 < 6 6,1 < 12 12,1 < 24 24,1 < 48 > 48 Classes Diamétricas (cm)
N úm er o de Indi ví duos 0 10 20 30 40 50 60 % N úm er o de Indi ví duos
Número de Indivíduos % Número de Indivíduos
D 0 5 10 15 20 25 30 35 40 45
3 < 6 6,1 < 12 12,1 < 24 24,1 < 48 Classes Diamétricas (cm)
N úm er o de Indi ví duos 0 5 10 15 20 25 30 35 40 45 50 % N úm er o de Indi ví duos
Número de Indivíduos % Número de Indivíduos
E 0 5 10 15 20 25 30 35 40
3 < 6 6,1 < 12 12,1 < 24 24,1 < 48 Classes Diamétricas (cm)
N úm er o de Indi ví duos 0 5 10 15 20 25 30 35 40 45 50 % N úm er o de Indi ví duos
Número de Indivíduos % Número de Indivíduos
F
Number of individuals Number of individuals
Number of individuals Number of individuals
Number of individuals
Number of individuals % Number of individuals % Number of individuals
% Number of individuals % Number of individuals
% Number of individuals % Number of individuals
Diameter classes (cm) Diameter classes (cm)
Diameter classes (cm) Diameter classes (cm)
Diameter classes (cm) Diameter classes (cm)
% Number of individuals % Number of individuals
% Number of individuals % Number of individuals
% Number of individuals % Number of individuals
Number of individuals Number of individuals
Number of individuals Number of individuals
0 5 10 15 20 25 30 35 40
3 < 6 6,1 < 12 12,1 < 24 24,1 < 48 Classes Diamétricas (cm)
N úm er o de Indi ví duos 0 10 20 30 40 50 60 70 % N úm er o de Indi ví duos
Número de Indivíduos % Número de Indivíduos
G H 0 10 20 30 40 50 60
3 < 6 6,1 < 12 12,1 < 24 24,1 < 48 Classes Diamétricas (cm)
N úm er o de Indi ví duos 0 10 20 30 40 50 60 % N úm er o de Indi ví duos
Número de Indivíduos % Número de Indivíduos
I 0 5 10 15 20 25 30 35
3 < 6 6,1 < 12 12,1 < 24 24,1 < 48 Classes Diamétricas (cm)
N úm er o de Indi ví duos 0 5 10 15 20 25 30 35 40 % N úm er o de Indi ví duos
Número de Indivíduos % Número de Indivíduos
J 0 5 10 15 20 25 30 35
3 < 6 6,1 < 12 12,1 < 24 24,1 < 48 Classes Diamétricas (cm)
N úm er o de Indi ví duos 0 10 20 30 40 50 60 % N úm er o de Indi ví duos
Número de Indivíduos % Número de Indivíduos
K 0 2 4 6 8 10 12 14
6,1 < 12 12,1 < 24 24,1 < 48 48,1 < 96 >96 Classes de Diamétricas (cm)
N úm er o de in di ví duo s 0 10 20 30 40 50 60 % de N ° de in di ví duo s
Número de indivíduos % de Número de indivíduos
K
Figure 1- Diameter distribution of the tree community and of the 11 species of greatest cover value in a seasonally dry tropical forest remnant, Minas Gerais, Brazil.
Figura 1-Distribuição diamétrica da comunidade arbórea e das 11 espécies de maior valor de cobertura em um fragmento de floresta tropical sazonalmente seca, Minas Gerais, Brasil.
A) tree community (comunidade arbórea) B) Myracrodruon urundeuva Allemão., C) Anadenanthera colubrina (Vell.) Brenan., D) Poincianella pluvi-osa DC., E) Coccoloba schwackeana Lindau., F) Combretum duarteanum Cambess., G) Ptilochaeta glabra Niedz., H) Commiphora leptophloeus (Mart.) J.B. Gillet., I) Coutarea hexandra (Jacq.) K. Schum., J) Handranthus impetiginosus (Mart. ex DC.) Standl., K) Aspidosperma pyrifolium Mart., and L)
Cavanillesia arborea (Willd.) K.Schum.
0 5 10 15 20 25 30 35
3 < 6 6,1 < 12 12,1 < 24 24,1 < 48 Classes Diamétricas (cm)
N úm er o de Indi ví duos 0 5 10 15 20 25 30 35 40 45 50 % N úm er o de Indi ví duos
Número de Indivíduos % Número de Indivíduos
1F), and P. glabra (Fig. 1G) exhibited a tendency towards reverse J-shaped distributions, with a higher number of
individuals in lower diameter classes, whereas Commiphora
leptophloeus (Fig. 1H) and C. arborea (Fig. 1L) tended
towards J-shaped distributions, with the highest percentage
of individuals in the largest diameter class. The species C.
hexandra (Fig. 1J), H. impetiginosus (Fig. 1K), P. pluviosa,
and A. pyrifolium (Fig. 1L) had the greatest percentage of
individuals in the second diameter class, as observed in the
diameter distribution of the entire community.
Number of individuals Number of individuals
Number of individuals
Number of individuals
Number of individuals
Number of individuals
% Number of individuals
% Number of individuals
% Number of individuals % Number of individuals
% Number of individuals
Diameter classes (cm) Diameter classes (cm)
Diameter classes (cm) Diameter classes (cm)
Diameter classes (cm) Diameter classes (cm)
Number of individuals % Number of individuals Number of individuals % Number of individuals
% Number of individuals % Number of individuals
% Number of individuals % Number of individuals
Number of individuals Number of individuals
Number of individuals Number of individuals
3.2 Environmental variables
The eigenvalues found in the CCA were 0.182 for the first axis and 0.146 for the second axis. The low eigenvalues found (<0.5) indicate the occurrence of a poor species replacement in the soil gradient. The first axis accounted for 4.3% and the second 3.5% of data total variance (accumulated total 7.8%) resulting in a higher proportion of unexplained variation. However, “noise” data are common
in vegetation studies and do not affect the interpretation of
species-environment relationships (TER BRAAK, 1987).
Therefore, this poor species replacement indicates that soil variables had little impact in explaining the variation in
vegetation abundance. Nevertheless, the abundance CCA (Fig. 2) had a high correlation in the two first axes (0.895 and 0.787), indicating the significance of the species-environment relationship.
The Monte Carlo permutation test showed that species abundance correlated significantly with
environmental variables in the first two ordination axes (p=0.001). All soil variables correlated positively with the first axis, with the exception of K, which correlated
negatively with the first axis. Finally, P-rem correlated negatively with the second axis.
4 DISCUSSION
4.1 Floristics, structure, and diversity
The number of species recorded in our study (79)
was higher than in most studies that investigated the
structure of SDTFs, which ranged between 40 and 70 species (ARRUDA et al., 2011; FAGUNDES et al., 2007; FELFILI et al., 2007; SANTOS et al., 2007). The studies that found more than 75 species in SDTF fragments (LIMA et al., 2009; SANTOS et al., 2012) had larger sample sizes
or lower inclusion criteria that enabled the inclusion of
non-tree species.
The high species richness found in the study site was probably the result of its location in a transitional area between the Cerrado and Caatinga domains, which enables the overlapping of species niches, its association
with high fertility soils and good conservation status.
Moreover, the species with endangered conservation status
and little scientific knowledge highlight the importance of preserving the study area.
Fabaceae had the highest species richness in the
study community. In fact, this family is very typical of and
predominant in SDTFs, and was the most representative family in most studies on community structure of SDTFs
(ARRUDA et al., 2011; NASCIMENTO et al., 2004; SANTOS, 2007). Other families with high species
richness in our study such as Bignoniaceae, Malvaceae,
and Euphorbiaceae were also representative in other vegetation studies in northern Minas Gerais (SANTOS et al., 2007, 2011). According to Gentry (1995), these families are typical of deciduous communities. Moreover,
the study area can be included in the SDTFs great biome
(PENNINGTON et al., 2009), and this SDTF patch is being
able to be a great species dispersion nucleus into other areas
due to the species richness found (SANTOS et al., 2012). Three of the 10 species with the highest density have also the highest density in the study by Nascimento et al. (2004) in a deciduous slope forest in Monte Alegre, state of Goiás, Brazil: C. duarteanum, H. impetiginosus,
and M. urundeuva. In fact, the latter species was recorded
in most studies of the Caatinga (NASCIMENTO et al., 2004; SANTOS et al., 2007, 2011; SILVA; SCARIOT, 2004) along with C. arborea (FELFILI et al., 2007;
NASCIMENTO et al., 2004; SANTOS et al., 2011), which Figure 2 - Canonical correspondence analysis (CCA) diagram
of species abundance in a Seasonally Dry Tropical Forest rem-nant in Minas Gerais, Brazil.
Figura 2 - Diagrama gerado pela análise de correspondência canônica (CCA) de abundância de espécies em um remanescente de Floresta Tropical Sazonalmente Seca (FTSS) em Minas Gerais, Brasil.
P1 P2
P3
P4 P5
P6 P7 P8
P9 P10
P11 P12
P13 P14
P15 P16
P17 P18
P19
P20
P21 P22
P23 P24
P25
P26 P27 P28 P29
P30 P31 P32
P33 P34 P35
P36 P37 P38
P39 P40
P41
P42 P43 P44
P45
P46
P47 P48P49
P50 P51 P52 P53
P54
P55
P56 P57 P58
P59 P60
K
Ca (T) MO
P-rem
0 0
10 20 30
10 20 30
Axis 1
A
xi
shows the great representativeness of the two species in several areas of the Caatinga domain, their tolerance to environmental heterogeneity, and strong adaptation to the
seasonal characteristics of the SDTF biome.
Several species recorded in the study site are cited
by Prado and Gibbs (1993) as typical of the Caatinga such
as A. colubrina, Piptadenia viridiflora (Kunth) Benth,
Ruprechtia laxiflora Meisn., S. brasiliensis, Sterculia
striata A. St.-Hill. & Naudin, C. leptophloeus, Machaerium
acutifolium Vogel, Senna spectabilis (DC.) H.S. Irwin
& Barneby, and A. pyrifolium. Additionally, the species
Fraunhofera multiflora Mart. and Spondias tuberosa
Arruda are endemic to that domain.
According to the classification by Santos et al. (2012), Caatinga species are distributed into five floristic
subunits: Caatinga growing on soils derived from crystalline basements, Caatinga on sedimentary sand deposits,
rupicolous Caatinga, arboreal Caatinga, and dry forests. The
study area is characterized by the presence of species typical
of arboreal Caatinga such as C. arborea, Cereus jamacaru
DC., C. duarteanum, M. urundeuva, Bauhinia cheilantha
(Bong.) Steud., Casearia selloana Eichl., C. caatingae,
Pereskia bahiensis Gürke, P. pluviosa, and species typical of
dry forests such as Eugenia florida DC., Guapira opposita
(Vell.) Reitz, Handroanthus ochraceus (Cham.) Mattos,
H. impetiginosus, Zanthoxylum stelligerum Turcz., A.
colubrina, and M. acutifolium (SANTOS et al., 2007, 2012).
Additionally, S. tuberosa and Jatropha mollissima (Pohl)
Baill. were considered by Santos et al. (2012) as restricted to the crystalline Caatinga. The presence of species that occur
in different phytophysiognomies reinforces the ecotonal character of the study area and emphasizes its conservation
and biological importance.
Cavanillesia arborea had the highest cover value,
which can be explained mainly by the large basal area values
found in spite of its low RD. Poincianella pluviosa had the
second highest cover value, but contrarily to C. arborea
had small basal area and high DR, with several individuals
equally distributed in the plots. These results demonstrate the
opposite colonization strategies by the most representative species: to allocate resources either in basal area or large
numbers of individuals.
We found higher values for the Shannon diversity index (H’) and equability (J’) than in other SDTF studies (SANTOS et al., 2007; SILVA; SCARIOT, 2004),
further highlighting the importance of the study area for
conservation.
The diameter distribution of M. urundeuva and
A. colubrina exhibited a tendency towards normality,
with a small percentage of individuals in smaller and
larger diameter classes. A similar pattern was found by Fagundes et al. (2007) and Santos et al. (2011). In addition,
the diameter distribution of P. pluviosa also exhibited a
tendency towards normality, both in our study and in the
one by Santos et al. (2011). Conversely, C. leptophloeus exhibited a J-shaped distribution, suggesting the role of seasonality in the recruitment of individuals, as this process is more intense in the recruitment phase than in established individuals, which usually remain stable over the years
(CARVALHO; FELFILLI, 2011). Our results indicate that
the diameter distribution of SDTF species has a different pattern from most humid forest communities, which exhibit a tendency towards reverse-J shaped distributions, with
larger numbers of individuals in smaller diameter classes.
The environmental seasonality results in leaf loss and, consequently, increased incidence of light, during the dry season, affecting ecological processes such as species growth and stem increase, which are higher in the rainy
season (CARVALHO; FELFILI, 2011). For instance,
by storing water in their stems, some species such as C.
arborea, S. tuberosa, and C. jamacaru exhibit higher
growth rates in periods of higher water availability and
avoid drought in seasonal environments (CARVALHO; FELFILI, 2011; NASCIMENTO et al., 2004).
The study site is well-preserved, and the patterns found cannot be explained by human interference, but by the heterogeneity of the average diameter distribution of SDTF species, as observed in other studies of these
communities (FAGUNDES et al., 2007; SANTOS et al., 2011). The seasonal character of the environment results in the seasonality of ecological processes (PENNIGTON et al., 2000), which affect each species differently depending on their ecological adaptive strategies to water stress.
4.2 Environmental variables
The CCA did not indicate the formation of floristic groups in the study site. This result was probably caused
by the uniform soil fertility in the area, which results in a homogeneous environment with little species variability
among transects.
The ordination graph presented a short gradient due
to the great soil fertility in the study area. Even though the
homogeneity in soil fertility along the fragment results in little variability in species richness and abundance, the high
correlation between the first two axes indicates that this
composition and distribution. In addition to soil, several
factors affect species distribution, many of which are not easily perceptible or measurable such as light, water, and
dispersal factors.
We detected the species homogeneity composition
among the transections through the results obtained by the CCA associated with the diameter classes homogeneity
distribution found through the Kruskal-Wallis test which
reinforces the study area to be the a peculiar unit of SDTFs for presenting particular characteristics as the great soil fertility, ecotonal composition of species and species
behaviors in an advanced successional stage. We performed the first structural work related to edaphic variables in
punctual areas of the Caatinga domain and realized the importance to understand this relationship to establish priority areas to conservation, specially due to the complex
soil mosaic existing in the domain. According to Prado (2005), soil-plant relationships had not been studied in SDTFs by the year 2005. Our results show that this area
should be considered a priority to conservation efforts since it presents tree elements important in maintaining the ecosystem, working as a source of propagules and seeds for other areas as well as keeping the natural cycling of the organic matter and the consequent soil fertility due
to the deciduous factor. We stress, at last, the importance
of studies in SDTFs remnants, for the possibility of knowing the biodiversity and detecting the priority areas
for conservation.
5 REFERENCES
ANGIOSPERM PHYLOGENY GROUP. An update of the Angiosperm Phylogeny Group classification for the orders and families of flowering plants: APG II. Botanical Journal of the Linnean Society, London, v. 141, n. 4, p. 399-436, 2003.
ARRUDA, D. M.; BRANDÃO, D. O.; COSTA, F. V.; TOLENTINO, G. S.; BRASIL, R. D.; NETO, S. D.; NUNES, Y. R. F. Structural aspects and floristic
similarity among tropical dry forest fragments with different management histories in northern Minas
Gerais, Brazil. Revista Árvore, Viçosa, MG, v. 35, n. 1, p. 131-142, jan./fev. 2011.
BOTREL, R. T.; OLIVEIRA-FILHO, A. T.;
RODRIGUES, L. A.; CURI, N. Composição florística e estrutura da comunidade arbórea de um fragmento de floresta estacional semidecidual em Ingaí, MG, e a influencia de variáveis ambientais na distribuição das
espécies. Revista Brasileira de Botânica, São Paulo, v. 25, n. 2, p. 195-213, 2002.
TER BRAAK, C. J. F. The analysis of vegetation
environment relationships by canonical correspondence
analysis. Vegetatio, The Hague, v. 69, n. 3, p. 69-77, 1987.
TER BRAAK, C. J. F. Ordination. In: JONGMAN, R. H. G.; BRAAK, C. J. F. ter; TONGEREN, O. van. Data analysis in community and landscape ecology. Cambridge: Cambridge University, 1995. p. 91-173. BROWER, J. E.; ZAR, J. H. Field and laboratory methods for general ecology. Dubuque: W. M. C. Brow, 1984. 226 p.
CARVALHO, F. A.; FELFILI, J. M. Variações temporais na comunidade arbórea de uma floresta decidual sobre afloramentos calcários no Brasil Central: composição, estrutura e diversidade florística. Acta Botanica Brasilica, Porto Alegre, v. 25, n. 1, p. 203-214, 2011. EMPRESA BRASILEIRA DE PESQUISA
AGROPECUÁRIA. Sistema brasileiro de classificação
de solos. Rio de Janeiro, 2006.
FAGUNDES, L. M.; CARVALHO, D. A. de; VAN DEN BERG E.; SÁ, J. J. G.; MARQUES, M.; MACHADO, E. L. M. Florística e estrutura do estrato arbóreo de dois fragmentos de florestas decíduas às margens do rio Grande, em Alpinópolis e Passos, MG, Brasil. Acta Botanica Brasilica, Porto Alegre, v. 21, n. 1, p. 65-78, 2007.
FELFILI, J. M.; NASCIMENTO, A. R. T.; FAGG, C. W.; MEIRELLES, E. M. Floristic composition and
community structure of a seasonally deciduous forest on
limestone outcrops in Central Brazil. Revista Brasileira de Botânica, São Paulo, v. 30, n. 4, p. 611-621, 2007. GENTRY, A. H. Diversity and floristic composition of Neotropical dry forests. In: BULLOCK, S. H.; MOONEY, H. A.; MEDINA, E. (Ed.). Seasonal dry tropical forests. Cambridge: Cambridge University, 1995. p. 146-194.
LIMA, J. R.; SAMPAIO, E. V. S. B.; RODAL, M. J. N.; ARAÚJO, F. S. Composição florística da floresta estacional decídua montana de Serra das Almas, CE, Brasil. Acta Botonica Brasilica, Porto Alegre, v. 23, n. 3, p. 756-763, 2009.
montana (mata seca) da RPPN Serra das Almas, Ceará. Revista Brasileira de Biociências, Porto Alegre, v. 5, n. 2, p. 438-440, 2007.
MCCUNE, B.; MEFFORD, M. J. PC-ORD, version 5.0, multivariate analysis of ecological data. Glaneden Beach: MjM Solfware Desing, 2006.
MUELLER-DOMBOIS, D.; ELLENBERG, H. Aims and methods of vegetation ecology. New York: Wiley, 1974. 574 p.
NASCIMENTO, A. R. T.; FELFILI, J. M.;
MEIRELLES, M. Florística e estrutura da comunidade arbórea de um remanescente de Floresta Estacional Decidual de encosta, Monte Alegre, GO, Brasil. Terra,
Barcelona, v. 18, n. 3, p. 659-669, 2004.
OLIVEIRA-FILHO, A. T.; JARENKOW, J. A.; RODAL, M. J. N. Floristic relationships of seasonally
dry forests of eastern South America based on tree
species distribution patterns. In: PENNINGTON, R. T.; LEWIS, G. P.; RATTER, J. A. (Ed.). Neotropical savannas and dry forests: plant diversity,
biogeography and conservation. Oxford: Taylor & Francis, 2006. p. 59-192.
PENNINGTON, R. T.; LAVIN, M.; OLIVEIRA-FILHO, A. Woody plant diversity, evolution, and ecology in
the tropics: perspectives from seasonally dry tropical
forests. Annual Review of Ecology, Evolution and Systematics, Palo Alto, v. 40, n. 4, p. 37-57, Dec. 2009. PENNINGTON, R. T.; LEWIS, G. P.; RATTER, J. A.
An overview of the plant diversity, biogeography and
conservation of Neotropical Savannas. In: ______. Neotropical savannas and dry forests: plant diversity, biogeography and conservation. Oxford: Taylor & Francis, 2006. p. 1-30.
PENNINGTON, R. T.; PRADO, D. E.; PENDRY, C. A. Neotropical seasonally dry forests and Quaternary vegetation change. Journal of Biogeography, Oxford,
v. 27, n. 2, p. 261-263, 2000.
PEREIRA, I. M.; ANDRADE, L. A. de; BARBOSA, M. R. de V.; SAMPAIO, E.V. S. B. Composição florística e análise fitossociológica do componente arbustivo-arbóreo de um remanescente florestal no agreste
paraibano. Acta Botanica Brasilica, Porto Alegre, v. 16, n. 3, p. 357-369, 2002.
PRADO, D. E. As caatingas da América do sul. In: LEAL, I. R.; TABARELLI, M.; SILVA, J. M. C. (Ed.).
Ecologia e conservação da Caatinga. 2. ed. Recife:
UFPE, p. 3-74, 2005.
PRADO, D. E.; GIBBS, E. P. Patterns of species
distributions in the dry seasonal forests of South
America. Annals Missouri Botany Garden, Saint
Louis, v. 80, n. 4, p. 902-927, 1993.
RODAL, M. J. N.; NASCIMENTO, L. M. The arboreal component of a dry forest in northeastern Brazil. Brazilian Journal of Biology, São Carlos, v. 66, n. 2, p. 479-491, 2006.
NTOS, R. M.; BARBOSA, A. C. M. C.; Almeida H. de S.; VIEIRA, F. de A.; SANTOS, P. F.; CARVALHO; D. A. de; OLIVEIRA-FILHO, A. T. de. Estrutura e florística de um remanescente de caatinga arbórea em Juvenília, norte de Minas Gerais, Brasil. Cerne, Lavras,
v. 17, n. 2, p. 247-258, 2011.
SANTOS, R. M.; VIEIRA, F. de A.; GUSMÃO, E.; NUNES, Y. R. F.Florística e estrutura de uma floresta
estacional decidual, no Parque Municipal da Sapucaia,
Montes Claros, MG. Cerne, Lavras, v. 13, n. 3, p. 248-256, 2007.
SANTOS, R. M.; OLIVEIRA-FILHO, A. T. de, EISENLOHR, P. V .; QUEIROZ, L. P.; CARDOSO, D. B. O. S.; RODAL, M. J. N. Identity and relationships of the Arboreal Caatinga among other floristic units of seasonally dry tropical forests (SDTFs) of north-eastern and Central Brazil. Ecology and Evolution, Oxford, v. 2, n. 2, p. 409-428, 2012.
SILVA, L. A.; SCARIOT, A. Composição e estrutura da comunidade arbórea de uma floresta estacional decidual sobre afloramento calcário no Brasil central. Revista Árvore, Viçosa, v. 28, n. 1, p. 69-75, jan./fev. 2004. VELLOSO, A. L.; SAMPAIO, E. V. S. B. Ecorregiões: propostas para o bioma Caatinga. Recife: Associação de Plantas do Nordeste; Instituto de Conservação Ambiental The Nature Conservancy do Brasil, 2002. 76 p.
ZAR, J. H. Biostatistycal analysis. 15th ed. New Jersey: Prentice-Hall, 2010. 944 p.