INFLUENCE OF ENVIRONMENTAL VARIATIONS ON THE FORMATION OF
MICROHABITATS WITHIN A FRAGMENT OF SEASONALLY DRY TROPICAL
FOREST - SDTF, BRAZIL
1Gabriela Gomes Pires de Paula2*, Rubens Manoel dos Santos3, Gisele Cristina de Oliveira Menino4,
Deborah Mattos Guimarães Apgaua5, Diego Gualberto Sales Pereira3, Cléber Rodrigo de Souza2 and
Marco Aurélio Leite Fontes3
1 Received on 29.08.2017 accepted for publication on 25.05.2018.
2 Universidade Federal de Lavras, Programa de Pós-Graduação em Engenharia Florestais, Lavras, MG-Brasil. E-mail: <gabyfloresta@gmail.com> and <crdesouza@hotmail.com>.
3 Universidade Federal de Lavras, Departamento de Ciências Florestais, Lavras, MG-Brasil. E-mail: <rubensmanoel.dcf.ufla.br>, <diegogspereira@gmail.com> and <fontes@dcf.ufla.br>.
4 Instituto Federal Goiano, Departamento de Ciências Biológicas, Rio Verde, GO-Brasil. E-mail: <giselecristina.biologa@yahoo.com.br>. 5Centre for Tropical Environmental and Sustainability Sciences, College of Marine and Environmental Sciences, James Cook University, Cairns, Qld, Austrália. E-mail: <deborah_ufla@yahoo.com.br>.
*Corresponding author.
ABSTRACT – Caatinga represents one of the two major centers of Seasonally Dry Tropical Forests (SDTF) and is completely inserted in the Brazilian territory. The present work aimed to evaluate the structure of two micro-environments and relate them to environmental variables. Twenty 20 × 20 m plots were placed in which we measured the height and CBH and made the botanical identification of all trees with CBH >10 cm. The CCA and indicator species analysis presented a clear distribution of species according to the micro-environments. We concluded that the presence of limestone slabs provided the formation of microhabitats, thus influencing the distribution and composition of tree species, what characterized the phytoecological unit here referred as “furados”.
Keywords: Environmental variations, Beta diversity, Limestone slabs.
INFLUÊNCIA DAS VARIAÇÕES AMBIENTAIS NA FORMAÇÃO DE
MICRO-HABITATS EM UM FRAGMENTO DE FLORESTAS TROPICAIS
SAZONALMENTE SECAS, BRASIL
RESUMO – A caatinga corresponde a um dos dois maiores núcleos das Florestas Tropicais Sazonalmente Secas (FTSS) e se encontra totalmente inserida no território brasileiro. Objetivou-se com este estudo avaliar a estrutura de dois micro-habitats relacionando-a com as variáveis ambientais. Foram alocadas 24 parcelas, nas quais mensuramos o CAP e fizemos a identificação botânica de todos os indivíduos arbóreos com CAP > 10 cm. Com a presença de lajedos de calcário na área, foi possível distinguir dois micro-habitats. A CCA e a análise de espécies indicadoras mostraram uma nítida distribuição das espécies de acordo com os habitats. Concluímos que a presença dos lajedos de calcário proporcionou a formação dos micro-habitats, influenciando na distribuição e composição das espécies arbustiva-arbóreas, caracterizando a unidade fitoecológica aqui denominada como “furados”.
1.INTRODUCTION
The Seasonally Dry Tropical Forests (SDTF) represent disjoint vegetation formations annually exposed to water deficits for a period greater than or equal to five months that share species and genera adapted to water scarcity (Moro et al., 2016). Pennington et al., (2009) proposed SDTF as one of the leading world biomes or a global metacommunity.
In this context, we highlight Brazilian Caatinga as the largest semi-arid tropical ecoregion of South America and one of the two largest cores of SDTF (Caetano et al., 2008; Moro et al., 2016). Caatinga presents a great physiognomic and floristic variation resulting from the interaction of a set of factors, mainly rainfall and soil moisture (Prado, 2005; Santos et al., 2012), and shelter remnants of other vegetation types, such as savannah and rupestrian fields. Additionally, lithological differences at regional or local scale contributes to the vegetation mosaic of Caatinga (Rodal et al., 2008; Santos et al., 2012). Despite of such particularities, the Caatinga has been suffering intensive exploration and degradation mainly by agricultural practice, logging (wood and coal) and expansion of farmland, thus causing great environmental impacts and decimating the remnants of arboreal Caatinga in the northern region of Minas Gerais (Santos et al., 2008). The present study aimed to test the influence of micro-environmental characteristics on species richness and the horizontal structure of the shrubby tree community of a Seasonally Dry Tropical Forest (SDTF) fragment and test whether the presence of limestone slags influences the distribution and composition of species in this fragment.
2.METHODS 2.1. Area of study
The present work was carried out in a forest remnant located in the municipality of Montalvânia, northern Minas Gerais (Fig. 1) The climate is tropical semi-arid (Bsh), with hot and dry summers. Mean annual temperature and precipitation are 23 oC and 935 mm
year-1 (Embrapa, 2012), respectively, with rainfall
concentrated from November to January.
The study area presents a flat relief with depressions associated with limestone slabs which sometimes are exposed providing areas of retention and accumulation
of water in the rainy season. The sparse vegetation occurs in function of the presence of shallow soils leading to empty spaces in the landscape, which are popularly called “furados” (Brandão and Gavilanes, 1994; Santos et al., 2012). The presence of slabs provides two distinct microhabitats to the fragment in which we find both vegetation on deep soils and limestone slabs.
The study area is inserted in a region with Arboreal Caatinga as predominant phytophysiognomy (Santos et al., 2012), which is part of the large field of Tropical Seasonally Dry Forests. The fragment presents a good condition of conservation, although cattle was observed in some plots.
The geological formation was classified based on the exposed rock. The classification was performed by the team of Laboratory of Mineralogy and Soil Chemistry of the Federal University of Lavras.
2.2. Dataset
In general, 24 plots of 400 m² were placed 30 m apart from each other. The plots were distributed in four transects with a minimum distance of 50 m between tansects, to cover the microenvironmental variations, characterized by the presence of slabs of limestone. Data collection was concluded on January 2011.
The criterion of inclusion for arboreal individuals was the CBH (circumference at breast height, 1.30 m from the ground) > 10 cm. For individuals with bifurcations below the CBH we followed the procedures recommended by Scolforo and Melo (1997).
Botanical identifications were made in the field as well as consulting experts and herbariums. The classification system used follows the APG II adopting Souza and Lorenzi (2005) for the family level. Synonyms and new species combinations were made using the REFLORA (2014) database.
We used parameters based on Mueller-Dombois and Ellemberg (1974) to describe the fragment and each microhabitat horizontally (Supplementary Material).
2.3. Soil Variables
One soil sample was taken from each plot at a depth of 0 to 10 cm to characterize the physical and chemical aspects. Chemical and physical analyzes were performed by Laboratory of Soil Analyses of the Federal University of Viçosa, measuring the following parameters: pH, P, K, Na, Ca2+, Mg2+, Al3+, SB, (t), (T), V, m, organic
matter, Zn, Fe, Mn, Cu, sand, silt and clay. The results of soil analyses were used to compose the environmental matrix of the Canonical Correspondence Analysis (CCA). In function of the presence of limestone slabs we measured the depth using a bar of 1.50 m to make perforations in the soil. Areas with water accumulation, presence of exposed limestone and soil depth lower than one meter were denominated “furados”. On the other hand, plots with soil depth greater than one meter were classified as “vegetation on deep soils”.
2.4. Data Analysis
In order to respond to the proposed objective, the following steps were conducted: i) phytosociological characterization of each microhabitat by means of the structural parameters of absolute and relative density (AD and RD), frequency, dominance (ADo) and importance value (Mueller-Dombois and Ellemberg, 1974), besides the diversity indices of Shannon (H ‘) and Pielou equability (J’) in order to analyze whether the environments have different composition and structure; ii) division of individuals (with sampling n greater than 25 in both microhabitats) in diametric classes of increasing amplitude to compensate the concentration of individuals in the smaller classes (Oliveira Filho et al., 2001); iii) identification of indicator species of each microhabitat through the indicator species analysis (package “indicspecies” of software R); iv) calculation of the Whittaker beta diversity (Whittaker, 1960) on each microhabitat in order to evaluate whether the replacement of species within each unit is distinct;
v) identification of environmental variables that have significant effect on species distribution and differentiation of microhabitats by means of the Canonical Correspondence Analysis (CCA). This analysis is used when the objective is to obtain a better relationship of environmental variables and species abundance (Kent and Coker, 1992). The selection and use of parameters in the environmental matrix were made based on the results of an analysis of two independent samples using Student’s t-test. The selected variables were transformed according to Zar (2010) and finally the Monte Carlo test was carried out to assess the significance of results (Ter Braak, 1988). The multivariate analysis, CCA and beta diversity assessments were conducted using the software R (R Development Core Team, 2015), package vegan (Oksanen, 2010).
3.RESULTS 3.1. Dataset
Overall, 1375 individuals belonging to 58 species, 52 genera and 20 botanical families were sampled. The absolute dominance and density were 32.96 m2 ha-1 and 1375 ind ha-1, respectively (Table1).
The most representative family regarding number of species was Fabaceae (17), followed by Malvaceae (5), Anacardiaceae, Cactaceae and Euphorbiaceae (the three with four species). Bignoniaceae stood out regarding abundance in the survey (344), representing 25% of the sampled individuals which dominance was provided by the species Handroanthus ochraceus (Cham.) Mattos(213). This species is widely distributed in deciduous forests and edges of semi-deciduous forests (Santos et al., 2011).
The Shannon-Wiener diversity index (H’) for the community was estimated at 3.02 nats ind-1 and the Pielou equability (J’) at 0.74. Regarding microhabitats, H’ was estimated at 2.99 nats ind-1 and 2.55 nats ind-1, while J’ was 0.79 and 0.67 for “furados” and vegetation in deep soil, respectively.
3.2. Soil Variables
The geological formation classified as limestone of Serra de Santa Helena from Neoproterozoic was observed in the studied fragment, which belongs to the Bambuí group. This formation is the responsible by the presence of “furados” in this fragment.
Table 1 - Phytosociological table of the community and microhabitats of a fragment in Montalvânia – MG. Tabela 1 - Tabela fitossociológica da comunidade e dos microhabitats de um fragmento em Montalvânia - MG
Family/Species Community Furados Vegetation in Deep Soil - VDS
IN AD AF ADo IV IN AD AF ADo IV IN AD AF ADo IV
ANACARDIACEAE
Cyrtocarpa caatingae J.D.Mitch. 1 1.0 4.0 0.03 0.46 - - - 1 2.50 10.00 0.07 1.18
& Daly
Myracrodruon urundeuva Allemão 99 99.0 84.0 3.90 25.45 36 60.00 73.33 2.27 16.95 63 157.50 100.00 6.34 41.30
Schinopsis brasiliensis Engl. 3 3.0 12.0 0.01 1.17 - - - 3 7.50 30.00 0.03 2.87
Spondias tuberosa Arruda 11 11.0 32.0 0.49 4.75 11 18.33 53.33 0.82 7.86 - - - -
-APOCYNACEAE
Aspidosperma pyrifolium Mart. 4 4.0 8.0 0.05 1.05 4 6.67 13.33 0.08 1.82 - - - -
-ARALIACEAE
Aralia excelsa (Griseb.) J.Wen 7 7.0 24.0 0.13 2.73 4 6.67 20.00 0.16 2.55 3 7.50 30.00 0.07 3.03
BIGNONIACEAE
Arrabidaea bahiensis (Schauer) 73 73.0 36.0 0.68 10.11 5 8.33 20.00 0.18 2.75 68 170.00 60.00 1.42 19.79
Sandwith & Moldenke
Handroanthus ochraceus 213 213.0 60.0 2.14 26.58 36 60.00 40.00 1.10 11.31 177 442.50 90.00 3.72 46.51
(Cham.) Mattos
Tabebuia reticulata A.H.Gentry 58 58.0 56.0 0.32 9.46 12 20.00 53.33 0.08 6.04 46 115.00 60.00 0.67 13.79
BORAGINACEAE
Auxemma oncocalyx (Allemão) Taub. 6 6.0 12.0 0.04 1.47 4 6.67 13.33 0.03 1.68 2 5.00 10.00 0.05 1.26
BURSERACEAE
Commiphora leptophloeus 75 75.0 68.0 3.02 19.82 68 113.33 93.33 4.71 29.69 7 17.50 30.00 0.49 5.23
(Mart.) J.B.Gillet CACTACEAE
Cereus jamacaru DC. 3 3.0 4.0 0.10 0.83 3 5.00 6.67 0.17 1.40 - - - -
-Pereskia bahiensis Gürke 12 12.0 20.0 0.08 2.64 11 18.33 26.67 0.10 3.94 1 2.50 10.00 0.04 1.07
Pilosocereus gounellei (F.A.C.Weber) 3 3.0 12.0 0.02 1.21 3 5.00 20.00 0.04 2.07 - - - -
Byles & G.D.Rowley
Pilosocereus pachycladus F.Ritter 7 7.0 12.0 0.12 1.79 7 11.67 20.00 0.20 3.09 - - - -
-CARICACEAE
Jacaratia corumbensis Kuntze 1 1.0 4.0 0.001 0.38 - - - 1 2.50 10.00 0.003 0.93
COMBRETACEAE
Combretum leprosum Mart. 161 161.0 48.0 0.84 17.93 25 41.67 20.00 0.23 5.85 136 340.00 90.00 1.76 33.11
Terminalia phaeocarpa Eichler 3 3.0 4.0 0.04 0.63 3 5.00 6.67 0.06 1.11 - - - -
-EUPHORBIACEAE
Cnidoscolus oligandrus (Müll.Arg.) Pax 2 2.0 8.0 0.09 1.03 2 3.33 13.33 0.15 1.71 - - - -
-Manihot tripartita(Spreng.) Müll.Arg. 2 2.0 8.0 0.01 0.79 1 1.67 6.67 0.01 0.67 1 2.50 10.00 0.02 0.98
Sapium argutum(Müll.Arg.) Huber 12 12.0 36.0 0.03 3.73 10 16.67 46.67 0.05 5.16 2 5.00 20.00 0.01 1.87
Stillingia saxatilis Müll.Arg. 46 46.0 64.0 0.18 8.77 40 66.67 80.00 0.24 12.67 6 15.00 40.00 0.08 4.25
FABACEAE
Acosmium lentiscifolium Schott 6 6.0 20.0 0.02 2.03 - - - 6 15.00 50.00 0.05 4.94
Amburana cearensis (Allemão) A.C.Sm. 21 21.0 28.0 0.52 5.25 18 30.00 26.67 0.64 6.39 3 7.50 30.00 0.35 4.10
Anadenanthera colubrina (Vell.) Brenan 12 12.0 32.0 0.46 4.73 5 8.33 26.67 0.22 3.35 7 17.50 40.00 0.83 7.33
Centrolobium sclerophyllum H.C.Lima 2 2.0 8.0 0.04 0.89 - - - 2 5.00 20.00 0.11 2.25
Coursetia rostrata Benth. 1 1.0 4.0 0.001 0.38 1 1.67 6.67 0.001 0.66 - - - -
-Dalbergia cearensis Ducke 11 11.0 20.0 0.17 2.84 1 1.67 6.67 0.02 0.69 10 25.00 40.00 0.40 6.07
Enterolobium timbouvaMart. 8 8.0 28.0 0.31 3.67 4 6.67 20.00 0.36 3.08 4 10.00 40.00 0.23 4.57
Lonchocarpus montanus A.M.G. 3 3.0 4.0 0.01 0.56 - - - 3 7.50 10.00 0.03 1.30
Azevedo ex M.J.Silva & A.M.G.Azevedo
Luetzelburgia andradelimae H.C.Lima 37 37.0 48.0 0.24 7.09 21 35.00 66.67 0.30 8.98 16 40.00 20.00 0.15 4.41
Machaerium acutifoliumVogel 13 13.0 24.0 0.12 3.15 2 3.33 13.33 0.01 1.34 11 27.50 40.00 0.29 5.78
Machaerium leucopterum Vogel. 8 8.0 4.0 0.36 1.97 - - - 8 20.00 10.00 0.90 5.39
Parapiptadenia rigida (Benth.) Brenan 6 6.0 16.0 0.05 1.82 1 1.67 6.67 0.01 0.67 5 12.50 30.00 0.12 3.52
Peltophorum dubium (Spreng.) Taub. 1 1.0 4.0 0.16 0.87 - - - 1 2.50 10.00 0.40 2.48
Platymiscium floribundum Vogel 1 1.0 4.0 0.002 0.38 1 1.67 6.67 0.003 0.66 - - - -
-Poecilanthe falcata (Vell.) Heringer 1 1.0 4.0 0.001 0.38 - - - 1 2.50 10.00 0.003 0.93
Poincianella pluviosa (DC.) 20 120.0 56.0 1.46 17.43 82 136.67 46.67 1.58 19.95 38 95.00 70.00 1.27 15.75
L.P.Queiroz 1
Sweetia fruticosa Spreng. 4 4.0 16.0 0.06 1.70 1 1.67 6.67 0.04 0.75 3 7.50 30.00 0.09 3.12
LYTHRACEAE
Lafoensia pacari A.St.-Hil. 5 5.0 12.0 0.04 1.41 5 8.33 20.00 0.07 2.45 - - - -
-MALPIGHIACEAE
Ptilochaeta bahiensisTurcz. 6 6.0 24.0 0.03 2.37 5 8.33 33.33 0.03 3.35 1 2.50 10.00 0.04 1.06
Ptilochaeta glabra Nied. 1 1.0 4.0 0.002 0.38 - - - 1 2.50 10.00 0.01 0.94
MALVACEAE
Cavanillesia arborea (Willd.) 15 15.0 32.0 12.06 40.14 14 23.33 46.67 17.15 51.04 1 2.50 10.00 4.43 18.13
K.Schum.
Ceiba pubiflora (A.St.-Hil.) K.Schum. 3 3.0 12.0 0.39 2.33 3 5.00 20.00 0.66 3.70 - - - -
-Pseudobombax marginatum 1 1.0 4.0 0.01 0.40 1 1.67 6.67 0.01 0.68 - - - -
-(A.St.-Hil.) A.Robyns
Pseudobombax simplicifolium 38 38.0 40.0 2.25 12.65 38 63.33 66.67 3.75 20.66 - - - -
-A.Robyns
Sterculia striata A.St.-Hill. & Naudin 12 12.0 20.0 0.31 3.34 8 13.33 20.00 0.35 3.63 4 10.00 20.00 0.25 3.09
MELIACEAE
Cedrela fissilis Vell. 12 12.0 28.0 0.57 4.75 11 18.33 40.00 0.65 6.39 1 2.50 10.00 0.46 2.70
MYRTACEAE
Eugenia uniflora L. 166 166.0 60.0 0.58 18.42 127 211.67 66.67 0.80 26.14 39 97.50 50.00 0.25 10.37
POLYGONACEAE
Coccoloba schwackeana Lindau 6 6.0 16.0 0.05 1.81 5 8.33 20.00 0.08 2.47 1 2.50 10.00 0.01 0.95
Ruprechtia apetalaWeddell 22 22.0 56.0 0.17 6.40 14 23.33 66.67 0.20 7.67 8 20.00 40.00 0.13 4.73
Ruprechtia laxiflora Meisn. 1 1.0 4.0 0.003 0.39 - - - 1 2.50 10.00 0.01 0.94
RHAMNACEAE
Ziziphus cotinifolia Reissek 1 1.0 4.0 0.001 0.38 - - - 1 2.50 10.00 0.003 0.93
Ziziphus joazeiro Mart. 2 2.0 4.0 0.02 0.52 - - - 2 5.00 10.00 0.05 1.26
RUBIACEAE
Chomelia pohliana Müll.Arg. 4 4.0 4.0 0.03 0.69 4 6.67 6.67 0.05 1.23 - - - -
-Randia armata (Sw.) DC. 16 16.0 32.0 0.06 3.80 12 20.00 40.00 0.09 5.07 4 10.00 20.00 0.02 2.20
SALICACEAE
Casearia selloana Eichl. 6 6.0 12.0 0.04 1.48 - - - 6 15.00 30.00 0.11 3.60
Prockia crucis P.Browne ex L. 1 1.0 4.0 0.001 0.38 1 1.67 6.67 0.002 0.66 - - - -
-TOTAL 1375 1375.01308.0 32.96 300.00 670 1116.671320.0037.77 300.00 705 1762.501290.00 25.76300.00 Table 1...
Tabela 1...
Legend: IN- individuals number; AD - Absolute density; AF- Absolute frequency; ADo- Absolute dominance; IV- Importance value.
deep soil (9 plots) or “furados” (15 plots): P1 to P6 (“furados”); P7 and P8 (vegetation in deep soil); P9 to P14 (“furados”); P15 to P21 (vegetation in deep soil) and P22 to P24 (“furados”).
3.3. Data Analysis
Differences were observed between microhabitat, both regarding species composition and community structure, resulting in peculiarities and exclusiveness of each microhabitat.
“Furados” presented 670 individuals of 18 families and 44 species, with as Fabaceae the most abundant (137) and richest in species (11). The number of individuals per area (AD) showed that Eugenia uniflora L.,
Poincianella pluviosa (DC.) L.P.Queiroz and
Commiphora leptophloeus (Mart.) J.B.Gilletwere the
on Southern Bahia and Norther Minas Gerais and predominates in karstic soils, which may be considered an indicator of soil quality (Andrade-Lima, 1989).
The plots of forest in deep soil presented 705 individuals of 43 species, with Bignoniaceae representing the most abundant family (291) from a total of 18 families, and Fabaceae as the richest in species (15).
Handroanthus ochraceus (Cham.) Mattos, Combretum
leprosum Mart.and Arrabidaea bahiensis (Schauer)
Sandwith & Moldenkepresented to the highest AD values (54%). Due to the large number of individuals, these three species were among the five species with highest values of ADo (Table1).
The species Handroanthus ochraceus (Cham.) Mattos, Acosmium lentiscifolium Schott, Dalbergia
cearenses Ducke, C. leprosum Mart.and Casearia
selloana Eichl. were indicators of vegetation in deep
soil. Acosmium lentiscifolium Schott, Dalbergia
cearenses Duckeand C. selloana Eichl. are species
restricted to SDTF. In “furados” the species
Pseudobombax simplicifolium A.Robyns and Spondias
tuberosa Arrudawere indicators of this microhabitat.
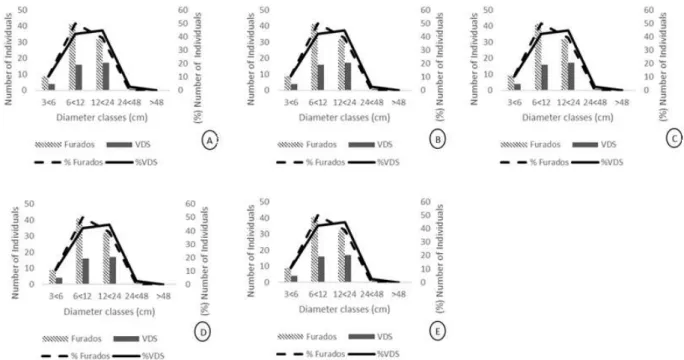
Regarding the distribution of individuals in diameter classes, the species Myracrodruon urundeuva Allemão, Poincianella pluviosa (DC.) L.P.Queiroz, Handroanthus
ochraceus (Cham.) Mattos, Eugenia uniflora L.and
Combretum leprosum Mart.presented similar patterns
in the two microhabitats (Fig. 2A-E).
The CCA presented eigenvalues of 0.414 and 0.202 for axes 1 and 2, respectively. The statistically significant edaphic parameters used in the CCA were remaining phosphorus (P-rem), sodium (Na), pH (pH H2O), coarse sand, clay, depth, potential acidity (H+Al), base saturation index (V) e zinc (Zn). The CCA plot (Fig. 3) showed species replacement and a separation between microhabitats.
The beta diversity analysis (Fig. 4) also demonstrated that there is a difference in species replacement among microhabitats, with greater replacement recorded for “furados”.
Figure 2 – Diameter distribution of populations with n > 25 in one of the two micro-habitats: A. Combretum leprosum; B. Eugenia uniflora; C. Handroanthus ochraceus; D. Myracrodruon urundeuva; E. Poincianella pluviosasampled in the Arboreal Caatinga fragment in Montalvânia, Minas Gerais, Brazil. VDS – Vegetation in Deep Soil. Figura 2 – Distribuição diamétrica das populações com n > 25 nos dois microhabitats: A. Combretum leprosum; B. Eugenia
4.DISCUSSION
The microhabitats within the SDTF allied to the water scarcity and pedogeological characteristics provide a high degree of endemism (DRYFLOR, 2016), species replacement and different phytophysiognomies to the landscape. We highlight the “basal area” among the
studied phytosociological data (Supplementary Material) because it presented a higher value when compared to other areas of SDTF (Santos et al., 2008, 2011; Siqueira et al., 2009; Felfili et al., 2007). The presence of individuals
of Cavallinesia arborea (Willd.) K. Schum. could be
the explanation for the high value of absolute dominance, since this species presents dilation on the trunk in function of water accumulation. However, one cannot exclude the influence of climatic and edaphic factors because the species are susceptible to the dynamics of environmental variables (Botrel et al., 2002).
Fabaceae was the botanical family with greater representation among species. Fabaceae is considered a key group to understand the SDTF, which holds the greatest diversity of species in Caatinga, with morphological adaptations for survival in harsh environments (Cardoso and Queiroz, 2011). Features such as the presence of compound leaves with great photosynthetic capacity in favourable periods and seeds with high dormancy and with the power to store nitrogen, which allows a rapid development of the seedlings. Besides having a high metabolism of nitrogen from the symbiotic relationships with bacteria, conferring a greater competitive advantage in the colonization of seasonally dry and oligotrophic environments. The Adaptive success of Fabaceae in the Caatinga is directly related to the ecology and its morphological adaptations. These Features, or morphological adaptations, are directly related to the adaptive success of Fabaceae in the Caatinga
We also highlight the presence of a non-described species in the fragment, Pseudobombaxsimplicifolium
A.Robyns, for which 38 individuals were found in forest plots of “furados”. The presence of this undescribed species reaffirms the importance of preservation for forest fragments, mainly in the Caatinga domain which is target of great exploitation and poor legislative protection. Currently these fragments represent relicts and remnants of a diverse and endemic flora. Giulietti et al. (2004) estimates that at least 318 from the 932 species recorded for the Caatinga are endemic.
For a long time the caatinga was considered as the result of the degradation of other plant formations, which produced the false idea that it was homogeneous and composed of few species and with a low index of endemism (Alves, 2007). However, the diversity and equability indexes are lower than those found in humid tropical forests, they do not remove from the caatinga Figure 3 – Ordering diagram produced by the Canonical
Correspondence Analysis (CCA) of abundance of 58 species distributed in 24 plots in Montalvânia, Minas Gerais, Brazil, and their relationship with edaphic variables. VDS – Vegetation in Deep Soil. Figura 3 – Diagrama de ordenação produzido por um Analise de Correspondência Canônica (CCA) da abundância das 58 espécies distribuídas em 24 parcelas em Montalvânia, Minas Gerais, Brasil, e sua relação com as variáveis edáficas. VDS – Vegetação em Solo Profundo.
Figure 4 – Beta diversity of microhabitats in a fragment of SDTF, Montalvânia, Minas Gerais, Brazil. VDS – Vegetation in Deep Soil.
their merit and importance as to their richness and diversity. In our study, the Shannon index and Pielou equability demonstrate significant values for the Caatinga, being superior to many other studies (Santos et al., 2007, 2011; Calixto Júnior and Drumond, 2011).
The CCA (Fig. 2) revealed the isolated effect of environmental variables in the community patterns (Capelo, 2003). Featuring eigenvalues of 0.414 and 0.202 for axes 1 and 2 respectively. In this sense, we can affirm that there was a separation of plots into two blocks, which defined the two microhabitats. In addition, the CCA represented a direct relationship between soil depth and species distribution, with plots located on the microhabitat of vegetation in deep soil grouped toward the maximum values of such variable.
The parameters obtained statistical significance and were used in the analysis of CCA were: remaining phosphorus (P-rem), Deph, Clay, Coarse sand, pH, sodium (Na), zinc (Zn), potential acidity (H+Al), base saturation (V). Among the above parameters, V, pH and Na presented higher mean in the microhabitat of forest in deep soil, however their correlations were better associated to the microhabitat “furados”.
The base saturation index (V) is of great relevance within the interpretation of the soil analyzes, since it is used to classify the soils with respect to their fertility (Ernani et al., 2007). Together with the other parameters of the soil analysis, it was possible to define the soil of this fragment as a eutrophic soil, corresponding to a high productivity soil (Ernani et al., 2007). According to Pennington et al. (2000), the good fertility of their soils is one of the main characteristics of FTSS, influencing the species adapted to this adverse environment by water deficiency, but with high natural fertility.
We found a compositional dissimilarity between microhabitats, with greater species replacement recorded for “furados” (Fig. 4). Variations of edaphic conditions frequently associated with topographical position such as depth, chemistry and soil drainage, are clearly one of the main determinants of local floristic variation (John et al., 2007). The presence of limestone slabs influencing mainly the capacity of moisture retention and depth of soil represents a factor of direct influence for the formation of local assemblages. The indicator species (between microhabitats) and graphs of diametric
classes reaffirm a difference between microhabitats especially regarding the establishment and survival of species. In this sense, we found that part of the differences in composition and species replacement between microhabitat resulted from the species performance, rather than habitat preference.
Although Cadotte and Tucker (2017) highlight the wrong detection of environmental filters for observational data, the analysis of composition (presence/absence) and abundance of species in our study led to the detection of these filters. We do not exclude the possibility of occurrence of biotic interactions and their respective influence in the formation of assemblages, however the analyzed environmental factors were the main responsible by the structure and composition of microhabitats. The environmental gradient usually generates structural and floristic differences at large scale, meantime at finer scales it is possible to detect the action of environmental filters (Vleminckx et al., 2014).
5.CONCLUSION
The observed environmental peculiarities make the “furados” a distinct phytoecological unit within the vast world of Seasonally Dry Tropical Forests -SDTF, which shelter species endemic to the caatinga,
as Spondias tuberosa Arruda., Pereskia bahiensis
Gürke and even undescribed species ( Machaerium sp.). The present study raises our concern for the preservation of SDTF, since the studied fragment is found in a scenario on Northern Minas Gerais – Brazil, weakened by deforestation and neglected regarding environmental issues.
6.ACKNOWLEDGEMENT
The project was supported by FAPEMIG. This article was revised during the discipline Scientific Publication in Ecology, Postgraduate in Applied Ecology, Federal University of Lavras.
7.REFERENCES
Alves JJA. Geoecologia da caatinga no semi-árido do nordeste brasileiro. Climatologia e Estudos da Paisagem. 2007;2(1):58-71.
Botrel RT, Oliveira-Filho AT, Rodrigues LA, Curi N. Influência do solo e topografia sobre as variações da composição florística e estrutura da comunidade arbóreo-arbustiva de uma floresta estacional semidecidual em Ingaí, MG. Revista Brasileira de Botânica. 2002;24(2):195-213.
Brandão M, Gavilanes ML. Elementos arbóreos ocorrentes no Domínio da Caatinga, no Estado de Minas Gerais e seus empregos. Informe
Agropecuário. 1994;17(181):34-42.
Cadotte MW, Tucker CM. Should Environmental Filtering be Abandoned? Trends in Ecology & Evolution. 2017; 32(6):429-437.
Caetano S, Prado D, Pennington RT, Beck S, Oliveira-Filho AT, Spichiger R, et al. The history of Seasonally Dry Tropical Forests in eastern South America: inferences from the genetic structure of the tree Astronium urundeuva
(Anacardiaceae). Molecular Ecology.2008;17(13):3037-222.
Capelo J. Conceitos e métodos da fitossociologia: formulação contemporânea e métodos numéricos de análise da vegetação. Sociedade Portuguesa de Ciências Florestais. 2003. 108p.
Cardoso DBOS, Queiroz LP. Caatinga no contexto de uma metacomunidade: evidências da
biogeografia, padrão filogenéticos e abundância de espécies em Leguminosas. In: Carvalho CJBD, Almeida AB, organizadores. Biogeografia da América do Sul: padrões & processos. São Paulo: Roca; 2011. p.241-60.
DRYFLOR. Plant diversity patterns in neotropical dry forests and their conservation implications. Science. 2016;355(6306):383-1387.
Empresa Brasileira de Pesquisa Agropecuária -Embrapa. 2012. [acessado em: 20 jan. 2017] Disponível em: www.bdclima.cnpm.embrapa.br.
Ernani PR, Almeida JÁ, Santos FC. Potássio. In: Novais RF, Alvarez V VH, Barros NF, Fontes RLF, Cantaretti RB, Neves JCL. editores. Fertilidade do solo. Viçosa, MG: SBCS; 2007. p.551-694.
Felfili J, Nascimento ART, Fagg CW, Meirelles EM. Floristic composition and community structure of a seasonally deciduous forest on limestone outcrops in Central Brazil. Revista Brasileira Botânica. 2007;30(4):611-21.
Giulietti AM, Du Bocage Neta AL, Castro AAJF, Gamarra-Rojas CFL, Sampaio E, Virgínio JF, et al. Analise das variações da biodiversidade do bioma Caatinga. In: Silva JMC, Tabarelli M, Fonseca MT, Lins LV. Biodiversidade da caatinga: áreas e ações prioritárias para a conservação. Brasília, DF: Ministério Meio Ambiente; 2004. p.46-131.
Jardim Botânico do Rio de Janeiro – JBRJ. REFLORA. Lista de Espécies da Flora do Brasil. Rio de Janeiro: 2014. [acessado em: 17 jan. 2017]. Disponível em: http://floradobrasil.jbrj.gov.br/ *Calixto Júnior JY, Drumond MA. Estrutura fitossociológica de um fragmento de caatinga
sensu stricto 30 anos após corte raso,
Petrolina-PE, Brasil. Revista Caatinga. 2011;24(2):67-74.
John R, Dalling JW, Harms KE, Yavitt JB, Stallard RF, Mirabello M, et al. Soil nutrients influence spatial distributions of tropical tree species. Proceedings of the National Academy of Sciences of the United States of America. 2007;4(3):864-9.
Kent M, Coker P. Vegetation description and analysis, a practical approach. London: Belhaven Press; 1992.
Moro MF, Lughadha EN, Araújos FS, Martins FR. A phytogeographical metaanalysis of the semiarid caatinga domain in Brazil. Botanic Review.
2016;82(2):91-148.
Mueller-Dombois D, Ellenberg H. Aims and methods of vegetation ecology. New York: John Wiley & Sons; 1974. 547p.
Oksanen J, Blanchet FG, Kind RT, Legendre P, O’hara RB, Simpson GL, et al. Vegan: Community Ecology Package. R package version 1.17-0. 2010. Available at: http://CRAN.R-project.org/
package=vegan.
Oliveira Filho AT, Curi N, Vilela EA, Carvalho DA. Variation in tree community composition and structure with changes in soil properties within a fragment of semideciduous forest in south-eastern Brazil. Edinburgh Journal of Botany.
2001;58(1):139-58.
Pennington RT, Lavin M, Oliveira-Filho AT. Woody plant diversity, evolution and ecology in the tropics: perspectives from seasonally dry tropical forests. Annual Review of Ecology, Evolution, and Systematics. 2009;40(4):437-57.
Prado DE. As caatingas da América do Sul. In: Leal IR, Tabarelli M, Silva JMC, editores. Ecologia e conservação da caatinga. Recife: Universidade Federal de Pernambuco; 2005. p.3-74.
R Development Core Team. R: A language and environment for statistical computing. R Foundation for Statistical Computing. Vienna: 2015.
Rodal MJN, Martins FR, Sampaio EVSB.
Levantamento quantitativo das plantas lenhosas em trechos de vegetação de Caatinga em
Pernambuco. Revista Caatinga. 2008;21(3):192-205.
Santos RM, Barbosa ACMC, Almeida HS, Vieira FA, Santos PF, Carvalho DA, et al. Estrutura e florística de um remanescente de Caatinga Arbórea em Juvenílha, Norte de Minas Gerais, Brasil. Cerne. 2011;17(2):247-58.
Santos RM, Oliveira-Filho AT, Eisenlohr PV, Cardoso DBOS, Rodal MJN. Identity and relationships of the Arboreal Caatinga among other floristic units of seasonally dry tropical forests (SDTFs) of north-easter n and Central Brazil. Ecology and Evolution. 2012;2(2):409-28.
Santos RM, Vieira FA, Fagundes M, Nunes YRF, Gusmão E. Riqueza e similaridade florística de oito remanescentes florestais no Norte de Minas Gerais, Brasil. Revista Árvore. 2007;31(1):135-44.
Santos RM, Vieira FA, Santos PF, Morais VM, Medeiros MA. Estrutura e florística de um
remanescente florestal na Fazenda Ribeirão, Município de Juvenília, MG, Brasil. Revista Caatinga. 2008;21(4):154-62.
Scolforo JRS, Mello JM. Inventário Florestal. Lavras: UFLA/FAEPE; 1997.
Silva LA, Scariot A. Composição florística e estrutura da comunidade arbórea em uma floresta estacional decidual em afloramento calcário (Fazenda São José, São Domingos, GO, Bacia do Rio Paranã). Acta Botanica Brasílica.
2003;17(2):305-13.
Siqueira AS, Araújo GM, Schiavini I. Estrutura do componente arbóreo e características edáficas de dois fragmentos de floresta estacional decidual no vale do rio Araguari, MG, Brasil. Acta Botanica Brasílica. 2009;23(1):10-21.
Souza VC, Lorenzi H. Botânica sistemática: guia ilustrado para identificação das famílias de Angiospermas da flora brasileira, baseado na APG II. Nova Odessa: Instituto Plantarum; 2005. 640p.
Ter Braak CJF. Canonical correspondence analysis: A new eigenvector technique for multivariate direct gradient analysis. Ecology. 1988;67(5):1167-79.
Vleminckx J, Morin-Rivat J, Biwolé AB, Daïnou K, Gillet JF, Doucet JL, et al. Soil charcoal to assess the impacts of past human disturbances on tropical forests. Plos One. 2014;9(11):108-21.
Whittaker RH. Vegetation of Siskiyou mountains, Oregon and California. Ecological Monographs. 1960;30(3):279-338.