Hydro-physical characterization of soils under tropical semi-deciduous forest
Note
Miguel Cooper1*, Jaqueline Dalla Rosa2, João Carlos Medeiros2, Thalita Campos de Oliveira2, Raul Shiso Toma2, Carlos Eduardo PintoJuhász2,§
ABSTRACT: The study of the hydro-physical behavior in soils using toposequences is of great importance for better understanding the soil, water and vegetation relationships. This study aims to assess the hydro-physical and morphological characterization of soil from a toposequence in Galia, state of São Paulo, Brazil). The plot covers an area of 10.24 ha (320 × 320 m), located in a semi-deciduous seasonal forest. Based on ultra-detailed soil and topographic maps of the area, a representative transect from the soil in the plot was chosen. Five profiles were opened for the morphological description of the soil horizons, and hydro-physical and micromorphologi-cal analyses were performed to characterize the soil. Arenic Haplustult, Arenic Haplustalf and Aquertic Haplustalf were the soil types observed in the plot. The superficial horizons had lower density and greater hydraulic conductivity, porosity and water retention in lower tensions than the deeper horizons. In the sub-superficial horizons, greater water retention at higher tensions and lower hydraulic conductivity were observed, due to structure type and greater clay content. The differences observed in the water retention curves between the sandy E and the clay B horizons were mainly due to the size distribution, shape and type of soil pores.
Keywords: Ultisol, Alfisol, water retention, soil functioning, image analysis
Introduction
The understanding about how soil influences the native vegetation, and vice versa, is fundamental for the definition and characterization of the mechanisms that influence the development and distribution of species in-side a native forest, as well as the determination of their resilience and sustainability. There is a close relationship between local edaphic characteristics and the richness, distribution and variety of forest species (Tersteege et al., 1993; Sabatier et al., 1997; Clark et al., 1999; Gomes et al., 2004). The study of soil functioning and behav-ior associated to the soil-vegetation studies provides a broader panorama of how the natural soil dynamics in-terferes on vegetation.
The inclusion of soil hydrodynamic data in stud-ies of the soil-plant relationships has been suggested by Ruggiero et al. (2002) and used by Oliveira et al. (2005) and Quesada et al. (2004). Soil depth, texture and or-ganic matter content affect water retention in soil (Wall and Heiskanen, 2003). Generally, in the more superficial soil layer, the total porosity is greater and more water is retained in the lower tension points of the soil reten-tion curves, decreasing as it moves down in the profile, information necessary to estimate the water’s movement through the soil profile (Chertkov, 2004).
The soil-forest dynamics studied through water movement along the soil profile is fundamental, because the availability of water in the soil is one of the most important factors for plant growth (Guehl, 1984). Micro-morphological techniques through image analysis could provide useful information about the soil pore system
§In memorian.
Received April 20, 2010
Accepted October 10, 2011
1USP/ESALQ – Depto. de Ciência do Solo, C.P. 09 – 13418-900 – Piracicaba, SP – Brasil. 2USP/ESALQ – Programa de Pós Graduação em Solos e Nutrição de Plantas.
*Corresponding author <[email protected]>
Edited by: José Miguel Reichert
(Castro et al., 2003) and, associated with the soil hydric behavior, help in understanding the soil vs water vs. veg-etation relationship. In this way, it is possible to know the relationships established inside the soil system and how they are involved in and influence the landscape.
The aim of this study is to characterize the soil mor-phology and hydro-physical behavior of a toposequence, in the Caetetus Ecological Station (Galia, SP, Brasil), as-suming that the hydro-physical behavior of the soil is a possible factor that defines the local vegetation type.
Materials and Methods
The study was carried in Gália and Alvinlândia, State of São Paulo, Brazil, between the geographic co-ordinates of 22º41’, 22º46’ S and 49º10’, 49º16’ W and altitudes ranging from 500 and 680 m, in a tropical semi-deciduous mesophytic forest. The climate is classified as Cwa, according to the Köppen classification (1948). The predominant geological formation is sandstone, from Marília and Adamantina formations of the Bauru group. Secondarily, undifferentiated continental and alluvial sediments are found in the region.
analysis. To characterize the toposequences, topographic measurements of altitudes were performed each 5 m. Intermediate points were drilled using an auger between the profiles up to 1.5 m depth, in order to delimit the vertical and lateral transitions between the different soil horizons described in the profiles.
Deformed soil samples were collected from the profiles opened and in each horizon using an auger to determine the following soil attributes: soil particle dis-tribution according to the methodology proposed by Gee and Bauder (1986); particle density according to the methodology described by Vomocil (1965); and soil or-ganic carbon (OC) through oxidation, reducing Cr (III) ions of potassium dichromate with readings using the colorimetric method (Quaggio and Van Raij, 2001).
Non-deformed soil samples were collected in three replicates per soil horizon in each profile opened to de-termine the soil bulk density (BD), porosity and water retention curves. The BD was determined according to the methodology proposed by Blake and Hartge (1986). The evaluated porosities comprised macro, micro and total porosity: soil macroporosity (Mac) was determined using a sand-filled chamber adjusted to 50 cm of tension (Topp and Zebchuk, 1979); total soil porosity (TP) was calculated using soil bulk density and particle density (PD) through the equation proposed by Vomocil (1965). The microporosity (Mic) was obtained by the difference between TP and Mac.
In order to obtain the soil water retention curves, undisturbed samples were saturated and submitted to tensions (1, 3, 5, 8, and 10 kPa) using a sand-filled cham-ber (Topp and Zebchuk, 1979), and the tensions (33, 100, 500, and 1,500 kPa) using a Richards chamber (Klute, 1986). After finishing the drainage in each tension, the water retained in the soil was quantified and the volu-metric moisture was calculated. The adjustments for the soil water retention curves were performed by van Genuchten model (Van Genuchten, 1980), using SWRC software, version 2.00 (Dourado Neto et al., 2000).
The saturated hydraulic conductivity (Ks) in the field was obtained using the Guelph permeameter (Reynolds et al., 1983) in three of the five profiles opened for morpho-logical characterization and soil sampling. Three replicates for each horizon were obtained. To calculate saturated hy-draulic conductivity, the single hyhy-draulic charge equation proposed by Elrick et al. (1989) was applied.
For image analysis, undisturbed soil cores were collected in each horizon described in the profiles. These samples were first air dried and subsequently dried in an oven at 40 °C until constant mass. After-wards, samples were impregnated with a polyester resin (Murphy, 1986), styrene monomer (Castro et al., 2003), a catalyzer (Ringrose-Voase, 1991) and a fluo-rescent pigment (Murphy et al., 1977). To increase the impregnation efficiency and facilitate resin penetration in the soil, a vacuum system was used (Castro et al., 2003). Once hardened, the impregnated cores were cut and one of the faces was polished.
The area occupied by pores and the pore shape were obtained from the image analysis of each impreg-nated core, according to the two form indexes described by Cooper and Vidal-Torrado (2005). Pores were quanti-fied from the images acquired on the polished faces of the impregnated cores. Fourteen random images (photo-micrographs) were taken by a color digital camera. Pores were segregated by manual grayscale thresholds for each set of images and viewed in two dimensions. Once acquired, the image was binarized and the pores were individualized using Noesis® Visilog 5.4 image analy-sis software. The shape of the pores was classified as rounded, elongated and complex, and the size as small, medium and large.
Results and Discussion
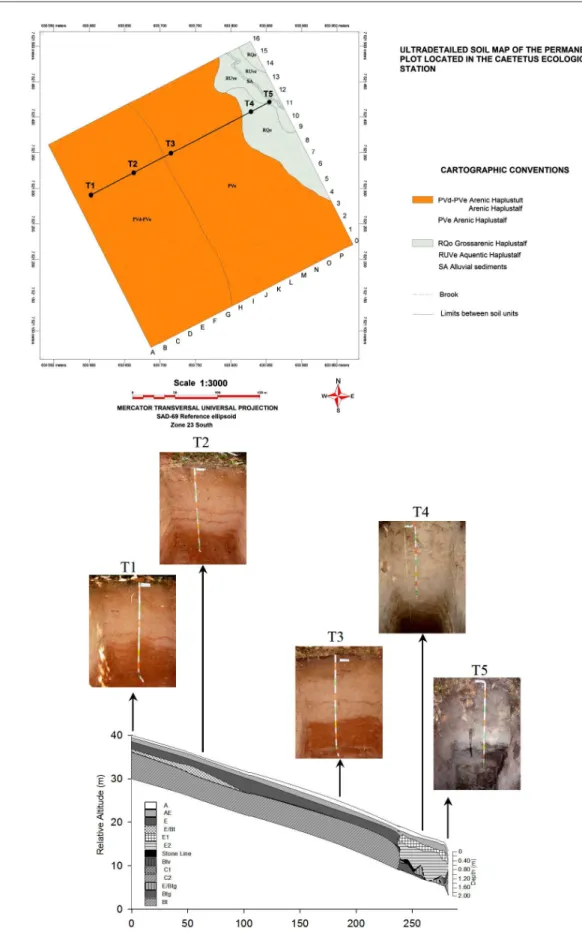
The permanent plot of the Caetetus Ecological Station is occupied by a semi-deciduous mesophytic for-est, which develops over Arenic Haplustults and Arenic Haplustalfs as well as Aquertic Haplustalfs. The Arenic Haplustults and Arenic Hapustalfs occur on hilly land-scapes with altitudes ranging from 564 to 550 m, and the Aquertic Haplustalfs are associated with a floodplain of a first-order channel which runs parallel to the north-westhern side of the permanent plot.
According to the American Soil Classification Sys-tem (Soil Survey Staff, 2010) the soils of the profiles in the transect studied were classified as Arenic Haplustults (T1), Arenic Haplustalfs (T2), Arenic Haplustalfs (T3), Grossarenic Haplustalfs (T4), and Aquertic Haplustalfs (T5) (Figure 1 and Table 1).
The soils of the plot had lateral and vertical hetero-geneity among horizons, where the texture and structure were the main attributes responsible for the heterogene-ity. The transect had two very distinct compartments. One compartment occupies the summit, shoulder and backslope positions, where well-drained soils predomi-nate (Arenic Haplustult and Arenic Haplustalf). Soils on this compartment are characterized by an abruptic textural gradient, showing poorly structured horizons with loamy sand to sandy texture up to depths of 1.0 m. Directly below are well structured horizons with loamy clay texture. The second compartment occupies the toeslope (Grossarenic and Aquentic Haplustalfs), where the soils present drainage restrictions in the deeper ho-rizons. These soils also have an abrupt textural gradi-ent between the superficial and sub-superficial horizons (Figure 1 and Table 1). The distribution of soils along the slope and the horizon morphological attributes deter-mine the hydro-physical functioning of the soils and the toposequence, as discussed below.
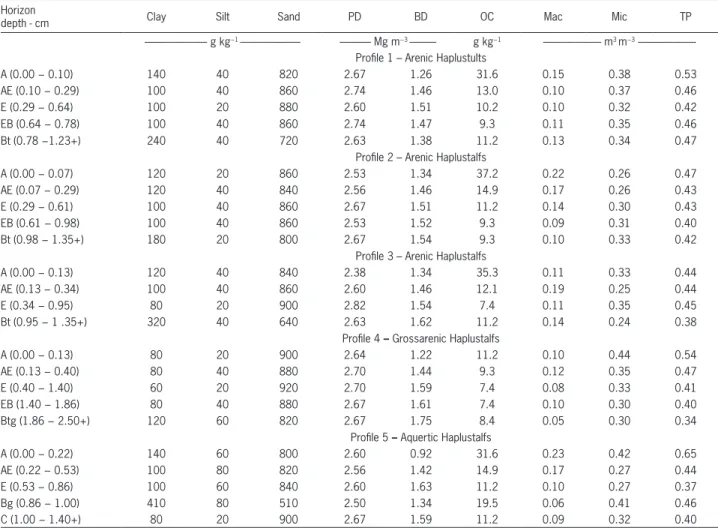
The BD of the Arenic Haplustults and Arenic Hap-lustalfs ranged from de 1.22 to 1.75 Mg m−3, and in the
Grossarenic and Aquentic Haplustalfs from 0.92 to 1.63 Mg m−3 (Table 2). As expected, an increase in the BD of
in the morphological descriptions were observed. In the profiles with abruptic textural gradients, the differenc-es of the density and porosity were more pronounced. The higher BD values observed in the E horizons were mainly related to the quartz dominance in the sand frac-tion, with no aggregation and lower TP. The low BD val-ues observed in all superficial horizons were related to greater organic carbon content and TP (Godefroy and Joacquin, 1975; Araújo et al., 2004).
The PD had similar values in all of the topose-quence, ranging from 2.38 to 2.70 Mg m−3 (Table 2), this
occurred due to the similar constitution of the soil par-ticles in these soils. The soil Mac ranged from 0.05 to 0.22 m3 m−3 in the Arenic Haplustults and Arenic
Hap-lustalfs, and from 0.06 to 0.23 m3 m−3 in the Grossarenic
and Aquentic Haplustalfs (Table 2), with greater values observed in the soil surface horizons. These values re-sulted from the better soil structure in the more super-ficial layers of this native forest, caused by the input of organic matter and greater biological activity. The same tendency occurred for the Mic, which varied from 0.44 to 0.24 m3 m−3 in the Arenic Haplustults and Arenic
Haplustalfs and 0.42 to 0.27 m3 m−3 in the Grossarenic
and Aquentic Haplustalfs. The TP was greater in the A
horizon in all profiles, ranging from 0.65 to 0.44 m3 m−3.
This was also related to a better organization of soil par-ticles and to high levels of OC, ranging from 37.2 to 11.2 g kg−1 (Table 2).
The soil water retention curves of the profiles demonstrated the influence of the soil’s textural and structural attributes. There was a clear differentiation between the sandy superficial horizons and the clayey sub-superficial horizons (Figure 2). In all of the profiles studied, the volumetric moisture determined in each of the measured tensions was greater in the B horizon (deepest horizon) when compared to the other horizons. This corroborated the findings of Wall and Heiskanen (2003), who stated that soil depth and texture, beyond organic matter content, affect significantly water reten-tion. For each tension measured, the denser horizons retain greater volume of water than the other horizons analyzed, even when the soil was close to the perma-nent wilting point.
Moreover the water retention curves of the sandy horizons demonstrated good conduction proprieties, which was evidenced by the high moisture volume in the lowest potentials, it retained very little water in ten-sions closer to the permanent wilting point (1500 kPa).
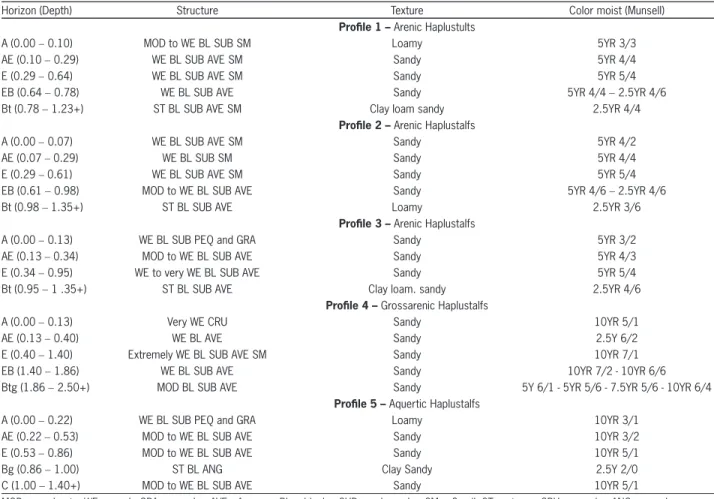
Table 1 – Soil morphological description, for the studied profiles of the Caetetus Ecological Station (Gália, SP, Brazil).
Horizon (Depth) Structure Texture Color moist (Munsell)
Profile 1 – Arenic Haplustults
A (0.00 − 0.10) MOD to WE BL SUB SM Loamy 5YR 3/3
AE (0.10 − 0.29) WE BL SUB AVE SM Sandy 5YR 4/4
E (0.29 − 0.64) WE BL SUB AVE SM Sandy 5YR 5/4
EB (0.64 − 0.78) WE BL SUB AVE Sandy 5YR 4/4 − 2.5YR 4/6
Bt (0.78 − 1.23+) ST BL SUB AVE SM Clay loam sandy 2.5YR 4/4
Profile 2 – Arenic Haplustalfs
A (0.00 − 0.07) WE BL SUB AVE SM Sandy 5YR 4/2
AE (0.07 − 0.29) WE BL SUB SM Sandy 5YR 4/4
E (0.29 − 0.61) WE BL SUB AVE SM Sandy 5YR 5/4
EB (0.61 − 0.98) MOD to WE BL SUB AVE Sandy 5YR 4/6 − 2.5YR 4/6
Bt (0.98 −1.35+) ST BL SUB AVE Loamy 2.5YR 3/6
Profile 3 – Arenic Haplustalfs
A (0.00 − 0.13) WE BL SUB PEQ and GRA Sandy 5YR 3/2
AE (0.13 − 0.34) MOD to WE BL SUB AVE Sandy 5YR 4/3
E (0.34 − 0.95) WE to very WE BL SUB AVE Sandy 5YR 5/4
Bt (0.95 − 1 .35+) ST BL SUB AVE Clay loam. sandy 2.5YR 4/6
Profile 4 – Grossarenic Haplustalfs
A (0.00 − 0.13) Very WE CRU Sandy 10YR 5/1
AE (0.13 − 0.40) WE BL AVE Sandy 2.5Y 6/2
E (0.40 − 1.40) Extremely WE BL SUB AVE SM Sandy 10YR 7/1
EB (1.40 − 1.86) WE BL SUB AVE Sandy 10YR 7/2 - 10YR 6/6
Btg (1.86 − 2.50+) MOD BL SUB AVE Sandy 5Y 6/1 - 5YR 5/6 - 7.5YR 5/6 - 10YR 6/4
Profile 5 – Aquertic Haplustalfs
A (0.00 − 0.22) WE BL SUB PEQ and GRA Loamy 10YR 3/1
AE (0.22 − 0.53) MOD to WE BL SUB AVE Sandy 10YR 3/2
E (0.53 − 0.86) MOD to WE BL SUB AVE Sandy 10YR 5/1
Bg (0.86 − 1.00) ST BL ANG Clay Sandy 2.5Y 2/0
C (1.00 − 1.40+) MOD to WE BL SUB AVE Sandy 10YR 5/1
Table 2 –Soils physical attributes for the studied profiles of the Caetetus Ecological Station (Gália, SP, Brazil). Horizon
depth - cm Clay Silt Sand PD BD OC Mac Mic TP
--- g kg−1 --- --- Mg m−3 --- g kg−1 --- m3 m−3 ---Profile 1 – Arenic Haplustults
A (0.00 − 0.10) 140 40 820 2.67 1.26 31.6 0.15 0.38 0.53
AE (0.10 − 0.29) 100 40 860 2.74 1.46 13.0 0.10 0.37 0.46
E (0.29 − 0.64) 100 20 880 2.60 1.51 10.2 0.10 0.32 0.42
EB (0.64 − 0.78) 100 40 860 2.74 1.47 9.3 0.11 0.35 0.46
Bt (0.78 −1.23+) 240 40 720 2.63 1.38 11.2 0.13 0.34 0.47
Profile 2 – Arenic Haplustalfs
A (0.00 − 0.07) 120 20 860 2.53 1.34 37.2 0.22 0.26 0.47
AE (0.07 − 0.29) 120 40 840 2.56 1.46 14.9 0.17 0.26 0.43
E (0.29 − 0.61) 100 40 860 2.67 1.51 11.2 0.14 0.30 0.43
EB (0.61 − 0.98) 100 40 860 2.53 1.52 9.3 0.09 0.31 0.40
Bt (0.98 − 1.35+) 180 20 800 2.67 1.54 9.3 0.10 0.33 0.42
Profile 3 – Arenic Haplustalfs
A (0.00 − 0.13) 120 40 840 2.38 1.34 35.3 0.11 0.33 0.44
AE (0.13 − 0.34) 100 40 860 2.60 1.46 12.1 0.19 0.25 0.44
E (0.34 − 0.95) 80 20 900 2.82 1.54 7.4 0.11 0.35 0.45
Bt (0.95 − 1 .35+) 320 40 640 2.63 1.62 11.2 0.14 0.24 0.38
Profile 4 – Grossarenic Haplustalfs
A (0.00 − 0.13) 80 20 900 2.64 1.22 11.2 0.10 0.44 0.54
AE (0.13 − 0.40) 80 40 880 2.70 1.44 9.3 0.12 0.35 0.47
E (0.40 − 1.40) 60 20 920 2.70 1.59 7.4 0.08 0.33 0.41
EB (1.40 − 1.86) 80 40 880 2.67 1.61 7.4 0.10 0.30 0.40
Btg (1.86 − 2.50+) 120 60 820 2.67 1.75 8.4 0.05 0.30 0.34
Profile 5 – Aquertic Haplustalfs
A (0.00 − 0.22) 140 60 800 2.60 0.92 31.6 0.23 0.42 0.65
AE (0.22 − 0.53) 100 80 820 2.56 1.42 14.9 0.17 0.27 0.44
E (0.53 − 0.86) 100 60 840 2.60 1.63 11.2 0.10 0.27 0.37
Bg (0.86 − 1.00) 410 80 510 2.50 1.34 19.5 0.06 0.41 0.46
C (1.00 − 1.40+) 80 20 900 2.67 1.59 11.2 0.09 0.32 0.40
PD = particle density; BD = soil density; OC = organic carbon; Mac = macroporosity; Mic =microporosity; TP = total porosity.
Figure 3 – Saturated hydraulic conductivity (Ks) of the main soil horizons of soils of the Caetetus Ecological Station (Gália, SP, Brazil) (profiles 2, 4 and 5, mean and standard deviation).
The differences observed in the behavior of the water retention curve between the sandy E horizon and the clay B horizon were mainly due to the pore size, type and shape. In the sandy horizons, there was dominance of macropores over micropores, which facilitate the drainage. In the more clay-filled B horizon, a balanced distribution between macropores and micropores exists, which favors water retention. This emphasizes the im-portance of the B horizon in these soils, which acts as the major water storage medium for plants.
The superficial horizons in all of the transect seg-ments had higher Ks when compared to the sub-super-ficial horizons (Figure 3). As previously observed for the soil water retention curves, the Ks of these horizons can also be related to the morphological organization, as well as the soil particle size distribution, which pro-vides a high macroporosity in the surface. The macrop-orosity influences the water flow in the soil, so, high hydraulic conductivity was evidenced in oxic horizons by the high amount of pedotubules (biopores) (Glinski and Lipiec, 1990). These morphological and textural at-tributes influence the distribution and morphology of the pores, and consequently the hydraulic conductivity. Thus, in the horizons that had less developed aggregates and sandy texture with a dominance of interconnected macropores, the hydraulic conductivity is higher. The Ks is reduced when the structure is more developed (subangular blocks), with a clayey texture and smaller and less connected pores, as observed in the sub-super-ficial soils (Figure 3).
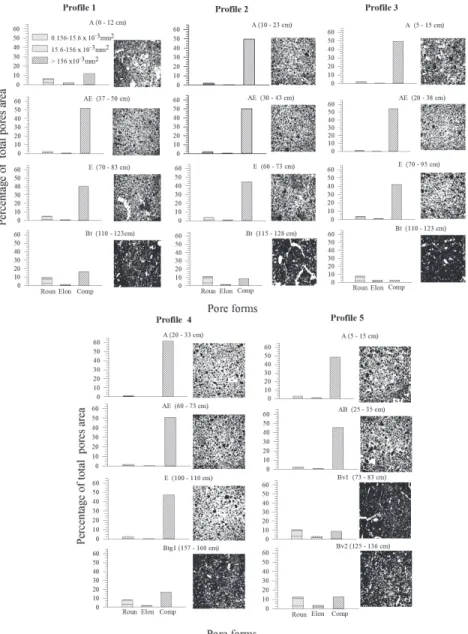
Image analysis showed an abrupt transition in the total porosity between the superficial horizons (A + E) and the sub-superficial horizons (B) (Figure 4). The abrupt modification in the total porosity was mainly due to the changes in the texture and structure of these horizons. These changes, besides changing the total porosity, also modified the morphology of the pores. The dominant porosity in the superficial horizons (A, E and EB) is made up of large irregular pores (drain-age pores), while in deeper horizons (Bt, Btg and Bg), a greater balance prevails among the types of pores (Fig-ure 4). These are characterized by a drastic reduction of large irregular pores and an increasing of rounded medium and small pores, with a few elongated pores (retention pores), and was observed between the E and Bt horizons in all profiles. Complex pores still repre-sent almost half of the total porosity of the B horizon, while the other half is represented by the elongated and rounded pores.
The distribution of the pore forms in the B horizon demonstrated good conduction and retention proprieties in this horizon, as also reported by Cooper and Vidal-Torrado (2005) in Bw horizons, due to the greater de-velopment of complex pores in this horizon. The domi-nance of complex macropores in the A and E horizons could explain the typical form of the water retention curve in these horizons, that favor the conduction but not the water retention.
Conclusions
The toposequence study demonstrated the domi-nance of well developed and relatively deep soils. The superficial horizons had lower density and greater hy-draulic conductivity, porosity and water retention in lower tensions when compared to deeper horizons. The sub-superficial horizons presented greater water reten-tion at higher tensions and lesser hydraulic conductivity due to structure type and greater clay content.
Acknowledgements
This work was supported/financed by the São Pau-lo Research Foundation (FAPESP) as part of the BIOTA / FAPESP Program - The Virtual Institute of Biodiversity. The authors also thank André Oppitz Ketzer, Rodrigo Chiara Olsen, Dorival Grisotto and Valter Novais for their aid in the fieldwork.
References
Blake, G.R.; Hartge, K.H. 1986. Bulk density. p. 363–375. In: Klute. A., ed. Methods of soil analysis, physical and mineralogical methods. ASA, Madison, WI, USA.
Boulet, R.; Chauvel, A.; Humbel, F.X.; Lucas, Y. 1982. Structural analysis and cartography in pedology. I. Considering the two-dimensional organization of the soil: toposequence studies and their contributions to the knowledge of soils. Cahiers Orstom Séries Pédologie 19: 309–321 (in French).
Castro, S.S.; Cooper, M.; Santos, M.C.; Vidal Torrado, P. 2003. Soil micromorphology: concepts and applications. Topics in
Soil Science3: 107–164 (in Portuguese).
Chertkov, V.Y. 2004. A physically based model for the water retention curve of clay pastes. Journal of Hydrology 286: 203–226. Clark, D.B.; Palmer, M.W.; Clark, D.A. 1999. Edaphic factors and
the landscape-scale distributions of tropical rain forest trees. Ecology 80: 2662–2675.
Cooper, M.; Vidal-Torrado, P. 2005. Morphological,
micromorphological and hydro-physical characterization of soils with a nitic B horizon. Revista Brasileira de Ciência do Solo 29: 581–595 (in Portuguese, with abstract in English). Dourado Neto, D.; Nielsen, D.R.; Hopmans, J.W.; Reichardt, K.;
Bacchi, O.O.S. 2000. Software to model soil water retention curves (SWRC, version 2.00). Scientia Agricola 57: 191–200. Elrick, D.E.; Reynolds, W.D.; Tan, K.A. 1989. Hydraulic
conductivity measurements in the unsatured zone using improved well analyses. Ground Water Monitoring & Remediation 9: 184–193.
Gee, G.W.; Bauder, J.W. 1986. Particle size analysis. p. 383–411. In: Klute, A., ed. Methods of soil analysis. 2ed. ASA, Madison, WI, USA.
Glinski, J.; Lipiec, J. 1990. Soil physical conditions and plant roots. CRC Press, Boca Raton, FL, USA.
Gomes, J.B.V.; Curi, N.; Motta, P.E.F.; Ker, J.C.; Marques, J.J.G.S.M.; Schulze, D.G. 2004. Principal component analysis of physical, chemical, and mineralogical attributes of the cerrado biome soils. Revista Brasileira de Ciência do Solo 28: 137–153 (in Portuguese, with abstract in English).
Guehl, J.M. 1984. Soil water dynamics in humid tropical forests of Guyana. Influence of the soil. Annales des Sciences Forestieres 41: 195–236 (in French).
Klute, A. 1986. Water retention: laboratory methods. p. 635– 662. In: Klute, A., ed. Methods of soil analysis: physical and mineralogical methods. 2ed. ASA, Madison, WI, USA. Köppen, W. 1948. Climatology: A Study of the Climates of the
Earth. Fondo de Cultura Econômica, Mexico City, México. (in Spanish).
Lemos, R.C.; Santos, R.D. 2002. Field Soil Sampling and Description Manual. 4ed. Brazilian Society of Soil Science, Viçosa, MG, Brazil. (in Portuguese).
Murphy, C.P. 1986. Thin section preparation of soils and sediments.A.B. Academic, Berkhamsted, UK.
Murphy, C.P.; Bullock, P.; Turner, R.H. 1977. The measurement and characterization of voids in soil thin sections by image analysis. I. Principles and techniques. Soil Science 28: 498–508.
Oliveira, R.S.; Bezerra, L.; Davidson, E.A.; Pinto, F.; Klink, C.A.; Nepstad, D.C.; Moreira, A. 2005. Deep root function in soil water dynamics in cerrado savannas of central Brazil. Functional Ecology 19: 574–581.
Quaggio, J.A.; Van Raij, B. 2001. Determination of pH in calcium chloride and total acidity. p. 173–180. In: Raij, B.V.; Andrade, J.C.; Cantarella, H.; Quaggio, J.A., ed. Chemical analysis for assessing the fertility of tropical soils. IAC, Campinas, SP, Brazil. (in Portuguese).
Quesada, C.A.; Miranda, A.C.; Hodnett, M.G.; Santos, A.J.B.; Miranda, H.S.; Breyer, L.M. 2004. Seasonal and depth variation of soil moisture in a burned open savanna (campo sujo) in central Brazil. Ecological Applications 14: 33–41.
Reynolds, W.D.; Elrick, D.E.; Topp, G.C. 1983. A reexamination of the constant head well permeameter method for measuring saturated hydraulic conductivity above the water table. Soil Science 136: 250–268.
Ringrose-Voase, A.J. 1991. Micromorphology of soil structure: description, quantification, application. Australian Journal of Soil Research 29: 777–813.
Ruggiero, P.G.C.; Batalha, M.A.; Pivello, V.R.; Meirelles, S.T. 2002. Soil-vegetation relationships in cerrado (Brazilian Savanna) and semideciduous forest. Southeastern Brazil. Plant Ecology 160: 1–16.
Sabatier, D.; Grimaldi, M.; Prévost, M.F.; Guillaume, J.; Godron, M.; Dosso, M.; Curmi, P. 1997. The influence of soil cover organization on the floristic and structural heterogeneity of a Guianan rain forest. Plant Ecology 131: 81–108.
Soil Survey Staff. 2010. Keys to Soil Taxonomy. 11ed. USDA/ NRCS, Washington, DC, USA.
Tersteege, H.; Jetten, V.G.; Polak, A.M.; Werger, M.J.A. 1993. Tropical rain-forest types and soil factors in a watershed area in Guyana. Journal of Vegetable Science 4: 705–716.
Topp, G.C.; Zebchuk, W. 1979. The determination of soil water desorption curves for soil cores. Canadian Journal of Soil Science 59: 19–26.
Van Genuchten, M.T. 1980. A closed-form equation for predicting the hydraulic conductivity of unsaturated soils. Soil Science Society of America Journal 44: 892–898.
Vomocil, J.A. 1965. Porosity. p. 299–314. In: Black, C.A., ed. Methods of soil analysis. ASA, Madison, WI, USA.