GENETIC DIVERSITY OF CULTIVATED
Coffea arabica
INBRED LINES ASSESSED BY RAPD, AFLP AND
SSR MARKER SYSTEMS
Mirian Perez Maluf1*; Milene Silvestrini2; Luciana Machado de Campos Ruggiero2; Oliveiro Guerreiro Filho2; Carlos Augusto Colombo3
1
Embrapa Café, Av. Barão de Itapura, 1481 - 13001-970 - Campinas, SP - Brasil. 2
IAC - Centro de Café “Alcides Carvalho” - 13001-970 - Campinas, SP - Brasil. 3
IAC - Centro de Recursos Genéticos Vegetais. *Corresponding author <[email protected]>
ABSTRACT: One of the greatest problems in Coffea arabica breeding is identifying precisely any inbred line, based only on botanical and agronomical descriptors, because of the reduced genetic variability of the species, close pedigree origin, which results in small phenotypic variation. Recently, molecular markers have been used for plant germplasm characterization and identification in several commercial species. This work evaluates the reliability of three marker systems: RAPD, AFLP and SSR, to characterize the genetic variability of commercially-used Coffea inbred lines developed by the Instituto Agronômico (IAC), and their potential for cultivar identification. All methods identified polymorphisms among the cultivars. The genetic diversity recognized by the methods is very similar, although is very narrow. RAPD and SSR marker systems grouped more efficiently the evaluated cultivars according to parental origin. None of the methods allowed inbred line identification. Therefore for varietal protection, it would be necessary using a combination of botanical, agronomical and molecular markers descriptors for precise cultivar identification.
Key words: coffee, cultivar identification, molecular markers
CARACTERIZAÇÃO DA DIVERSIDADE GENÉTICA DE
LINHAGENS COMERCIAIS DE
Coffea arabica
ATRAVÉS DE
MARCADORES MOLECULARES DO TIPO RAPD, AFLP E SSR
RESUMO: A identificação de linhagens de Coffea arabica a partir de descritores botânicos e agronômicos é um problema para o desenvolvimento de cultivares. Basicamente, a limitada variação fenotípica observada em cultivares é o resultado de uma estreita variabilidade genética em C. arabica associada com uma origem genealógica próxima. Recentemente, os uso de marcadores moleculares tem contribuído para a caracterização e identificação de várias espécies de interesse comercial. O objetivo deste trabalho foi comparar a confiabilidade de três tipos de marcadores moleculares, RAPD, AFLP e SSR, para a caracterização da variabilidade genética e uma possível identificação de linhagens comerciais de Coffea desenvolvidas pelo IAC. Os métodos avaliados permitiram identificar polimorfismos entre cultivares. A variabilidade genética detectada por eles é muito semelhante, ainda que reduzida. Marcadores do tipo RAPD e SSR foram mais eficientes em análises de parentesco, e o agrupamento das linhagens correspondeu à sua origem genealógica. No entanto, nenhum dos métodos testados permitiu a identificação individual de linhagens. Neste caso, a utilização conjunta de descritores botânicos, agronômicos e marcadores moleculares é recomendada para a identificação precisa de linhagens, visando processos de proteção legal de cultivares de Coffea.
Palavras-chave: café, identificação de cultivares, marcadores moleculares
INTRODUCTION
The genus Coffea contains the two main commer-cially cultivated coffee species, Coffea arabica and
Coffea canephora. Several agronomic and technological differences between these two species are responsible for their individual market value.
The Coffea germplasm collection of IAC includes selected commercial lines of C. arabica and C. canephora
that are under continuous characterization regarding
botanic, agronomic, and technologic aspects (Carvalho et al., 1991; Aguiar, 2001). These analysis can detect sig-nificant agronomic differences among cultivars (Aguiar, 2001).
Justifications for this low variability include narrow ge-netic basis, reproduction system and the fact that a small number of coffee plants were introduced for cultivation in producing countries.
Even though the inbred lines selected by the IAC Breeding Program are well known and thoroughly evalu-ated, individual and precise identification cannot be achieved using only traditional descriptors (Aguiar, 2001). New legislation on commercial exploitation of ge-netic resources requires correct cultivar identification for both legal protection and intellectual property require-ments. Therefore, in this work, molecular markers were used as tools for germplasm evaluation, targeting the analysis of the genetic diversity of cultivated coffee lines, and the identification of cultivar specific markers. The most common methods for generating molecular mark-ers were tested in selected coffee germplasm, and com-pared regarding their ability to access genetic polymor-phisms and identifying genetic relationship among culti-vars.
MATERIAL AND METHODS
Plant material
Inbred lines of C. arabica developed by the Coffee Breeding Program of the Agronomic Institute (IAC) were selected for analysis with molecular mark-ers. All lines are commercially planted all over Brazil-ian coffee producing regions. A complete list of inbred coffee germplasm evaluated in this work, with respective pedigree data, is present in Table 1. Young leaves were collected from plants of each cultivar, fro-zen in liquid N2, and kept at –80°C until used. C. canephora cultivar Apoatã was used as outgroup acces-sion.
Genomic DNA extraction
Total genomic DNA was extracted from frozen young leaves according to Orozco-Castillo et al. (1994), using MATB (lauryl-trimethyl-ammonium bromide) as detergent. Whenever fresh-collected leaves were used, DNA was extracted using activated charcoal during
tis-Table 1 - List of Coffea germplasm evaluated.
r a v i t l u
C Species Inbred line Origin á
i a c
A Coffeaarabica AC 474-4 BourbonVermelho× Sumatra (Typica) á
i a c
A Coffeaarabica AC 474-19 BourbonVermelho× Sumatra (Typica) o
v o N o d n u
M Coffeaarabica MN388-17 BourbonVermelho× Sumatra (Typica) o
v o N o d n u
M Coffeaarabica MN379-19 BourbonVermelho× Sumatra (Typica) o
v o N o d n u
M Coffeaarabica MN505 BourbonVermelho× Sumatra (Typica) o
v o N o d n u
M Coffeaarabica MN515 BourbonVermelho× Sumatra (Typica) o
l e r a m A n o b r u o
B Coffeaarabica BA9 BourbonVermelho(mutation) o
h l e m r e V í a u t a
C Coffeaarabica CV44 CatuaíAmarelo476× MundoNovo374-19 o
h l e m r e V í a u t a
C Coffeaarabica CV46 CatuaíAmarelo476× MundoNovo374-19 o
h l e m r e V í a u t a
C Coffeaarabica CV144 CatuaíAmarelo476× MundoNovo374-19 o
h l e m r e V í a u t a
C Coffeaarabica CV99 CatuaíAmarelo476× MundoNovo374-19 o
h l e m r e V í a u t a
C Coffeaarabica CV81 CatuaíAmarelo476× MundoNovo374-19 o
l e r a m A í a u t a
C Coffeaarabica CA86 CatuaíAmarelo476× MundoNovo374-19 o
l e r a m A í a u t a
C Coffeaarabica CA62 CatuaíAmarelo476× MundoNovo374-19 o
l e r a m A í a u t a
C Coffeaarabica CA74 CatuaíAmarelo476× MundoNovo374-19 o
l e r a m A í a u t a
C Coffeaarabica CA47 CatuaíAmarelo476× MundoNovo374-19 o
l e r a m A í a u t a
C Coffeaarabica CA100 CatuaíAmarelo476× MundoNovo374-19 e
c o c e r P u t a c
I Coffeaarabica IP3282 SelectionofIcatuVermelho o
h l e m r e V u t a c
I Coffeaarabica IV2945 (C. canephora cvRobusta× BourbonVermelho)× Mundo Novo o
h l e m r e V u t a c
I Coffeaarabica IV4040 (C. canephora cvRobusta× BourbonVermelho)× Mundo Novo o
h l e m r e V u t a c
I Coffeaarabica IV4042 (C. canephora cvRobusta× BourbonVermelho)× Mundo Novo o
h l e m r e V u t a c
I Coffeaarabica IV4045 (C. canephora cvRobusta× BourbonVermelho)× Mundo Novo o
h l e m r e V u t a c
I Coffeaarabica IV4046 (C. canephora cvRobusta× BourbonVermelho)× Mundo Novo o
l e r a m A u t a c
I Coffeaarabica IA2944 IcatuVermelho× BourbonAmarelo ã
t a b
O Coffeaarabica OB (Villa Sarchi× Hybrid ofTimor)× CatuaíVermelho i
p u
T Coffeaarabica TP (Villa Sarchi× Hybrid ofTimor)× CatuaíVermelho e
d r e V o r u
O Coffeaarabica OV CatuaíAmarelo× MundoNovo515 ã
t a o p
sue grinding, as described by Vroh et al. (1996). All DNA samples were diluted to a final concentration of 20 ng µL-1.
RAPD
A total of 40 ng of each DNA sample was used in PCR reactions for RAPD markers amplification. Ran-dom, commercial 10-mer oligonucleotides from Operon Technology, kits A, G, H and X were used. PCR reac-tions were set as follows in a final volume of 25 µL: 0.1 mmol L-1
dNTP, 2 mmol L-1
MgCl2, 0.5 µmol L-1 primer, 1X reaction buffer (10 mmol L-1 TRIS-HCl and 50 mmol L-1 KCl) e 0.25 U Taq polymerase. Samples were submitted to 45 cycles under the following condi-tions: 1 min at 94°C, 45 s at 35°C and 1.5 min at 72°C. Amplified fragments were separated according to size on 1.5% agarose gel, and stained with ethidium bromide. Gel documentation and fragment size determination were per-formed by the software Image Master Total Lab (Pharmacia).
AFLP
AFLP marker analysis was performed according to Vos et al. (1995). Amplified fragments were obtained using a multi-color fluorescent primers AFLP kit (Applied Biosystems), which allows a total of 64 primer combina-tions. All combinations were tested in selected genotypes, and only those that amplified polimorphic fragments were used in all genotypes. Reaction conditions were per-formed as recommended by the manufacter’s manual, with some modifications. Digestion with restriction en-zymes was performed using 280 ng of total DNA. After adapters ligation, digested DNA was diluted to a final concentration of 50 ng µL-1. Samples were submitted to 23 cycles of pre-amplification reaction in the following conditions: 30 s at 94°C, 1 min at 56°C and 1 min at 72°C. Selective amplification reactions were: pre-amplified frag-ments were diluted 1:30, mixed with 1 mmol L-1 of EcoRI
and MseI primers, 1 mmol L-1 of dNTP, 1X reaction buffer, 5 U of Taq polimerase and 2 mmol L-1 of MgCl2. Reac-tion condiReac-tions followed manual’s recommendaReac-tions am-plified products were separated on 5% acrylamide gel us-ing an ABI 377 automated sequencer (Applied Biosystems). Products were detected by the software Gene Scan (Applied Biosystems) using internal molecular size markers (GENESCAN-500 ROX). Polymorphisms were evaluated by Genotyper v 2.0 software (Applied Biosystems). Restriction parameters for polymorphism identification were defined based on overall amplification quality, and for final analysis only peaks that met the fol-lowing pattern were selected: absorbance of 100 Abs; size between 100 – 450 bp; size tolerance of ± 5 bp.
SSR
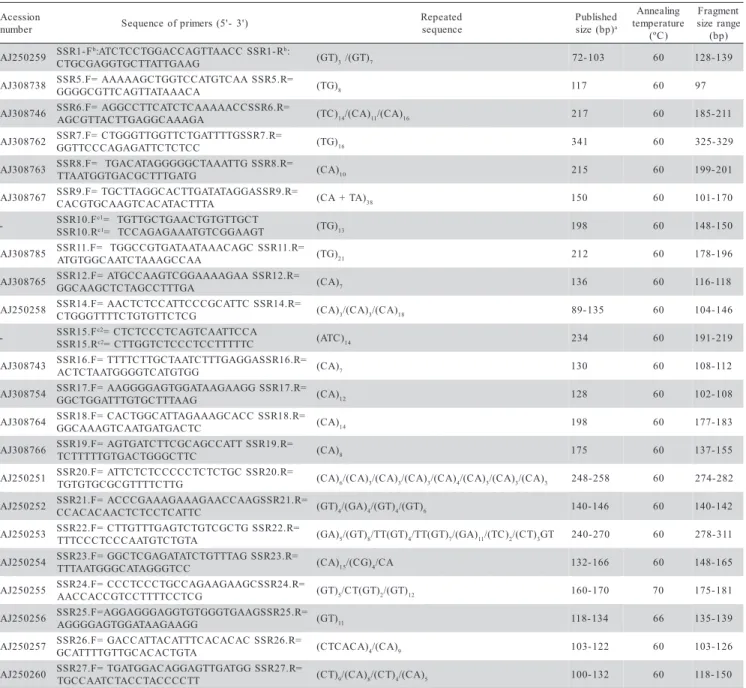
The primers to amplify SSR locus were synthe-sized based on sequences described in Combes et al.
(2000) and Rovelli et al. (2000) (Table 2). The primer pair SSR1 was designed by our lab using the software Primer Designer V 2.0 (Scientific & Educational Software). A total of 23 microsatellite locus were evaluated, corre-sponding to repetitions of (TG)n, (TA)n, (CA)n and (ATC)n. Final reaction conditions were 40 ng of genomic DNA, 1X reaction buffer, 0.2 mmol L-1 of dNTP, 2 mmol L-1 of MgCl2, 5 rmoles of each primer and 1.25 U of Taq
polimerase. The complete thermal cycle program was 5 min at 95°C, followed by 30 cycles of 1 min at 95°C, 1 min at 60°C and 1 min at 72°C, and a final 5 min of elongation at 72°C, except for loci SSR24 and SSR25, for what annealing temperature was 70°C and 66°C, re-spectively. The amplified products were labeled by direct incorporation of fluorescent nucleotides during PCR re-action (Rhodes et al., 1997; Jouquand et al., 1999). The nucleotide [F]dNTP [Tamra] dCTP-yellow (PE Applied Biosystems) was used because of system compatibility. The proportion of fluorescent to non-fluorescent nucle-otide was 1:100. To maximize product, non-incorporated nucleotides were eliminated by precipitation of PCR samples with isopropanol, and then ressuspended in 1.25 mL of formamide and blue dextran buffer, and 0.25
µL of TAMRA 500 (PE Applied Biosystems). Fluorescent-amplified products were separated on 5% acrylamide gel by ABI 377 automated sequencer (Applied Biosystems). Products were detected by Gene Scan software (Applied Biosystems) using internal molecular size markers (GENESCAN-500 ROX), and amplified loci were evalu-ated using Genotyper v 2.0 software (Applied Biosystems).
Data analysis
The gels were scored for the presence or absence of amplified fragments. Although microsatellites are co-dominant markers, molecular analyses of SSR loci were performed based on presence/absence of amplified fragments because of the allotetraploid nature of C. arabica.
For a comparative analysis among the methods, genetic parameters such as average number of alleles per locus, allele frequency (pi), expected heterozygosity (H), effective number of alleles per locus (ne) were calculated as described by Morgante et al. (1994): ne = (Σpi2)-1 and H = h= 1- Σpi2
. (N/N-1), where N is the sample size (number of cultivars evaluated). This measure takes into account both number and frequency of alleles. An as-say efficiency index (Ai) was calculated for each method, which combining the total effective number of alleles identified (Ne = Σnei) and the number of assays performed for their detection (P), as Ai = Ne/P (Morgante et al., 1994).
Cluster analysis was performed on the matrix distance using the clustering UPGMA criterion; the bootstrap method (Felsenstein, 1985) was used to evaluate the tree topology reliability for 1,000 simulations. These analy-ses were carried out using the software Treecon (Van de Peer & Watcher, 1994). Similar cultivars were grouped based on clustering closeness among them and the outgroup cultivar. The coefficient of variation based on the assessment of the errors associated with the estimation of genetic distance of the AFLP, RAPD and SSR markers was obtained after 1,000 bootstrap samples using the dBOOT software, version 1.1 (Coelho, 2001).
RESULTS
Levels of polymorphism
The RAPD, AFLP and SSR. markers were cho-sen for this study based on their specific characteristics such as simplicity and low-cost (RAPD), extensive cov-erage of the genome (AFLP and RAPD), and reproduc-ibility (SSR). The methods were tested in all cultivars, and repeated at least two times. However, not all meth-ods had reliable amplification patterns and reproducibil-ity especially the AFLP system. Overall, RAPD and SSR markers had reproducible results, while amplification pat-terns of AFLP markers were more difficult to reproduce. Table 2 - Access number of microsatellite loci in the Genbank and respective forward and reverse primer sequences used.
n o i s s e c A r e b m u
n Sequenceofprimers(5'-3')
d e t a e p e R e c n e u q e s d e h s i l b u P ) p b ( e z i s a g n i l a e n n A e r u t a r e p m e t ) C º ( t n e m g a r F e g n a r e z i s ) p b ( 9 5 2 0 5 2 J
A SSR1-F
b:ATCTCCTGGACCAGTTAACCSSR1-Rb:
G A A G T T A T T C G T G G A G C G T
C (GT)3/(GT)7 72-103 60 128-139
8 3 7 8 0 3 J
A SSR5.F=AAAAAGCTGGTCCATGTCAASSR5.R= A C A A A T A T T G A C T T G C G G G
G (TG)8 117 60 97
6 4 7 8 0 3 J
A SSR6.F=AGGCCTTCATCTCAAAAACCSSR6.R= A G A A A C G G A G T T C A T T G C G
A (TC)14/(CA)11/(CA)16 217 60 185-211
2 6 7 8 0 3 J
A SSR7.F=CTGGGTTGGTTCTGATTTTGSSR7.R= C C T C T C T T A G A G A C C C T T G
G (TG)16 341 60 325-329
3 6 7 8 0 3 J
A SSR8.F= TGACATAGGGGGCTAAATTGSSR8.R= G T A G T T T C G C A G T G G T A A T
T (CA)10 215 60 199-201
7 6 7 8 0 3 J
A SSR9.F=TGCTTAGGCACTTGATATAGGASSR9.R= A T T T C A T A C A C T G A A C G T G C A
C (CA+TA)38 150 60 101-170
- SSR10.F
1
c= TGTTGCTGAACTGTGTTGCT
R . 0 1 R S
S c1= TCCAGAGAAATGTCGGAAGT (TG)13 198 60 148-150
5 8 7 8 0 3 J
A SSR11.F= TGGCCGTGATAATAAACAGCSSR11.R= A A C C G A A A T C T A A C G G T G T
A (TG)21 212 60 178-196
5 6 7 8 0 3 J
A SSR12.F=ATGCCAAGTCGGAAAAGAASSR12.R= A G T T T C C G A T C T C G A A C G
G (CA)7 136 60 116-118
8 5 2 0 5 2 J
A SSR14.F=AACTCTCCATTCCCGCATTCSSR14.R= G C T C T T G T G T C T T T T G G G T
C (CA)3/(CA)3/(CA)18 89-135 60 104-146
- SSR15.F
2
c=CTCTCCCTCAGTCAATTCCA
R . 5 1 R S
S c2=CTTGGTCTCCCTCCTTTTTC (ATC)14 234 60 191-219
3 4 7 8 0 3 J
A SSR16.F=TTTTCTTGCTAATCTTTGAGGASSR16.R= G G T G T A C T G G G G T A A T C T C
A (CA)7 130 60 108-112
4 5 7 8 0 3 J
A SSR17.F=AAGGGGAGTGGATAAGAAGGSSR17.R= G A A T T T C G T G T T T A G G T C G
G (CA)12 128 60 102-108
4 6 7 8 0 3 J
A SSR18.F=CACTGGCATTAGAAAGCACCSSR18.R= C T C A G T A G T A A C T G A A A C G
G (CA)14 198 60 177-183
6 6 7 8 0 3 J
A SSR19.F=AGTGATCTTCGCAGCCATTSSR19.R= C T T C G G G T C A G T G T T T T T C
T (CA)8 175 60 137-155
1 5 2 0 5 2 J
A SSR20.F=ATTCTCTCCCCCTCTCTGCSSR20.R= G T T C T T T T G C G C G T G T G
T (CA)6/(CA)3/(CA)3/(CA)3/(CA)4/(CA)3/(CA)3/(CA)3 248-258 60 274-282
2 5 2 0 5 2 J
A SSR21.F=ACCCGAAAGAAAGAACCAAGSSR21.R= C T T A C T C C T C T C A A C A C A C
C (GT)4/(GA)4/(GT)4/(GT)6 140-146 60 140-142
3 5 2 0 5 2 J
A SSR22.F=CTTGTTTGAGTCTGTCGCTGSSR22.R= A T G T C T G T A A C C C T C C C T T
T (GA)5/(GT)8/TT(GT)4/TT(GT)7/(GA)11/(TC)2/(CT)3GT 240-270 60 278-311
4 5 2 0 5 2 J
A SSR23.F=GGCTCGAGATATCTGTTTAGSSR23.R= C C T G G G A T A C G G G T A A T T
T (CA)15/(CG)4/CA 132-166 60 148-165
5 5 2 0 5 2 J
A SSR24.F=CCCTCCCTGCCAGAAGAAGCSSR24.R= G C T C C T T T T C C T G C C A C C A
A (GT)5/CT(GT)2/(GT)12 160-170 70 175-181
6 5 2 0 5 2 J
A SSR25.F=AGGAGGGAGGTGTGGGTGAAGSSR25.R= G G A A G A A T A G G T G A G G G G
A (GT)11 118-134 66 135-139
7 5 2 0 5 2 J
A SSR26.F=GACCATTACATTTCACACACSSR26.R= A T G T C A C A C G T T G T T T T A C
G (CTCACA)4/(CA)9 103-122 60 103-126
0 6 2 0 5 2 J
A SSR27.F=TGATGGACAGGAGTTGATGGSSR27.R= T T C C C C A T C C A T C T A A C C G
T (CT)9/(CA)8/(CT)4/(CA)5 100-132 60 118-150
aPublished size refers to the published sequence in Combes et al. (2000) and Rovelli et al. (2000). bF - Forward and R - Reverse.
Therefore, only AFLP results of high quality amplifica-tion were used for further analysis.
The bootstrap procedure was applied to estimate the number of loci required for stable classification of all inbred lines evaluated for each molecular marker. Results from error assessment proved that the number of loci ana-lyzed in this study was sufficient for achieving a dendro-gram stability. Values of coefficient of variation were lower than 8% in AFLP, and 3% in SSR and RAPD, with minimal rates of decrease.
Initially, 80 primers were evaluated to identify RAPD markers. For further analysis, 23 primers were se-lected based on their ability to amplify polymorphic frag-ments among lines. From a total of 157 fragfrag-ments am-plified, 91 were polymorphic. Amplification patterns of RAPD markers were highly conserved in all genotypes evaluated, and very few polymorphisms were identified among lines. Almost all of the observed polymorphism occurs between the C. canephora cultivar Apoatã and the
C. arabica lines.
The AFLP technique allows a 64-primer com-bination for germplasm evaluation (Vos et al., 1995). To optimize the analysis, initially three cultivars were se-lected to run all primer combinations. Combinations that amplified polymorphic fragments in the selected culti-vars were used in all others genotypes. Only 20 out of 64 primer combinations were able to detect polymor-phism among cultivars Icatu Vermelho, Mundo Novo and Apoatã. Although 354 loci had been identified through this method, only 88 were polymorphic, and exhibit the same low diversity observed with RAPD analysis.
Early studies of microsatellites in Coffea iden-tified more than 150 loci, now available in the GenBank (Combes et al., 2000). Based on these sequences, 23 primers pairs were designed and tested in coffee culti-vars. All tested primers amplified polymorphic alleles, and in some loci more than two alleles were present in one genotype. However, most of polymorphisms oc-curred between C. canephora and C. arabica cultivars, (RAPD results).
A comparative analysis presented on Table 3 summarizes all information obtained. The AFLP method identified the highest number of loci, but the lowest amount of polymorphic fragments. Although the RAPD and SSR systems produced lower number of loci, they are more polymorphic than those identified by AFLP. The number of alleles per locus was higher in the SSR sys-tem, and also the number of effective alleles per locus. Overall, the highest assay efficiency index (Ai) was ob-served for AFLP and the lowest for SSR, although SSR had the highest expected heterozigosity value. All sys-tems identified polymorphisms between cultivars, but none of them could establish an amplification pattern for each evaluated genotype.
Genetic Similarity
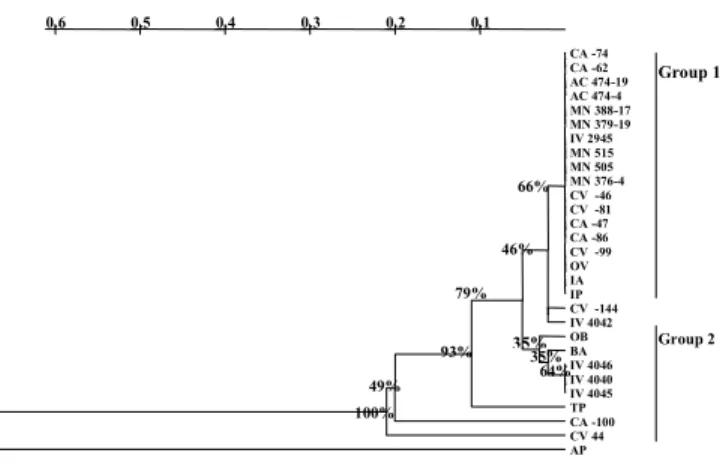
To estimate the genetic diversity in the evaluated germplasm, amplified data from each marker system was used for calculation of genetic distance matrices, simi-larity index, and drawing of inferred topology trees. The UPGMA algorithm was used for grouping all cultivars based on their genetic distances. Dendrograms represent-ing most probable genetic relationship between cultivars are presented in Figures 1, 2 and 3. Bootstrapping val-ues represent percentage out of 1,000 replications, and demonstrated the reliability of tree topologies, especially in those corresponding to RAPD and SSR marker sys-tems. All analysis confirmed the low genetic diversity present in Coffea arabica cultivars.
Overall, trees constructed from data of RAPD (Figure 1) and SSR (Figure 2) markers displayed similar cultivars distribution, and apparently two common groups were observed. The first group includes almost all lines from C. arabica cultivars such as Mundo Novo, Catuaí
Figure 1 - Dendrogram of Coffea cultivars based on genetic distance obtained from RAPD markers using the UPGMA method. Numbers on branches correspond to bootstrap values (1,000 replications).
s r e t e m a r a
P Markersystem
D P A
R AFLP SSR
i c o l f o r e b m u n l a t o
T 157 354 23
s d n a b c i h p r o m y l o p f o r e b m u
N 91 88 65
s u c o l r e p s e l e l l a f o r e b m u n e g a r e v
A 2 2 2.87
r e p s e l e l l a f o r e b m u n e v i t c e f f E
) e n ( s u c o
l 1.13 1.35 3.63
) H ( y t i s o g i z o r e t e h d e t c e p x
E 0.09 0.23 0.33
) P ( s y a s s a f o r e b m u
N 23 30 23
) i A ( x e d n i y c n e i c i f f e y a s s
A 7.71 15.91 3.63
Table 3 - Level of polymorphism and comparative information obtained with RAPD, AFLP and SSR markers.
0.3 0.2 0.1
Group 2
RAPD / UPGMA
Group 1
AP TP OB IV 4040 BA IP IV 4042 MN 515 AC 474-4 CV 44
MN 388 OV
IV 4046 CV 46 CV 144 CA 74 CA 86
MN 505 MN 379
CA 47 CV 81 MN 376 AC 474-19
CA 62 CA 100
CV 99 IV 2945
IA IV 4045 0.1
0.2 0.3
100%
46%
52% 38%
53% 19%
20%
65% 57%
and Acaiá. In the second group, lines from cultivars de-rived from interspecific crosses, such as Icatu, Obatã and Tupi exhibit a closer relationship to the outgroup, the C. canephora cultivar Apoatã. However, some cultivars, such as Catuaí Vermelho 44, Catuaí Amarelo 100 and Icatu Amarelo were not observed in the same group in both analysis. Most observed polymorphisms happened between C. arabica and C. canephora cultivars.
In contrast, results of cultivars grouping using AFLP data were not satisfactory (Figure 3). Although the system was responsible for the highest number of ampli-fied loci, the informativeness of these loci was not as ac-curate as expected. UPGMA grouping could not distin-guish specific groups, as observed for the other marker systems. The inbreed cultivars are distributed without any agreement with pedigree information.
DISCUSSION
All marker systems could identify polymorphic loci in all germplasm. However, the overall polymorphism degree detected by all systems is very low compared to similar analysis in other plant species (Lee, 1995). Most polymorphisms occur between C. arabica and C. canephora. These results agree with other studies on ge-netic diversity of Coffea commercial cultivars (Lashermes et al., 1993; Orozco-Castillo et al., 1994; Cros et al., 1998; Combes et al., 2000; Anthony et al., 2001), which in general, report low genetic diversity of Coffea. This is probably the result of a narrow genetic basis of the cul-tivated coffee, as very few accessions from African coun-tries, such as Yemen and Ethiopia, the geographical ori-gin of C.arabica, were introduced and are the bases of all breeding programs. Also, C. arabica is an autogamous species, what contributes to low heterozygosity levels.
To compare methods that identify polymorphisms with different basis common genetic parameters for a comparison of these methods were determined, and SSR markers were able to detect a higher average effective number of alleles (ne). This high ne results from the fact that more than two alleles were observed for some loci in individual plants. This observation could be explained by the fact that C. arabica is an allotetraploid species, and therefore microsatellite alleles from both parents could be detected.
The lowest efficiency index was obtained with the SSR markers. This index considered both number of loci and assays required to identify them. In this case, the AFLP method presented the highest index, for it was ca-pable to amplify higher number of fragments. Similar re-lationships for molecular markers methods are also ob-served in other plant species (Becker et al., 1995; Pejic et al., 1998). Despite AFLP system having the highest in-dex, the lowest degree of polymorphism was also asso-ciated with this system. Similar results were also observed for other plant species evaluated through this method (Lu et al., 1996; Powel et al., 1996; Pejic et al., 1998).
A disadvantage of the AFLP system is its tech-nical complexity, which involves several steps of diges-tion, adapter ligation and selective amplification (Vos et al., 1995). The detection method chosen in this study, us-ing fluorescent primers, is highly sensitive, and numer-ous peaks corresponding to amplified fragments were
de-Figure 2 - Dendrogram of Coffea cultivars based on genetic distance obtained from SSR markers using the UPGMA method. Numbers on branches correspond to bootstrap values (1,000 replications).
AP
CV 44 CA -100 TP
OB
BA
IV 4046
CA -74
CA -62
AC 474-19
AC 474-4
MN 388-17
MN 379-19
IV 2945
MN 515
MN 505
MN 376-4
CV -46
CV -81
CA -47
CA -86
CV -99 OV
IA
IP
CV -144
IV 4042
IV 4040
IV 4045
0.1 0.2 0.3 0.4 0.5 0.6
100% 49%
93% 79%
46% 66%
35%
35%
64%
Microsatélites / UPGMA
Group 1
Group 2
Figure 3 - Dendrogram of Coffea cultivars based on genetic distance obtained from AFLP markers using the UPGMA method. Numbers on branches correspond to bootstrap values (1,000 replications).
CA47 MN 379 CV 44 IA CV 46
CA 62 CV 81 IP IV 2945
CA 86 CA 100 MN 388 IV 4042
OV OB IV 4045 IV 4046
MN 515 MN 505 0.1
0.2
44% 22%
14%
13% 14%
16% 43%
23%
50%
20%
94%
67%
AFLP / UPGMA
tected. To identify real polymorphisms and to exclude non-significant amplification background, restrictive pa-rameters were used in our analysis (see Material and Methods). These parameters were chosen based on com-parisons of AFLP fragments amplified by duplicated analysis of several primers combinations. However, in this type of restrictive analysis, fragments that may be signifi-cant, but are not very frequent in the genome, are not con-sidered for calculations. Therefore, as analysis can carry frequent mistakes, AFLP markers detection method used in this work may not be appropriate for Coffea germplasm characterization.
All germplasm were very close related, and no evident separation of cultivars was achieved. The trees constructed from RAPD and SSR systems were very simi-lar. The tree corresponding to AFLP data analysis does not allow any significant grouping, and no co-relation with pedigree origin could be established with the evalu-ated cultivars.
Analysis of similarity trees constructed from RAPD and SSR reveal the occurrence of two groups. One group includes most of the C. arabica cultivars. However, no detectable genetic diversity was observed between tall cultivars, such as Mundo Novo and Acaiá, and short ones, such as Catuaí and Ouro Verde. This grouping agrees with the pedigree of these cultivars, and demonstrates a com-mon genetic origin. Actually, all Catuaí inbred lines are derived from a cross between cultivar Mundo Novo and cultivar Caturra, containing the allele Ct that causes short-ening of branch internodes. Catuaí cultivars were devel-oped from progenies backcrossed to Mundo Novo (Carvalho & Monaco, 1972). Therefore, genetic differ-ences between cultivars Mundo Novo and Catuaí are ex-pected to be very small. Similarly, the Acaiá cultivar is also derived from progenies of Mundo Novo selected for larger fruit and seed size (Fazuoli, 1977).
The second group comprise most of the inter-spe-cific cultivars represented by the tall cultivars Icatu, and medium-tall cultivars Obatã and Tupi. The pedigree ori-gin of these cultivars is different. Icatu lines are derived from crosses of C. canephora, Robusta type, with C. arabica cultivar Bourbon Vermelho, and were specifically selected for resistance to Hemileia vastatrix that causes the leaf rust disease (Fazuoli, 1991). On the other hand, Tupi and Obatã were selected from crosses between C. arabica cultivar Villa Sarchi and Timor Hybrid, a natu-ral C. arabica × C. canephora hybrid (Fazuoli et al., 1996). All these cultivars have in common a C. canephora genetic background. As this is an allogamous species, and the origin of the varieties of each cultivar is different, a greater genetic diversity among these culti-vars could be expected, but was not observed. One ex-planation is the fact that these cultivars resulted from sev-eral backcrosses to C. arabica, particularly Mundo Novo. In fact, in the SSR-derived tree, cultivars Icatu Precoce,
Icatu Vermelho IAC 2945 and Icatu Amarelo were grouped together with all others C. arabica germplasm.
The presence of Bourbon Amarelo in the group of interspecific cultivars, in both RAPD and SSR trees, is an interesting result. The genetic origin of Bourbon Amarelo is not well known, but it is probably the result of an expontaneous cross between Arabica cultivars Bourbon Vermelho and Amarelo de Botucatu, similar to Mundo Novo and Acaiá (Carvalho et al., 1957; Fazuoli, 1977). However, Bourbon Amarelo was not exposed to intense cycles of breeding, and therefore could present higher degree of genetic variability than other arabicas selected cultivars. Also, Bourbon Amarelo groups with cultivars Tupi and Obatã (Figures 1 and 2). These cul-tivars were selected from crosses of Villa Sarchi, a re-sult of Sarchimor and Bourbon cross (Carvalho et al., 1991).
Even though RAPD and SSR marker systems did not had the highest Ai index, they could detect more sig-nificant degrees of polymorphism within Coffea
germplasm, and were more efficient to determine relation-ships between genetic diversity and pedigree origin. However, because of the very small genetic background of commercial coffee lines, neither RAPD nor SSR is suit-able for accurately clustering coffee cultivars.
The identification of individual coffee lines through the three molecular markers would be very dif-ficult. In general, the resulting, observed groups were ex-pected, based on previous knowledge of the genetic ori-gin of evaluated cultivars. However, agronomic differ-ences, such as productivity and plant architecture, are well recognized in field experiments and commercial planta-tions, indicating the existence of genetic differences on those cultivars. For the purpose of cultivar identification, a combination of botanical, agronomic and molecular de-scriptors could be complemented with gene polymor-phism identification. In this case, future analysis should look for variability of genes directly related to agronomic traits.
ACKNOWLEDGEMENTS
This study was supported by Brazilian Consor-tium for Coffee Research and Development (CBP&D) and PRODETAB. First and second authors were sup-ported by the CBP&D. The third author was supsup-ported by a graduate scholarship from Capes/ Brazil.
REFERENCES
AGUIAR, A.T.E. Utilização de descritores na caracterização de cultivares e linhagens de café arábica. Campinas: Instituto Agronômico, 2001. 98p. (Dissertação - Mestrado).
ANTHONY, F.; BERTRAND, B.; QUIROS, O.; WILCHES, A.; LASHERMES, P.; BERTHAUD, J.; CHARRIER, A. Genetic diversity of wild coffee(Coffeaarabica L.) using molecular markers. Euphytica,
ANTHONY, F.; COMBES, M.C.; ASTORGA, C.; BERTRAND, B.; GRAZIOSI, G.; LASHERMES, P. The origin of cultivated Coffea arabica L. varieties revealed by AFLP and SSR markers. Theoretical
and Applied Genetics, v.104, p.894-900, 2002.
BECKER, J.; VOS P.; KUIPER, M.; SALAMINI, F.; HEUN, M. Combined mapping of AFLP and RFLP markers in barley. Molecular and General
Genetics, v.249, p.65-73, 1995.
CARVALHO, A.; MONACO, L. C. Transferência do fator Caturra para o cultivar “Mundo Novo” de Coffea arabica. Bragantia, v.31, p.379-399, 1972.
CARVALHO, A.; ANTUNES FILHO, H.; MENDES, J.E.T.; LAZZARINI, W.; REIS, A.J.; ALOISI SOBRINHO, J.; MORAES, M.V; NOGUEIRA, P.K.; ROCHA, T.R. Melhoramento do cafeeiro: Café Bourbon Amarelo.
Bragantia, v.16, p.411-454, 1957.
CARVALHO, A.; MEDINA FILHO, H.P.; FAZUOLI, L.C.; GUERREIRO-FILHO, O.; LIMA, M.M.A. Aspectos genéticos do cafeeiro (Genetic Aspects of the coffee tree). Revista Brasileira de Genética, v.14; p.135-183, 1991.
COELHO, A.S.G. Avaliação dos erros associados a estimativas de distâncias/similaridades genéticas através do procedimento de
bootstrap com número variável de marcadores. Versão 1.1. Goiânia:
UFG, Instituto de Ciências Biológicas, Departamento de Biologia Geral, 2001.
COMBES, M.C.; ANDRZEJEWSKI, S.; ANTHONY, F.; BERTRAND, B.; ROVELLI, P.; GRAZIOSI, G.; LASHERMES, P. Characterization of microsatellites loci in Coffea arabica and related coffee species.
Molecular Ecology, v.9, p.1171-1193, 2000.
CROS, J.M.C.; COMBES, P.; TROUSLOT, F.; ANTHONY, S.; HAMON, A.; CHARRIER, A.; LASHERMES P. Phylogenetic relationships of
Coffea species: new evidence based on the chloroplast DNA variation analysis. Molecular Phylogenetics and Evolution, v.9, p.109-117, 1998.
DICE, L.R. Measures of the amount of ecologic association between species.
Ecology, v.26, p.297-302, 1945.
FAZUOLI, L.C. Avaliação de progênies de café Mundo Novo (Coffea arabica L.). Piracicaba: USP/ESALQ, 1977. (Dissertação - Mestrado). FAZUOLI, L.C. Metodologias; critérios e resultados da seleção em progênies do café Icatu com resistência a Hemileia vastatrix. Campinas: UNICAMP, 1991. (Tese - Doutorado.).
FAZUOLI, L.C.; MEDINA FILHO H.P.; GUERREIRO FILHO O.; LIMA M.M.A.; SILVAROLLA, M.B.; GALLO P.B.; COSTA, W.M. Obatã (IAC1669-20) e Tupi (IAC1669-33); cultivares de café de porte baixo e resistentes a ferrugem. In: CONGRESSO BRASILEIRO DE PESQUISAS CAFEEIRAS, 22., Águas de Lindóia. Resumos. Águas de Lindóia, 1996. p.149-150.
FELSENSTEIN, J. Confidence limits on phylogenies: na approach using the bootstrap. Evolution, v.39, p.783-791, 1985.
JOUQUAND, S.; CHÉRON A.; GALIBERT F. Microsatellite analysis using a two step procedure for labeling of PCR products. Biotechniques, v.26, p.902-905, 1999.
LASHERMES, P.; CROS, J.; MARMEY, P.; CHARRIER, A. Use of random amplified DNA markers to analyze genetic variability and relationships of Coffea species. Genetic Resources and Crop Evolution, v.40, p.91-93, 1993.
LEE, M. DNA markers and plant breeding programs. Advances in
Agronomy, v.55, p.265-344, 1995.
LU, J.; KNOX, M.R.; AMBROSE, M.J.; BROWN, J.K.M.; ELLIS, T.H.N. Comparative analysis of genetic diversity in pea assessed by RFLP and PCR-based methods. Theoretical and Applied Genetics, v.93, p.1103-1111, 1996.
MORGANTE, M.; RAFALSKY, A.; BIDDLE, P.; TINGEY, S.; OLIVIERI, A.M. Genetic mapping and variability of seven soybean simple sequence repeat loci. Genome, v.37, p.763-769, 1994.
NEI, M.; LI, W.H. Mathematical model for studying genetic variation in terms of restriction endonucleases. Proceedings of the National
Academy of Sciences of the USA, v.76, p.5269-5273, 1979. Falta
citação no texto.
OROZCO-CASTILLO, C.; CHALMERS, K.J.; WAUGH, R.; POWEL, W. Detection of genetic diversity and selective gene introgression in coffee using RAPD markers. Theoretical and Applied Genetics, v.93, p.934-940, 1994.
PEJIC, I.; AJMORE-MARSAN, P.; MORGANTE, M.; KOZUMPLICK, V.; CASTIGLIONI, P.; TARAMINO, G.; MOTTO, M. Comparative analysis of genetic similarity among maize inbred lines detected by RFLPs; RAPDs; SSRs; and AFLPs. Theoretical and Applied Genetics, v.97, p.1248-1255, 1998.
POWELL, W.; MORGANTE, M.; ANDRE, C.; HANAFEY, M.; VOGEL, J.; TINGEY, P.; RAFALSKY A. The comparison of RFLP; RAPD; AFLP and SSR (microsatellite) markers for germplasm analysis. Molecular
Breeding, v.2, p.225-238, 1996.
RHODES, M.; DEARLOVE, A.; STRAW, R.; FERNANDO, S.; EVANS, A.; GREENER, M.; LACEY, T.; KELLY, M.; GIBSON, K.; BROWN, S.D.M.; MUNDY, C. High-throughput microsatellite analysis using fluorescent dUTPs for high-resollution genetic mapping of the mouse genome. Genetical Research, v.7, p.81-86, 1997.
ROVELLI, P.; METTULIO, R.; ANTHONY, F.; ANZUETO, F.; LASHERMES, P. GRAZIOSI, G. Microsatellites in Coffea arabica L. In: INTERNATIONAL SEMINAR ON BIOTECHNOLOGY IN THE COFFEE AGROINDUSTRY, 3., Londrina, 2000. Coffee biotechnology
and quality; proceedings.Dordrecht: Kluwer Academic Publishers,
2000. p.123-133.
SERA, T.; RUAS, P.M.; RUAS, C.F.; DINIZ, L.E.C.; CARVALHO, V.P.; RAMPIM, L.; RUAS, E.A.; SILVEIRA, S.R. Genetic polymorphism among 14 elite Coffea arabica L. cultivars using RAPD markers associated with restriction digestion. Genetics and Molecular Biology,
v.26, p.59-64, 2003.
VAN DE PEER, Y.; WACHTER, R. TREECON for Windows: a software package for the construction and drawing of evolutionary trees for the Microsoft Windows environment. Computer Applications in the
Biosciences, v.10, p.569-570, 1994.
VOS, P.; HOGERS, R.; BLEEKER, M.; REIJANS, M.; VAN DE LEE, T.; HORNES, M.; FRIJTERS, A.; POT, J.; PELEMAN, J.; KUIPER, M.; ZABEAU, M. AFLP: a new technique for DNA fingerprinting. Nucleic
Acids Research, v.23, p.4407-4414, 1995.
VROH, L.; HARVENGT, L.; CHANDELIER, A.; MERGEAI, G.; DU JARDIN, P. Improved RAPD amplification of recalcitrat plant DNA by the use of activated charcoal during DNA extraction. Plant Breeding, v.115, p.205-206, 1996.