Use of AFLP and RAPD molecular genetic markers and cytogenetic analysis
to explore relationships among taxa of the Patagonian
Bromus setifolius
complex
Ana M. García
1, Gustavo E. Schrauf
2, Graciela González
1, Lidia Poggio
1, Carlos A. Naranjo
3†,
Marck P. Dupal
4, Germán C. Spangenberg
4and John W. Forster
41
Facultad de Ciencias Exactas y Naturales, Universidad de Buenos Aires, Buenos Aires, Argentina.
2Facultad de Agronomía, Universidad de Buenos Aires, Buenos Aires, Argentina.
3
Instituto Fitotécnico de Santa Catalina, Llavallol, Argentina.
4
Primary Industries Research Victoria, Victorian AgriBiosciences Centre, Bundoora, Victoria, Australia.
Abstract
Bromus setifolius var. pictus (Hook) Skottsb., B. setifolius var. setifolius Presl. and B. setifolius var. brevifolius Ness are three native Patagonian taxa in the sectionPnigma Dumort of the genus Bromus L. AFLP and RAPD analysis, in conjunction with genetic distance measurements and statistical techniques, revealed variation within this group and indicated thatB. setifolius var. brevifolius was closely related to B. setifolius var. pictus, with both taxa being more distantly related to B. setifolius var. setifolius. Cytogenetic analysis confirmed the chromosomal number of B. setifolius var. pictus (2n = 70) and B. setifolius var. setifolius (2n = 28) and showed for the first time that B. setifolius var.brevifolius had 2n = 70. The combination of molecular genetic and cytogenetic evidence supported a species status for two of the three taxa and suggested hypotheses for the evolutionary origin of these complex taxa. Species status was also indicated forB. setifolius var. setifolius. Based on these findings, we suggest that B. setifolius var. pictus be referred to as B. pictus Hook var. pictus, and B. setifolius var brevifolius as B. pictus Hook var brevifolius. The correlation between AFLP diversity and variation in ecological parameters suggested that this marker system could be used to assess breeding progress and to monitor the domestication of PatagonianBromus species for agro-nomic use.
Key words:AFLP, Argentina,Bromus setifoliuscomplex, cytogenetics, Patagonia, RAPD.
Received: May 16, 2008; Accepted: August 12, 2008.
Introduction
The genus Bromus L. contains approximately 150 species grouped into six taxonomic sections that are distrib-uted throughout temperate regions of the world (Clayton and Renvoize, 1986). The sectionPnigmaincludes about 60 species that are disseminated across Eurasia and North and South America (Smith, 1970). In Patagonia of South America, the sectionPnigmais represented byB. setifolius
Presl., which has been considered as a complex taxon be-cause of its extensive morphological variation (Camara Hernandez, 1978; Matthei, 1986; Gutierrez and Pensiero, 1998). Three varieties of this species are recognized, namely,B. setifoliusvar.setifolius,B. setifoliusvar.pictus
(Hook. F.) Skottsberg and B. setifolius var. brevifolius
Ness.
The semi-desert region of Patagonia is a large envi-ronmental niche that has been subjected to substantial deg-radation (Aguiar and Sala, 1998). Bare soils represent ~60% of the total area, and a recent history of over-grazing has accelerated the process of desertification. Members of theB. setifoliuscomplex could play an important role in the cessation and reversal of this environmental degradation (Aguiar and Sala, 1997). This is particularly true of B. setifoliusvar.pictus, which shows a favorable combination of drought resistance, high recruitment capacity and forage nutritive value. Bromus setifolius var. pictus and B. setifolius var. setifolius are sympatric inhabitants of the Patagonian semi-desert, whereas B. setifolius var.
brevifoliusis found in wetter grass steppe environments of the sub-Andean region (Naranjoet al., 1990; Gutierrez and Pensiero, 1998).
Naranjo et al. (1990) performed a biosystematic study of the two sympatric taxaB. setifoliusvar.setifolius
andB. setifoliusvar.pictus. Numerical taxonomy based on cluster analysis and principal components analysis (PCA)
Send correspondence to Gustavo E. Schrauf. Facultad de Agro-nomía, Universidad de Buenos Aires, Av. San Martín 4453, 1417 Buenos Aires, Argentina. E-mail: gschrauf@agro.uba.ar.
†
Deceased in 2005.
of 35 exomorphological characters detected two phene-tically distinct groups that corresponded toB. setifoliusvar.
setifoliusandB. setifoliusvar.pictus. Cytological examina-tion of mitosis demonstrated thatB. setifoliusvar.setifolius
plants had a chromosomal composition of 2n = 4x = 28, whereasB. setifoliusvar.pictusplants had a chromosomal composition of 2n = 10x = 70. Other cytogenetic differ-ences between the two taxa included the karyotypic for-mula, type of satellite chromosome, basic genome length, asymmetry, C-banding patterns, and meiotic chromosomal behavior.
Meiotic chromosomal pairing in B. setifolius var. setifoliusindicated the formation of 14 bivalents, typical of an allotetraploid. In contrast, chromosomal pairing in B. setifoliusvar.pictussuggested segmental allodecaploid be-havior, with the formation of 35 bivalents being the most fre-quent configuration. With regard to the breeding systems, cleistogamous and chasmogamous flowers were found inB. setifoliusvar.setifoliuswhereas only cleistogamous flowers were observed inB.setifoliusvar.pictus; morphological and cytological analyses revealed no hybrid individuals. The sta-ble morphological features of both taxa, which paralleled the karyotypic differences between them, suggested that they should be recognized as separate species (Naranjo et al., 1990). Although several cytogenetic studies have been re-ported for taxa of the B. setifolius complex (Covas and Schnack, 1946; Stebbins, 1947; Covas and Hunziker, 1954; Naranjo et al., 1990), the chromosome number of B. setifoliusvar.brevifoliushas not as yet been determined.
Robust delineation among taxa withinB. setifoliusis problematic (Gutierrez and Pensiero, 1998). The morpho-logical traits that distinguish these taxa are not randomly selected and may consequently bias estimates of genetic distance among groups (Lewontin, 1974). In addition, the discontinuity of morphological characteristics is not always observed. Although the potential influence of environmen-tal selection on adaptive traits is more readily understood for phenotypically-apparent traits than for cryptic markers such as DNA-based polymorphisms, genetic polymor-phisms may nevertheless provide complementary data for detailed analysis of closely related genotypes.
Molecular genetic methods have been applied to plant biosystematics with considerable success (Doebley, 1992; Soltis and Soltis, 1998). Random amplified polymorphic DNA (RAPD; Williamset al., 1990) and amplified frag-ment length polymorphism (AFLP; Voset al., 1995) are two PCR-based techniques that have been successfully ap-plied to the identification and estimation of molecular ge-netic diversity in various species (Newbury and Ford-Lloyd, 1993; Paran et al., 1998; Kolliker et al., 2001; Massaet al., 2001; Puecheret al., 2001). These techniques provide major advantages compared to other molecular marker methods such as restriction fragment length poly-morphism (RFLP) because of their reduced requirement for large quantities of genomic DNA, their ability to amplify DNA from preserved tissues, and the smaller amount of time, labor and cost involved. In addition, unlike the PCR-based simple sequence repeat (SSR) and single nucleotide polymorphism (SNP) techniques, no prior sequence knowl-edge is required, and both RAPD and AFLP generate multi-ple locus information in a single assay (Wolfe and Liston, 1998). However, problems with reproducibility, particu-larly for RAPD, and the generation of dominant markers that are not locus-specific, limit the applicability of these methods, especially for genetic mapping studies compared to simple DNA profiling.
The aim of this study was to use molecular genetic and cytological approaches to examine the relationships among taxa of theB. setifolius complex. The results de-scribed here should be useful in elucidating the evolution-ary processes that led to the origin of these taxa and should facilitate the domestication of forage grass species with po-tential agronomic value.
Materials and Methods
Plant material
Samples from different accessions of the section
Pnigma were obtained from Patagonia, in Argentina (Table 1). The morphological variation of dried tussocks was used to classify each accession. Seeds obtained from different tussocks were planted in pots to produce plantlets
Table 1- Classification of the samples used for molecular genetic marker analysis based on the species and variety, geographical origin, sample code and type of analysis.
Species Population Code Type of molecular marker analysis
B. s.var.setifolius Río Mayo Bs1 RAPD and AFLP
B. s.var.brevifolius San Martín de los Andes Bb1 RAPD and AFLP
B. s.var.pictus Río Mayo Bp1 RAPD
B. s.var.pictus Río Mayo (non-grazed 1) BpRMe1 AFLP
B. s.var.pictus Río Mayo (non-grazed 2) BpRMe2 AFLP
B. s.var.pictus Río Mayo (grazed 1) BpRMg1 AFLP
B. s.var.pictus Río Mayo (grazed 2) BpRMg2 AFLP
B. s.var.pictus Gobernador Costa BpGC AFLP
for analysis. RAPD and AFLP analyses were done on pooled samples from 20 plantlets ofB. setifoliusvar.pictus
(Bp1),B. setifoliusvar.brevifolius(Bb1) andB. setifolius
var.setifolius (Bs1). Five accessions ofB. setifoliusvar.
pictuswere included in the AFLP analysis. One was native to a region close to the Atlantic coast known as Gobernador Costa, and is denoted here asBpGC. The other four acces-sions were native to the Rio Mayo region in the Patagonian shrub steppe located close to the Andes: two of the Rio Mayo accessions were from areas grazed predominantly by sheep (denoted here asBpRMg1 andBpRMg2), and two were from areas excluded from the grazing by large herbi-vores, sheep and guanacos (denoted as BpRMe1 and
BpRMe2). A pooled genotypic sample of B. catharticus
Vahl. subsp.stamineus(Desv.) Massa (2n= 42) from sec-tionCeratochloaof the genusBromuswas obtained from humid microenvironments of Patagonia and used as a con-trol (outgroup).
RAPD and AFLP assays
Young leaves from 20 plantlets of each accession were combined, snap frozen in liquid nitrogen and lyophi-lized for 48 h. Subsequently, aluminum oxide crystals were added and the samples were ground to a fine powder with a pre-cooled pestle and mortar, prior to DNA extraction by the method of Saghai-Maroofet al.(1984).
The amplification reactions for RAPD analysis was done using different decamer oligonucleotide primers (Operon Technologies, Almeda, USA) in a DNA thermal cycler (Perkin Elmer). After an initial denaturation step at 94 °C, 42 cycles of 45 s at 94 °C (denaturation), 60 s at 55 °C (annealing), and 90 s at 72 °C (extension) were done prior to a final extension of 5 min at 72 °C and subsequent cooling to 4 °C. The amplified products were visualized by staining with ethidium bromide (0.5mg/mL) after electro-phoresis at constant voltage (60 V) in 0.9% (w/v) agarose gels in TAE (40 mM Tris-acetate plus 1 mM EDTA) buffer. Seven microliters of the reaction mixture was added to 3mL of 1 x gel loading buffer (Maniatiset al., 1982).
AFLP reactions were done as described by Voset al.
(1995) with appropriate modifications. For digestion, 2.0-3.0mg of the target DNA, 1.25mL ofEcoRI enzyme (12.5 units, 10 U/mL) and 1.25mL ofMseI enzyme (12.5 units, 10 U/mL) were used in a reaction volume of 50mL. Adaptors specific for each restriction enzyme terminus were ligated to the digested DNA fragments in a final vol-ume of 60mL followed by incubation at 37 °C for 5-6 h. Pri-mary amplification by PCR was done using a +0/+0 primer combination and 30 cycles of 94 °C for 30 s, 56 °C for 60 s and 72 °C for 60 s. Diluted primary amplification product was selectively amplified by using 1mL aliquots of the se-lected primer specific for the frequent-cutter restriction enzymeMseI (30 ng/mL) and the rare-cutter restriction en-zyme (EcoRI) (5 ng/mL). The primer forEcoRl was
end-labelled withg33P-ATP to allow autoradiographic detection of AFLP products. The primer combinations used for
EcoRI/MseI were: (1) AAA/GGGT, (2) AAG/GGGT, (3)
AAG/CCA, (4) AAC/CCA, (5) AAC/GGG, (6)
AAC/AAA, (7) AAA/CCA and (8) AAG/CAA. Selective amplification was done using the following touchdown PCR conditions: cycle 1: 94 °C for 30 s, 65 °C for 30 s and 72 °C for 60 s; cycles 2-13: 94 °C for 30 s, 65 °C for 30 s, with a 0.7 °C decrease in each cycle, and 72 °C for 60 s; cy-cles 14-36: 94 °C for 30 s, 56 °C for 30 s and 72 °C for 60 s. After amplification, the sample was mixed with one vol-ume of sequencing loading buffer, heated to 95 °C for 5 min and briefly quenched on ice before the loading onto the gel. Samples were run on a 6% (w/v) denaturing polyacryl-amide gel (19:1 acrylpolyacryl-amide:bis, w/w) in 7.6 M urea and 1x TBE buffer. Electrophoresis was done at constant power (110 W) for ~2 h, after which the gel was dried at 80 °C for 40 min and analyzed by overnight exposure to a storage phosphor screen for phosphorimaging analysis (Molecular Dynamics).
Analysis of molecular marker data
RAPD and AFLP bands were treated as dominant ge-netic markers and scored as polymorphic features if present in some but not all accessions, and as monomorphic fea-tures when the band was present in all of the accessions evaluated. To avoid underestimating the genetic similarity, the monomorphic and polymorphic bands were both in-cluded in the analysis. For RAPD data, genetic distance was estimated using the index of Balakrishnan and Sanghvi (1968). Matrices generated by scoring the AFLP bands were used as input data for the application NTSYS-pc ver-sion 2.01 (Rohlf, 1988). The Jaccard similarity index was applied using the SAHN program of NTSYS, and cluster analysis by UPGMA (unweighted pair-group method with arithmetic averages) was used done to obtain dendrograms. The data was also used for multidimensional principal co-ordinate analysis (PCOA).
Cytogenetic analysis
Chromosomal number and morphology were deter-mined in mitotic metaphases of 20 plants from each acces-sion (B. setifolius var. setifolius, B. setifolius var.
Results
RAPD analysis
Of the 20 decamer RAPD primers that were tested for PCR amplification, 11 yielded clear, reproducible amplifi-cation profiles with the three pooled accessions. Thirty-three of 41 clearly distinguished bands were polymorphic (Figure 1). Calculation of the genetic distances showed that
B. setifolius var. pictus and B. setifolius var. brevifolius
were closer to each other than either was toB. setifoliusvar.
setifolius(Table 2).
AFLP analysis
The amplification profiles obtained with different AFLP primer combinations in the seven samples corre-sponding to different accessions were used to score 692 fragments. The number of bands in each accession differed among taxa, withB setifoliusvar.setifoliushaving a lower number of bands (439) than B. setifolius var. brevifolus
(466) and B. setifolius var. pictus (an average of 471). WithinB. setifolius var.pictus, accessions obtained from grazed areas had a lower number of bands (466) than acces-sions from non-grazed areas (an average of 477). Two hun-dred and seventy-seven bands were monomorphic among the taxa and 415 bands were polymorphic. Among the poly-morphic bands, 153 were exclusive to a single taxon:B.
setifolius var. setifolius had 100 exclusive bands, B. setifoliusvar.brevifolius35 andB. setifoliusvar.pictus18. Within B. setifolius var. pictus, 429 bands were mono-morphic and 84 were polymono-morphic. A comparison of the amplification profiles among accessions in this taxon al-lowed the identification of accession-prevalent and spe-cies-prevalent markers (Figure 2).
SamplesBpRMg1 andBs1 were from the same loca-tion and, in some cases, the same tussock included both species. In contrast, in the other species, individual tus-socks contained only one species, but generally included plants with more than one genotype for the species. The ge-netic distances among the samples analyzed by AFLP were calculated by using the Jaccard similarity coefficient (Table 3). The degree of similarity among the five acces-sions ofB. setifolius var.pictus was high (0.834-0.988). Figure 3 shows the dendrogram obtained by cluster analy-sis of the similarity indexes using the UPGMA method (Figure 3).
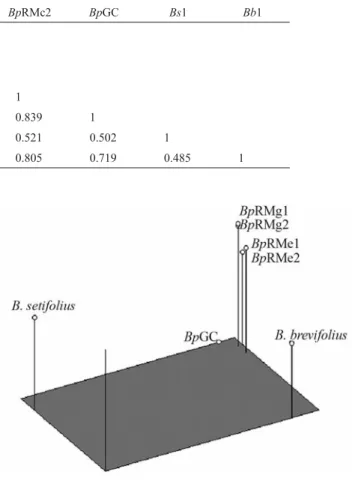
The pooled sample ofB. catharticusgenotypes was clearly separated from accessions of the sectionPnigma, thus confirming thatB. catharticuswas an outgroup in this analysis. The three taxa within section Pnigma were grouped in a single large cluster. WithinB. setifoliusvar. pictus, accessions from the same geographical area (Rio Mayo) were grouped in the same sub-cluster. Two addi-tional sub-clusters were identified in accessions from this geographical location and differed in their grazing history. Figure 4 shows a 3-dimensional plot of the AFLP data based on multidimensional PCOA. The first principal coor-dinate (depicted by the length of the rectangle in Figure 4) explained 51.58% of the total variation and separatedB. setifoliusvar.setifoliusfromB. setifoliusvar.pictusandB. setifoliusvar.brevifolius. The second principal coordinate (depicted by the width of the rectangle) explained 21.52% of the variation and separatedB. setifoliusvar.brevifolius
Table 2- Genetic distances among accessions ofBromusin the section
Pnigma, based on RAPD analysis of pooled samples. The distances were calculated as described by Balakrishnan and Sanghvi (1968).
B. s.
var.pictus
B. s.var.
brevifolius
B. s.var.
setifolius
B. s.var.pictus (Bp1) 0 -
-B. s.var.brevifolius (Bb1) 37.9 0
-B. s.var.setifolius (Bs1) 56.1 68.2 0
Figure 1- RAPD electrophoretic profiles from pooled samples ofB. setifoliusvar. setifolius(Bs),B. setifoliusvar.pictus(Bp) andB. setifolius
var.brevifolius(Bb) based on five primers (opu10: 5’-ACCTCGGCAC-3’, opu11: 5’-AGACCCAGAG-5’-ACCTCGGCAC-3’, opu13: 5’-GGCTGGTTCC-5’-ACCTCGGCAC-3’, opu15: 5’-ACGGGCCAGT-3’, opu17: 5’-ACCTGGGGAG-3’). Molecular size markers are indicated (M = 1 kb DNA ladder).
Figure 2- AFLP electrophoretic profiles from pooled samples of B. setifoliusvar.pictus(Bp),B. setifoliusvar.setifolius (Bs)andB. setifolius
sample fromB. setfolius var.pictusandB. setifoliusvar.
setifolius. The third principal coordinate (depicted by the height of the bars) explained 15.03% of the variation and discriminated between the populations ofB. setifoliusvar.
pictus. Each coordinate in multidimensional PCOA corre-sponded to a new variable associated with genetically-related interspecific differences identified by AFLP analy-sis, and indicated that the greatest genetic divergence was between theB. setifoliusvar.brevifoliusandB. setifolius
var.setifoliussamples (Table 3).
Cytogenetic analysis
Cytogenetic analysis revealed chromosomal numbers of 2n = 28 forB. setifoliusvar.setifolius, 2n = 70 forB. setifolius var. pictus and 2n = 70 for B. setifolius var.
brevifolius(Figure 5).
Discussion
Molecular marker-based genetic diversity analysis
RAPD and AFLP analyses of taxa in the genus
Bromus(sectionPnigma) yielded similar results. Although difficulties associated with the reproducibility of RAPD
limit the applicability of this technique (Perezet al., 1998), RAPD may nevertheless be useful for preliminary assess-ments of intraspecific, interspecific and intergeneric ge-netic variation in grasses (Wanget al., 2001; Garciaet al., 2004). In contrast, the greater accuracy and information content of AFLP make this technique more useful for de-tailed investigations such as in molecular breeding.
The variation in the number of bands among acces-sions was relatively small when compared to the large dif-ferences in chromosome numbers among taxa. Despite its lower chromosome number the tetraploid taxon B. setifoliusvar.setifoliushad only 6.7% fewer bands than the decaploid taxonB. setifoliusvar.pictus.The higher content of genomic DNA in B. setifolius var. setifolius
(1 Cx = 2.06 pg) compared to B. setifolius var. pictus
(1 Cx = 1.63 pg) (Naranjoet al., 1990) may compensate for the lower chromosome number and account for the com-plexity of its AFLP profile. Fayet al.(2005) reported that the number of AFLP bands tended to increase up to a DNA content of 1C = 8.43 pg.
Figure 3- UPGMA dendrogram forB. setifoliusvar.setifolius(Bs1),B. setifoliusvar.brevifolius(Bb1) andB. setifoliusvar.pictus(Bp) acces-sions and theB. catharticuscontrol (Bc). The Jaccard similarity coeffi-cients of AFLP marker data were used to construct the dendrogram.
Table 3- Genetic distances among accessions ofBromusin the sectionPnigma, based on AFLP analysis of pooled samples. The distances were calcu-lated by using the Jaccard similarity coefficient.
Accession BpRMg1 BpRMg2 BpRMc1 BpRMc2 BpGC Bs1 Bb1
BpRMg1 1
-BpRMg2 0.988 1
BpRMe1 0.924 0.927 1
BpRMe2 0.927 0.930 0.943 1
BpGC 0.834 0.841 0.863 0.839 1
Bs1 0.529 0.530 0.506 0.521 0.502 1
Bb1 0.783 0.786 0.777 0.805 0.719 0.485 1
Bromus setifolius var. pictus and B. setifolius var.
brevifoliuswere more similar to each other than either was toB. setifoliusvar.setifolius. This observation is consistent with studies of morphological variation in which B. setifolius var. pictus and B.setifolius var. brevifolius
showed a high degree of similarity and were difficult to dis-tinguish taxonomically (Camara Hernandez, 1978).
Al-though variation in the morphological traits did not permit a clear delineation between the taxa (Gutiérrez and Pensiero, 1998), both RAPD and AFLP analysis revealed bands that may be considered as taxon-specific discriminatory mark-ers. This was particularly the case in the AFLP profiles. However, these results must be treated as preliminary until a larger number of accessions have been analyzed. AFLP analysis showed that very low frequencies in one taxon and very high frequencies in another may be readily mis-classified as diagnostic bands because of the small sample sizes involved. Consequently, such features may be more accurately described as taxon-prevalent and require more intensive analysis.
Analysis of the genetic structure of plant popula-tions requires the sampling of individual plants. In grasses of the genusBromus, it is conventional to consider each tussock as an individual genotype, but it is also possible for individual tillers in a single tussock to be derived from different individuals of the same species, or even from dif-ferent species. Wind damage on the Patagonian steppe produces high mortality during seedling recruitment (Aguiar and Sala, 1997). Consequenly, long-established tussocks may provide a ‘nurse effect’ by protecting the seedlings against wind. The composite content of individ-ual tussocks is a potentially important confounding factor in the study of genetic diversity and may also provide an explanation for some of the difficulties previously en-countered in the taxonomic discrimination of related spe-cies. The use of individual inflorescences as the unit of study, rather than the entire tussock, provides a way to ad-dress this problem.
Relationships between genetic variation and ecological parameters
In grass species there is not always a correlation be-tween variation in morphological traits, geographical dis-tribution, life history traits and biochemical or molecular genetic data. The lack of such correlations for B. catharticuswas explained in terms of phenotypic plasticity (Puecher et al., 2001). In the grass Schizachyrium scoparium(Carman and Briske, 1985) morphological dif-ferences were detected between populations that had been subjected to long-term grazing and those that had not been grazed, but isoenzyme variation was not related to grazing history. Schrauf and Naranjo (1988) attributed the observed differences in isozenzyme frequencies between grazed and non-grazed populations ofPappophorum caespitosumand
P. philippianumto the random effects of genetic drift. As shown here, accessions ofB. setifoliusvar.pictus
with different grazing histories were resolved into different sub-clusters based on AFLP data. In addition, non-grazed accessions had more AFLP bands than those that had been grazed. These results may have several explanations. Sheep, as the primary grazing animals in this study, may have a more selective grazing behavior than bison (Carman Figure 5 Photomicrographs of root tip metaphase chromosomes. 5.1
-Bromus setifoliusvar.setifolius(2n = 28), 5.2 -Bromus setifoliusvar.
and Briske, 1985) and cows (Schrauf and Naranjo, 1988), as found forDanthoniaspecies (Scott and Whalley, 1984). Alternatively, the wider range of markers analyzed by AFLP makes this system more capable of assessing a more representative sample of genomic variation than isoenzy-mes, thereby allowing finer discrimination among acces-sions.
Cytogenetic analysis and evolutionary relationships
Kozuharovet al.(1981) showed that diploid, tetra-ploid and higher polytetra-ploid level chromosomal races within the annualBromusspeciesB. secalinusandB. lanceolatus
were morphologically similar and that there was little justi-fication for their taxonomic separation. In contrast, the pe-rennial octoploid species B. lacmonicus and the diploid speciesB. parilicusare morphologically similar but show features that reflect their cytological differences and conse-quently justify their species status. Similarly,B. setifolius
var. setifolius (2n = 28) and B. setifolius var. pictus
(2n = 70) are perennial taxa with stable morphological dif-ferences that parallel their karyotypic divergence and sup-port their classification as separate species.
Naranjoet al.(1990) proposed thatB. setifoliusvar.
setifolius(sensuNaranjoet al.(1990):B. setifolius) may be a progenitor taxon of the polyploidB. setifolius var
pictus(sensu Naranjo et al. (1990): B. pictus) on their morphological similarity, karyotypic structure, growth pattern, breeding system and presence of reproductive iso-lation. Recent work using fluorescencein situ hybridiza-tion with total genomic DNA as a probe (GISH) has shown thatB. setifoliusvar. setifoliusor a closely related taxon is one of the progenitors ofB. setifoliusvar.pictus, thus confirming the allopolyploid nature of this species (Garciaet al., 2005).
This report is the first to describe the chromosomal number of B. setifolius var. brevifolius (2n = 70). As shown here, molecular genetic data indicated a close rela-tionship between B. setifolius var. brevifolius and B. setifoliusvar. pictus, and AFLP-based PCOA suggested thatB. setifoliusvar.brevifoliusmay be directly derived fromB. setifoliusvar.pictus, rather than the second allo-polyploid progenitor, in agreement with the morphophy-siological reticular pattern (Garciaet al., 2001).Bromus setifoliusvar.brevifoliushas wide leaves and a fast initial growth, B. setifolius var. setifolius has short internodes and high drought resistance, andB. setifoliusvar. pictus
has wide leaves, short internodes, fast initial growth and high drought resistance. The putative progenitor of B. setifoliusvar.pictusmay have had a haploid chromosomal complement of n = 21, assuming that B. setifolius var.
pictushas retained the genetic complement of both ances-tral species (some chromosomal rearrangements may have occurred subsequent to polyploid formation). Addi-tional studies are required to determine the identity of this progenitor.
Conclusions and agronomic implications
A taxonomic realignment ofBromusspecies within sectionCeratochloahas been proposed based on morpho-logical, cytological and molecular genetic data (Massa et al., 2004). The molecular genetic and cytogenetic data de-scribed here have clarified the relationships among taxa of the PatagonianBromussection Pnigma. These data agree with the findings of Naranjoet al. (1990). Taxonomically,
B setifolius var. setifolius and B. setifolius var. pictus
should be recognized as distinct species under the namesB. setifoliusPresl. andB. pictusHook, respectively. The cyto-logical and molecular genetic similarity between B. setifoliusvar.pictusandB. setifoliusvar.brevifolius sug-gests that these taxa be considered as varieties within the same species,i.e.,B. pictusvar.pictusandB. pictusvar.
brevifolius, respectively.
Bromus pictusvar.pictusis currently the most attrac-tive option for a cultivated species to mediate the reversal of environmental degradation in Patagonia because of its combination of drought tolerance, high recruitment capac-ity and forage qualcapac-ity. Biodiverscapac-ity conservation issues may also be addressed through domestication and im-proved breeding ofB. pictusvar.pictus, particularly since genetic erosion through sheep grazing has pushed species of the sectionPnigmato the brink of extinction. The genetic conservation ofB. pictusvar.pictuswill prove effective for the section as a whole, and the initial data described here for molecular marker variation will provide valuable informa-tion for marker-assisted breeding and future evoluinforma-tionary studies.
Acknowledgments
The authors thank V. Corcuera for helpful comments on the original manuscript, R. Golluscio, P. Maceda, M. Mercau and A. Sessa for help in collecting the plant mate-rial and D. Fink for help in preparing the figures. This re-search was supported by grants from the Consejo Nacional de Investigaciones Cientificas y Tecnicas (CONICET), Universidad de Buenos Aires (grant nos. TW01, G017 and AG097), and the Agencia Nacional de Promocion Cien-tifica y Tecnologica (grant no. PICT 14170), Argentina. Lidia Poggio and Carlos A. Naranjo (deceased in 2005) are career researchers of CONICET. In Australia, this work was supported by the Victorian Department of Primary In-dustries (DPI) and the Molecular Plant Breeding Coopera-tive Research Centre.
References
Aguiar MR and Sala OE (1997) Seed distribution constrains the dynamics of the Patagonian steppe. Ecology 78:93-100. Aguiar MR and Sala OE (1998) Interactions among grasses,
Balakrishnan V and Sanghvi D (1968) Distance between popula-tions on the basis of attribute data. Biometrics 6:859-865. Camara Hernandez J (1978)BromusL. In: Nicora EG (ed) Flora
Patagónica. Gramineae. V. 8. Colección Científica INTA, Buenos Aires, pp 77-93.
Carman JG and Briske DD (1985) Morphologic and allozymic variation between long term grazed and non-grazed popula-tions of the bunchgrass Schizachyrium scoparium var.
frequens. Oecologia 66:332-337.
Clayton WD and Renvoize SA (1986) Genera graminum. Grasses of the world.Kew Bull 13:1-389.
Covas G and Hunziker JH (1954) Estudios cariológicos en antó-fitas. IV parte. Rev Inv Agrop 8:249-253.
Covas G and Schnack B (1946) Números cromosómicos en anto-fitas de la región de Cuyo. Rev Arg Agron 13:153-166. Doebley J (1992) Molecular systematics and crop evolution. In:
Soltis PS, Soltis DE and Doyle JJ (eds) Molecular Systemat-ics of Plants. Chapman and Hall, New York, pp 202-222. Fay MF, Cowan RS and Leitch IJ (2005) The effects of nuclear
DNA content (C2 value) on the quality and utility of AFLP fingerprints. Ann Bot 95:237-246.
Garcia AAF, Benchimol LL, Barbosa AMM, Geraldi IO, Souza Jr CL and Souza AP (2004) Comparison of RAPD, RFLP, AFLP and SSR markers for diversity studies in tropical maize inbred lines. Genet Mol Biol 27:579-588.
García AM, Schrauf GE, Naranjo CA and Poggio L (2001) Apor-tes al conocimiento del origen deBromus pictusutilizando técnicas citogenéticas-moleculares. BAG J B Appl Genet 14:79.
García AM, Schrauf GE, González G, Poggio L, Naranjo CA, Dupal MP, Forster JW and Spangenberg GC (2005) Cyto-logical and molecular approach to analyse Patagonian
Bromusspecies. XVII International Botanical Congress, Vi-enna, pp 349.
Gutiérrez HF and Pensiero JF (1998) Sinopsis de las especies
argentinas del género Bromus (Poaceae). Darwiniana
35:75-114.
Kolliker R, Jones ES, Jahufer MZZ and Forster JW (2001) Bulked AFLP analysis for assessment of genetic diversity in white clover (Trifolium repensL.) Euphytica 121:305-315. Kozuharov S, Petrova A and Ehrendorfer S (1981) Evolutionary
patterns in some brome grass species (Bromus, Gramineae) of the Balkan Peninsula.Bot Jahrb Syst 102:381-391. Lewontin RC (1972) The apportionment of human diversity. Evol
Biol 6:381-398.
Maniatis T, Fritsch EF and Sambrook J (1982) Molecular Clon-ing: A Laboratory Manual. Cold Spring Harbor Laboratory, Cold Spring Harbor.
Massa AN, Larson SR, Jensen KB and Hole DJ (2001) AFLP vari-ation inBromus sectionCeratochloa germplams of Pata-gonia. Crop Sci 41:1609-1616.
Massa AN, Jensen KB, Larson SR and Hole DJ (2004) Morpho-logical variation inBromussectionCeratochloagermplasm of Patagonia.Can J Bot 82:136-144.
Matthei O (1986) The genusBromusL. (Poaceae) in Chile. Guy-ana Bot 43:47-110.
Naranjo CA, Arias FH, Gil FE and Soriano A (1990)Bromus
pictusof the B. setifoliuscomplex (SectionPnigma):
Nu-merical taxonomy and chromosome evidence for species rank. Can J Bot 68:2493-2500.
Newbury HJ and Ford-Lloyd BV (1993) The use of RAPD for as-sessing variation in plants. Plant Growth Regul 12:43-51. Paran L, Afergoot E and Shifriss C (1998) Variation inCapsicum
annumrevealed by RAPD and AFLP markers. Euphytica 99:167-173.
Perez T, Albornoz J and Dominguez A (1998) An evaluation of RAPD fragment reproducibility and nature. Mol Ecol 7:1347-1358.
Puecher DI, Robredo CG, Rios RD and Rimieri P (2001) Genetic variability measures amongBromus catharticusVahl. popu-lations and cultivars with RAPD and AFLP markers. Euphytica 121:229-236.
Rohlf FJ (1988) NTSYS-pc. Numerical Taxonomy and Multi-ariate Analysis System, version 1.4. Exeter Publishers Ltd., Setauket.
Saghai-Maroof MA, Soliman KM, Jorgensen RA and Allard RW (1984) Ribosomal DNA spacer-length polymorphisms in barley: Mendelian inheritance, chromosomal location, and population dynamics. Proc Natl Acad Sci USA 80:8014-8018.
Schrauf GE and Naranjo CA (1988) Relationship between envi-ronmental characteristics and isoenzymatic variation in
Pappophorum(Gramineae). Genet Agric 42:391-402. Scott AW and Whalley RDB (1984) The influence of intensive
sheep grazing on genotypic differentiation in Danthonia linkii,D. richardsoniiandD. racemosaon the New England Tablelands. Aust J Ecol 9:419-429.
Smith P (1970) Taxonomy and nomenclature of the brome-gras-ses (BromusL.s.l.). Notes R Bot Gard Edinb 30:361-375. Soltis DE and Soltis PS (1998) Choosing an approach and an
ap-propriate gene for phylogenetic analysis. In: Soltis DE, Sol-tis PS and Doyle JJ (eds) Molecular Systematics of Plants II: DNA Sequencing. Kluwer Academic Publishers, Boston, pp 1-42.
Stebbins GL (1947) The origin of the complexBromus carinatus
and its phytogeographic implications. Contrib Gray Herb Harv Univ 165:42-55.
Vos P, Hogers R, Bleeker M, Reijans M, Van de Lee T, Hornes M, Frijters A, Pot J, Peleman J, Kuiper M and Zabeau M (1995) AFLP: A new technique for DNA fingerprinting. Nucleic Acids Res 23:4407-4414.
Wang Z-Y, Hopkins A and Mian R (2001) Forage and turf grass biotechnology. CRC Crit Rev Plant Sci 20:573-619. Williams JGK, Kubelik AR, Livak KJ, Rafalski JA and Tingey
SV (1990) DNA polymorphisms amplified by arbitrary primers are useful as genetic markers. Nucleic Acids Res 18:6531-6535.
Wolfe AD and Liston S (1998) Contributions of PCR-based meth-ods to plant systematics and evolutionary biology. In: Soltis DE, Soltis PS and Doyle JJ (eds) Molecular Systematics of Plants II: DNA Sequencing. Kluwer Academic Publishers, Boston, pp 43-86.
Associate Editor: Marcelo Guerra