ABSTRACT:Objective: The article assessed the overall mortality in Brazil in 2000 and 2010. Methods: Data
source was the Mortality Information System from Ministry of Health of Brazil. Results: The data show the high rate of mortality among men compared to women between ages of 20 to 59 years and an expressive lower life expectancy by this population. The main groups of death were: external causes; diseases of the circulatory system, diseases of the digestive system, infectious and parasitic diseases, diseases of the respiratory system; mental and behavioral disorders; diseases of the nervous system; endocrine, nutritional and metabolic diseases; neoplasia and diseases of the genitourinary system. Conclusion: Unequal gender relations and distinct characteristics of exposure to risk factors can explain this mortality, highlighting the need to bring critical incorporation of relational gender perspective by public health policies.
Keywords: Gender and Health. Men’s health. Women’s health. Information systems. Mortality. Health policy.
Mortality in Brazil according to gender
perspective, years 2000 and 2010
Mortalidade no Brasil segundo perspectiva de gênero, anos 2000 e 2010
Erly Catarina de MouraI, Wallace dos SantosII, Alice Cristina Medeiros das NevesII, Eduardo SchwarzIII, Romeu GomesI
ORIGINAL ARTICLE / ARTIGO ORIGINAL
IFernandes Figueira Institute, Fundação Oswaldo Cruz
– Rio de Janeiro (RJ), Brazil. IIGraduate Program in Collective Health, Universidade de Brasília– Brasília (DF), Brazil.
IIIDepartment of Programmatic and Strategic Actions, Secretaria de Atenção à Saúde, Ministério da Saúde– Brasília (DF), Brazil. Corresponding author: Erly Catarina de Moura. Rua Silvia Valadão de Azevedo, 171, apto. 72, Barra Funda, CEP: 11410‑340, Guarujá, SP, Brazil. E‑mail: [email protected]
INTRODUCTION
Literature has been stating that more men than women die from the leading causes of death1,2. The diferences between the sexes in terms of mortality, as well as of morbidity, can
be explained from the following factors: biological‑genetic speciicities of the sexes; social diferences and inequalities; diferent social expectations for both sexes; search and use of health services by men, professional health care aimed at men3.
Speciically in relation to mortality, diferences between men and women relect unequal gender relations4. Besides suggesting distinct characteristics of exposure to risk factors, they
also indirectly explain inequalities in health4,5.
In Brazil, the distribution of male deaths in 2010 was 7.9% among men aged under 20 years old, 37.7% among men between 20 and 59 years old, and 54.4% among men aged over 59, while in females, the values were 6.5, 23.3 and 70.2% respectively for the same age groups, suggesting a high disparity between men and women aged between 20 and 596. As a consequence of this high mortality in men, life expectancy at birth
(69.7 years) is up to 7.6 years lower than for females7, having a direct impact on the
population pyramid, with a substantial reduction of the male population, in compari‑ son to females, at the highest ages.
Traditionally, mortality statistics have been used to assess the health situation in the world. In Brazil, the Mortality Information System (MIS) was established in 1975 and is currently conigured as the primary source of information on deaths8, still requiring some
adjustment factors to reduce underreporting biases and deaths from undetermined causes. In order to formulate more speciic health actions, it is necessary to explore within this System the evolution of diferences between sexes, taking into account cultural gender mod‑ els and public policies addressing those diferences. Thus, this study aimed to analyze the overall mortality in Brazil in 2000 and 2010, applying an inter‑relational gender perspective.
RESUMO:Objetivo: O artigo avaliou a mortalidade geral no Brasil em 2000 e 2010. Métodos: A fonte de dados foi o Sistema de Informação sobre Mortalidade do Ministério da Saúde. Resultados: Os dados evidenciam alto índice de mortalidade dos homens em relação às mulheres na faixa etária dos 20 aos 59 anos e uma expectativa de vida expressivamente menor por parte da população masculina. Os principais grupos de morte são: causas externas; doenças do aparelho circulatório; doenças do aparelho digestivo; doenças infecciosas e parasitárias; doenças do aparelho respiratório; transtornos mentais e comportamentais; doenças do sistema nervoso; doenças endócrinas, nutricionais e metabólicas; neoplasias e doenças do aparelho geniturinário. Conclusão. As relações desiguais de gênero e as características distintas de exposição a fatores de risco podem explicar esses índices de mortalidade, realçando a necessidade da incorporação crítica da perspectiva relacional de gênero por parte das políticas públicas de saúde.
MATERIALS AND METHODS
The target population for this study consisted of adults, considered here men and women between 20 and 59 years old.
Data from death certiicates in 2000 and 2010 were obtained directly from the MIS, managed by the Health Surveillance Secretariat of the Ministry of Health. The numbers of deaths for these years, respectively, are of 211,726 and 241,276 for males, and 98,120 and 112,386 for females.
Crude data were corrected for underreporting using correction factors from a study on active search of deaths9, according to Federative Units, sex and age group for each year eval‑
uated8. The number of deaths from 8 of the 27 Federative Units (Distrito Federal, Espírito
Santo, Mato Grosso do Sul, Paraná, Rio de Janeiro, Rio Grande do Sul, Santa Catarina and São Paulo) have been considered adequate, requiring no correction for underreporting.
The overall mortality rate was calculated based on the census population in those years for each state, region and country. The direct method was used for standardization of rates by age, taking the total adult population of 2010 as reference.
Thus, the rates of overall mortality were calculated per thousand inhabitants for male and female after correction for underreporting and adjustment by age in 2000 and in 2010. Data by sex were compared according to region and year.
Proportional mortality rates by age (20 – 29, 30 – 39, 40 – 49 and 50 – 59 years), race/ skin color (white, black, yellow, brown and indigenous), region of residence and groups of cause of death (chapters of the International Classiication of Diseases (ICD)‑10 and groups of speciic causes of death) were calculated separately for each sex and year of death, con‑ sidering conidence intervals of 95% (not showed).
As cause of death, correction factors were also adopted for redistribution of poorly deined causes, considering the combination of the variables Federative Unit, sex and age8
for each year of death. Deaths classiied in ICD‑10 Chapter XVIII (Symptoms, signs and abnormal clinical and laboratory indings not classiied elsewhere) were redistributed pro‑ portionally in Chapters I to XVII. Frequencies of underlying causes of death were classi‑ ied and estimated, according to the ICD‑1010 chapters, for sex and year. Speciic mortality
rates were calculated for each group of the ICD‑10. Proportional mortality of each group of causes was calculated by men and women in 2000 and 2010. Rates were age‑standardized using the total adult population of 2010 as reference and corrected for underreporting and ill‑deined cases. Data were calculated by sex according to year for each group of causes.
Regarding to ethics aspects, data for this study were secondary, obtained from the National Mortality Information System, in this manner free from an obligation to be approved by Ethic Committee.
RESULTS
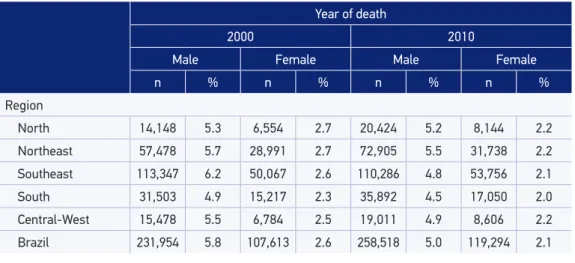
underreporting and adjustment by age, the diferences between the years expanded when compared to the crude data, from 5.8 to 2.6 deaths per thousand inhabitants in 2000 to 5.0 and 2.1 in 2010 (Table 1). It was observed that from 2000 to 2010 there was a decrease in the corrected and age‑standardized mortality rates in all regions and for both sexes. However, this decrease was not homogeneous both for sex and for region, being 9.8 times higher among women in the North, 5.3 in the Northeast, and 1.6 in the Southeast when compared to men in the same region; in the Southeast and South, the relative percentage of decrease was close between sexes.
Among men, the greatest decrease occurred in the Southeast region (22.6%), and the lowest in the North (1.9%). The highest rate in 2010 was observed in the Northeast (5.5%), and the lowest in the South (4.5%). For women, the decrease ranged from 12.0% in the Central‑West to 19.2% in the Southeast, with the lowest rate found in the South (2.0%). In general, the variation in mortality rates by region among men is up to twice the value for women (Table 1).
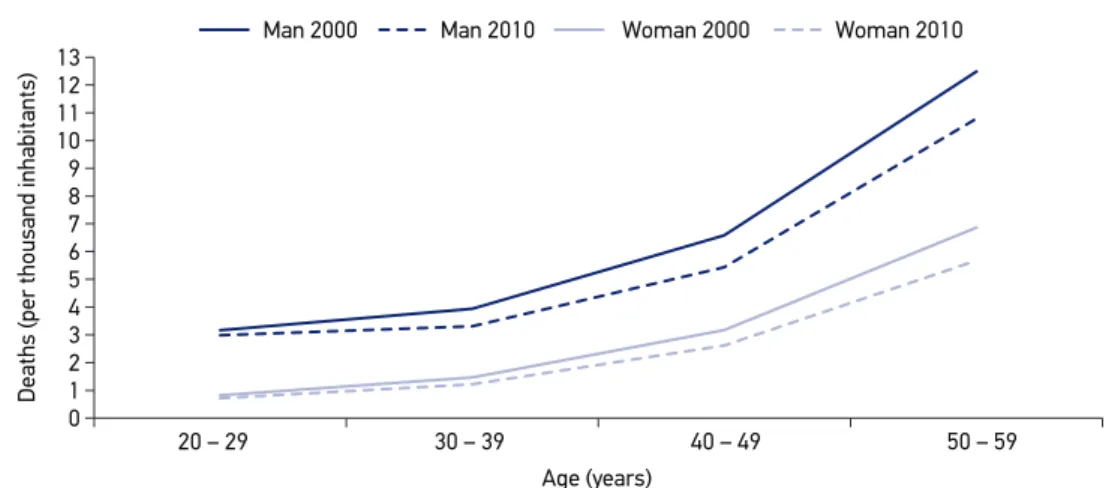
Figure 1 illustrates the evolution of mortality rates for both sexes according to age. It is noticed that there was a decrease from 2000 to 2010 for both sexes in all age groups, but it was much lower in the youngest age group, especially among men, who always pres‑ ent higher rates than women do.
It was observed that the proportion of older men increased from 2000 to 2010 as result of the decrease in the three younger age groups (Table 2). However, this situation is inluenced by region: this positive scenario remains only in the Southeast. In the Central‑West region, there was also an increase among older men, but due to a decrease only among men aged between 30 and 39 years of age; in the other regions, there was an increase among younger men, with the most negative situation in the North, where in 2010 the other age groups kept
Table 1. Distribution of deaths (n) and overall mortality rate (per thousand inhabitants), corrected for underreporting and age‑standardized, by region, according sex and year of death. Adult population (20 – 59 years old), Brazil, 2000 and 2010.
Year of death
2000 2010
Male Female Male Female
n % n % n % n %
Region
North 14,148 5.3 6,554 2.7 20,424 5.2 8,144 2.2
Northeast 57,478 5.7 28,991 2.7 72,905 5.5 31,738 2.2
Southeast 113,347 6.2 50,067 2.6 110,286 4.8 53,756 2.1
South 31,503 4.9 15,217 2.3 35,892 4.5 17,050 2.0
Central‑West 15,478 5.5 6,784 2.5 19,011 4.9 8,606 2.2
Table 2. Proportional mortality (%), corrected for underreporting by sociodemographic variables, according to age and year of death. Brazil, adult male population, 2000 and 2010.
Year of death
2000 2010
20 – 29 years
30 – 39 years
40 – 49 years
50 – 59 years
20 – 29 years
30 – 39 years
40 – 49 years
50 – 59 years
% % % % % % % %
Total 20.3 20.9 26.5 32.3 19.7 18.5 25.3 36.5
Region
North 26.3 22.4 23.7 27.6 28.6 21.9 22.6 26.9
Northeast 23.3 22.0 24.6 30.1 25.6 21.0 23.9 29.5
Southeast 19.3 20.6 27.6 32.5 15.1 16.7 26.3 41.9
South 14.8 19.0 27.6 38.6 16.3 16.5 26.3 40.9
Central‑West 22.1 21.8 25.7 30.4 21.2 20.0 25.5 33.3
Race/ skin color
White 17.1 19.5 27.2 36.2 14.9 15.8 25.8 43.5
Black 19.8 21.7 28.5 29.9 17.1 19.4 26.3 37.1
Yellow 14.6 19.7 25.7 40.0 12.4 14.4 23.7 49.5
Brown 26.5 22.9 24.8 25.8 24.9 20.8 24.5 29.7
Indigenous 23.2 24.4 27.2 25.2 28.9 26.4 19.6 25.1
Study (years)
≤ 8 17.7 19.1 26.1 37.0 13.9 17.5 26.8 41.8
> 8 24.3 21.9 26.0 27.8 23.5 18.9 24.1 33.5
Stable relationship
No 33.2 24.5 21.9 20.4 28.4 21.8 23.9 25.8
Yes 5.9 16.5 31.5 46.2 4.5 12.0 27.2 56.3
0 1 2 3 4 5 6 7 8 9 10 11 12 13
Man 2000 Man 2010 Woman 2000 Woman 2010
20 – 29
Deaths (per thousand inhabitants)
30 – 39 40 – 49 50 – 59
Age (years)
the same proportion of 2000. In the Northeast region, it was observed a decrease in the age group from 30 to 39 years old, and in the South an increase was also identiied in the older age group, with a decrease in the middle ones.
As for race/skin color (Table 2), there was an increase in the oldest age group for white, black, yellow and brown‑skinned men, and a decrease for yellow‑skinned men between 30 and 39 years of age and for brown men aged between 20 and 39 years; the indigenous kept in 2010 the same proportions of 2000. It should be noted that in 2000 information on race/skin color was absent for 13.6% of men, a number that fell to 6.0% in 2010.
Regarding education, men showed an increase in the proportion of deaths in the last age group with a decrease in the others; this proportion remained the same only for men aged between 40 and 49 with less than 8 years of education (Table 2). A similar situation was observed regarding the type of conjugal union, in which men aged between 40 and 49 years with common‑law or marital partnerships maintained the same proportion of deaths as observed in 2000.
For women (Table 3), the same pattern was observed: the proportion of deaths increased with aging, and there was a greater increase in the period for the oldest age group in all regions, with a decrease in the age group of 30 to 39 years old in the Northeast and South, and in all other groups in the Southeast and Central‑West. Women of yellow and indigenous race/skin color maintained the same death rates at all ages. In the other race/skin color groups, there was an increase in the proportion of deaths among the oldest women, with decreases in all other age groups for white women, and between 20 and 39 years old for the black and brown‑skinned. The lack of information about race/skin color for women reached 16.2% in 2000 and 6.3% in 2010. Unlike men, women with any level of education or marital status showed an increase in the proportion of deaths in the age group between 50 and 59 years, and a decrease in all others.
The comparison between the sexes (Tables 2 and 3) shows a very unfavorable situation for the younger men, who presented almost twice the proportion of deaths than women, a situation that has persisted in nearly a decade of study. In 2000, men between 20 and 39 years of age had a higher proportion of deaths than women of the same age have in all regions of the country, as well as among white, black and brown‑skinned. Among the yellow‑skinned, the highest proportion among men was observed in the group of 20 to 29 years old. With regard to education, a higher deaths proportion was observed among men aged between 20 and 39 in both education groups (≤ 8 and > 8 years of study). A higher proportion was also observed among 20 to 39 years‑old men who had no com‑ mon‑law or marital partnership and among men aged 30 to 39 years with partners. A sim‑ ilar situation occurred in 2000, excepting the partnership, which did not afect men and women diferently.
Table 3. Proportional mortality (%), corrected for underreporting by sociodemographic variables, according to age and year of death. Brazil, adult female population, 2000 and 2010.
Year of death
2000 2010
20 – 29 years
30 – 39 years
40 – 49 years
50 – 59 years
20 – 29 years
30 – 39 years
40 – 49 years
50 – 59 years
% % % % % % % %
Total 11.6 17.6 29.3 41.5 10.4 15.4 28.2 46.0
Region
North 18.3 19.7 28.3 33.7 16.3 19.5 26.3 38.0
Northeast 13.4 17.7 27.9 41.0 12.6 16.4 28.1 42.9
Southeast 10.2 17.3 30.2 42.3 8.4 14.4 28.5 48.7
South 9.1 16.9 29.0 45.0 9.0 14.1 28.0 48.9
Central‑West 13.1 18.9 30.4 37.7 11.3 17.3 28.2 43.2
Race/ skin color
White 10.8 16.4 29.1 43.8 9.2 13.9 27.4 49.5
Black 10.4 19.1 30.6 39.8 8.6 16.0 29.1 46.3
Yellow 8.1 15.5 29.0 47.4 10.2 14.6 24.5 50.8
Brown 13.6 19.2 29.3 37.8 12.3 16.9 28.9 41.9
Indigenous 19.1 23.5 26.6 30.8 16.1 27.7 23.1 33.0
Study (years)
≤ 8 8.4 14.8 28.5 48.3 6.1 11.9 27.0 55.0
> 8 15.3 20.7 30.6 33.5 12.9 17.3 28.8 41.0
Stable relationship
No 16.9 19.5 26.3 37.3 14.5 17.5 27.0 41.0
Yes 6.1 15.6 32.3 46.0 4.4 12.1 29.8 53.8
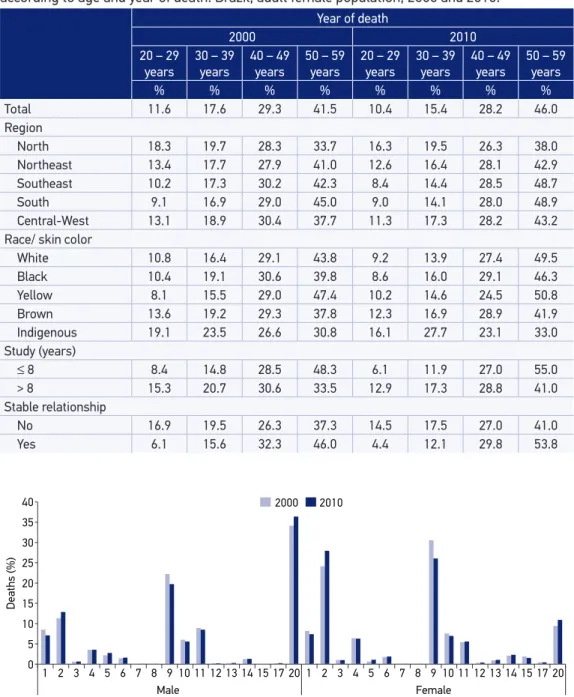
0 5 10 15 20 25 30 35 40
Deaths (%)
1 2 3 4 5 6 7 8 9 10 11 12 13 14 15 17 20 1 2 3 4 5 6 7 8 9 10 11 12 13 14 15 17 20
Male Female
2000 2010
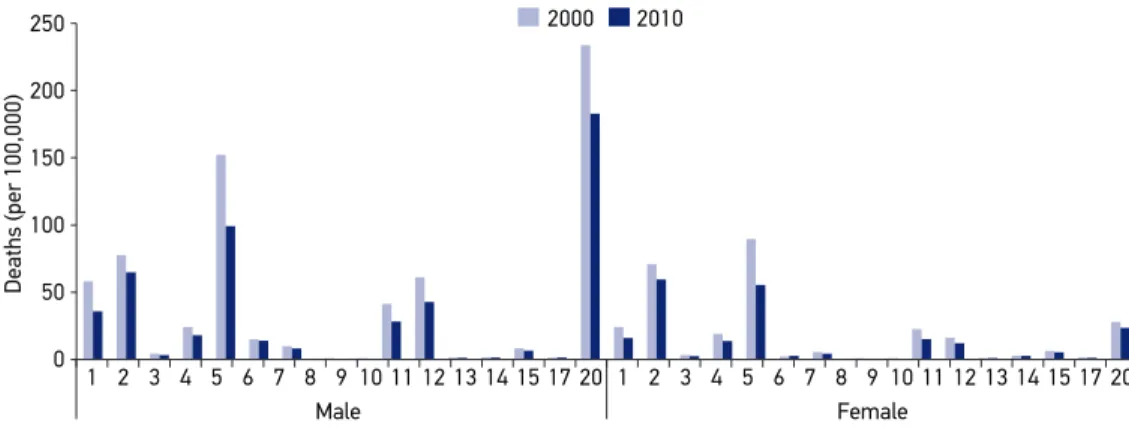
1: Certain infectious and parasitic diseases; 2: Neoplasms; 3: Diseases of the blood and blood‑forming organs and certain disorders involving the immune mechanism; 4: Endocrine, nutritional and metabolic diseases; 5: Mental and behavioral disorders; 6: Diseases of the nervous system; 7: Diseases of the eye and annex; 8: Diseases of the ear and mastoid process; 9: Diseases of the circulatory system; 10: Diseases of the respiratory system; 11: Diseases of the digestive system; 12: Diseases of the skin and subcutaneous tissue; 13: Diseases of the musculoskeletal system and connective tissue; 14: Diseases of the genitourinary system; 15: Pregnancy, childbirth and the puerperium; 17: Congenital malformations, deformations and chromosomal abnormalities; 20: External causes of morbidity and mortality.
1: Certain infectious and parasitic diseases; 2: Neoplasms; 3: Diseases of the blood and blood‑forming organs and certain disorders involving the immune mechanism; 4: Endocrine, nutritional and metabolic diseases; 5: Mental and behavioral disorders; 6: Diseases of the nervous system; 7: Diseases of the eye and annex; 8: Diseases of the ear and mastoid process; 9: Diseases of the circulatory system; 10: Diseases of the respiratory system; 11: Diseases of the digestive system; 12: Diseases of the skin and subcutaneous tissue; 13: Diseases of the musculoskeletal system and connective tissue; 14: Diseases of the genitourinary system; 15: Pregnancy, childbirth and the puerperium; 17: Congenital malformations, deformations and chromosomal abnormalities; 20: External causes of morbidity and mortality.
Figure 3. Mortality rate from major groups of causes (per 100,000 inhabitants), corrected for ill‑deined causes and underreporting and standardized for age, by sex, according to year of death. Adult population (20 – 59 years old), Brazil, 2000 and 2010.
2000 2010
1 2 3 4 5 6 7 8 9 10 11 12 13 14 15 17 20 1 2 3 4 5 6 7 8 9 10 11 12 13 14 15 17 20
Male Female
0 50 100 150 200 250
Deaths (per 100,000)
As shown in Figure 3, men generally present higher mortality rates than women for the ICD‑10 groups, except for diseases of the musculoskeletal system and connective tissue diseases in 2000 and 2010, for which women presented the double. Among then should be detached highest rates among men for: infectious and parasitic diseases (23 times higher in 2000 and 2.2 in 2010), mental and behavioral disorders (8.2 and 6.0), diseases of the nervous system (1.8 and 1.9), diseases of the respiratory system (3.7 and 1.8), diseases of the diges‑ tive system (3.7 and 3.5), and external causes (8.1 and 7.6).
DISCUSSION
Data in this study show the decline in mortality rates in men and women from 2000 to 2010 in all age groups, with lowest reduction among younger people (20 – 29 years) and high‑ est among men and women aged between 40 and 49 years. The risk of death increases with aging, being up to 3.6 times higher for older women and 8.1 for men compared to the younger ones in 2010, but 7.8% lower than in 2000 for men and 5.5% for women. However, it is always higher among men, up to 4.2% higher among younger men when compared to women in 2010, a higher value than in 2000 (3.8%). This shows an increase in inequality between sexes.
For all the world, data of the World Health Organization (WHO) for 201111 show that
Among men, in 2000, 14.3% of deaths occurred in those aged between 15 and 29 years, 29.4% between 30 and 49, and 56.3% between 50 and 69 years old; in 2011, these values were of 12.9, 27.5, and 59.6% respectively. For the same age groups, the results were the same for women, with distinction to the age most afected by deaths (50 – 69 years): 58.5% in 2000 and 61.6% in 2011.
In accordance with oicial national data8, the three most common groups of death
among the proportional mortality were: external causes of morbidity and mortality, dis‑ eases of the circulatory system and neoplasms for both sexes. Even in diferent order, that is, neoplasms changing place with external causes of morbidity and mortality for women, the strategies adopted for the Ministry of Health aiming to increment the surveillance of these diseases and to reduce the risk factors for them are reinforced.
The proportional mortality allows to identify leading causes of deaths in a speciic popu‑ lation without determine their magnitude12. The main advantage to use it is to provide data
for policy makers’ decisions. Additionally, the use of mortality rate by causes authorizes to compare magnitude with others populations and throughout time.
The highest mortality rate among men is primarily due to deaths from external causes. These rate is about 8 times higher than among women, followed by mental and behav‑ ioral disorders (6 times higher in 2010), diseases of the digestive system (3.5 times higher in 2010), infectious and parasitic diseases (more than 2 in both studied years), and diseases of the nervous system (1.9 times higher in 2010). Even though rates reduced in the male pop‑ ulation from 2000 to 2010 for most of groups, with a substantial percentage for diseases of the respiratory system (43.8%), they still represent important indicators of the inequality between men and women. Although diseases of the skin and subcutaneous tissue do not conigure as a major cause of death among men, their growth among men draws attention, as well as neoplasia, despite its lesser magnitude.
The men’s exposure to risk factors of death from external causes (accidents and violence) is widely recognized, as well as other risk behaviors. Those behaviors may contribute to the occurrence of mental and behavioral disorders, neoplasia and diseases of the digestive sys‑ tem (smoking and excessive alcohol consumption, for example), in addition to occupational exposure that favors the emergence of infectious and parasitic diseases13,14.
diseases, all regions showed an increase in the diference between the years: Africa (men: 5.6%; women: 5.1%), America (men: 1.3%; women: 0.4%), Eastern Mediterranean (men: 1.3%; women: 2.0%), Europe (men: 3.0%; women: 0.8%), Southeast Asia (men: 4.6%; women: 4.7%) and Western Paciic (men: 1.2%; women: 2.6%). For deaths from external causes, rates have reduced only in three regions when comparing the two years: Europe, Southeast Asia and Western Paciic11.
According to other analyzes of deaths in Brazil in recent years, there was a large concen‑ tration of adult deaths in males, with increased rates of mortality for both sexes with aging6.
Changes in causes of death have afected the age pattern of mortality of the Brazilian pop‑ ulation, occurring mainly in areas where deaths due to external causes are more common. These causes afect mainly young men, being social inequalities one of its main determinants.
In Brazil, the mortality rate due to external causes increased from 69.7 per 100,000 inhabi‑ tants in 2000 to 72.4 in 2009, an increase of 3.9%, corresponding to 12.6% of total deaths15 and
ranking third place among the most frequent causes of death. Among types of occurrences, land transport accidents afected more men aged between 20 and 39 years, living in the South and Central‑West regions; homicides were more frequent for 20 to 39 years‑old men in the Northeast and Central‑West; while falls afected especially men aged over 59 years from the Central‑West, Southeast and South15, a situation similar to that observed in 2010. Regarding three investigated
phenomena16 — death, hospitalization and emergency care for aggression in the general popula‑
tion — the Southeast and Northeast regions take turns as the regions with the largest represen‑ tation, while North and Central‑West regions have the lowest incidence of these death causes. Not surprisingly, authors characterize the Southeast as an urban area with high population den‑ sity, in which complex interpersonal relationships are established15,16.
Cultural gender models had better explained the diferences between sexes about deaths from external causes, particularly by aggression. Understanding these models, in particu‑ lar those relating to masculinities, can widen this discussion. Power is one of the valued attributes in the socialization of some masculine segments in certain societies. In exercis‑ ing power, it is possible to occur a strong association with violence, causing men to develop aggressive behaviors or even expose themselves to danger for obtaining power, favoring the occurrence of lethal consequences17,18. Thus, when some masculinity models are reinforced,
men can both harm women and other men, as well as be victims of male domination19.
It is suggested that low mortality rates may be due to unregistered deaths20, but the
data reported here were corrected for underreporting, possibly being a relection of low birth and infant mortality rates, associated with an improvement in health care services and quality of life. Anyway, deaths from external causes were not corrected for underreporting, by considering rare the possibility of error in the underlying cause of death in these cases.
At the end, gender diference observed in this study was close to other Brazilian studies23‑26.
In summary, men presented higher mortality rates than women in the four age groups eval‑ uated, and a higher proportion for most of the ICD‑10 groups, indicating greater exposure to risk factors for early death. However, the proportion of deaths is greater even before they reach 20 years of age (7.9 versus 6.5% in women), suggesting greater vulnerability14.
Gender diferences in morbidity and mortality proiles inluenced — directly or indi‑ rectly — the responses by the Brazilian state translated into policies. The National Men’s Health Policy/PNAISH27 can be cited as an example. This policy was formulated by the
Ministry of Health as a response to the expectations of civil society sectors, researchers, managers and other health workers that see in the high mortality rates of men a public health issue, whose peculiarities refer to a relational perspective between genders.
Mortality rates in various levels of complexity highlight the paradox between the his‑ toric privileges held by men over women and their highly detrimental efects to these men’s health, coming from the same paradigm that supports such privileges. Gender issue had been raised mainly to highlight the oppression sufered by women in the context of a hegemonic patriarchal culture. Expanding and consolidating the principles of feminist and women’s movements, the actions and programs aiming at improving the quality of health services for men have valued the criticism to the hegemonic conception of masculinity2. The rela‑
tionship between genders reaches the healthcare ield, demanding attention to the processes of health and illness among men in all cultural and socioeconomic contexts5.
Considering various health cultural aspects of male segments, the aim is to expand the presence of men in health services, legitimating them as active subjects of care, promoting greater adherence to the existing programs, increasing the resolution of their problems and building space for their needs. Those needs should be known and recognized by the Uniied Health System (Sistema Único de Saúde – SUS) — respecting the diferent levels of develop‑
ment and organization of local health systems and management types —, with a view to reducing gender inequalities5.
In terms of addressing the impact of external causes in the general morbidity/mortal‑ ity scenario, speciic policies and legal precepts have emerged. Aiming at the reduction of mortality due to road traic accidents, the new Brazilian Traic Code28 was promulgated in
1998, resulting in control of death rates per capita and reduction of death rates per vehicle. Considering that deaths due to external causes are preventable, the Ministry of Health has also implemented the National Policy for Reduction of Morbidity/Mortality from Accidents and Violence29, focused on preventing violence and promoting a culture of peace, in order
to further reduce accidents and violence in the country. Although a sexist, “macho”, cul‑ ture persists, denying basic health care needs, men in general are increasingly recognizing these needs and seeking for their rights.
CONCLUSION
In conclusion, men present higher rate of mortality than women do between 20 and 59 years old for external causes; diseases of the circulatory system; diseases of the digestive system; infectious and parasitic diseases; respiratory system diseases; mental and behavioral disorders; nervous system diseases; endocrine, nutritional and metabolic diseases; neoplasia and diseases of the genitourinary system. Unequal gender relations and distinct character‑ istics of exposure to risk factors can explain this mortality, highlighting the need to bring critical incorporation of relational gender perspective by public health policies.
1. Courtenay WH. Constructions of masculinity and their Inluence on men’s well‑being: a theory of gender and health. Soc Sci Med 2000; 50(10): 1385‑401.
2. Gomes R, Nascimento EF. Produção do conhecimento da saúde pública sobre a relação homem‑saúde: uma revisão bibliográfica. Cad Saúde Pública 2006; 22(5): 901‑11.
3. Mckinlay E. Men and Health: a literature review. Wellington: Wellington School of Medicine and Health Sciences, Otago University; 2005.
4. Laurenti R, Jorge MHPM, Gotlieb SLD. Perfil epidemiológico da morbimortalidade masculina. Ciênc Saúde Coletiva 2005; 10(1): 35‑46.
5. Gomes R, Moreira MCN, Nascimento EF, Rebello LEFS, Couto MT, Schraiber LB. Os homens não vêm! Ausência e/ou invisibilidade masculina na atenção primária. Ciênc Saúde Coletiva 2011; 16(Suppl 1): 983‑92.
6. Nascimento AF, Montenegro MMS. Mortalidade do adulto no Brasil: taxas de mortalidade segundo o sexo, as causas e as regiões, 2010. In: Brasil. Ministério da Saúde. Secretaria de Vigilância em Saúde. Departamento de Análise de Situação de Saúde, Secretaria de Vigilância em Saúde, Ministério da Saúde (orgs). Saúde Brasil, 2011: Uma análise da situação de saúde e vigilância da saúde da mulher. Brasília: Ministério da Saúde; 2012. p. 183‑208.
7. United Nations. Department of Economic and Social Affairs. Population Division. World Population Prospects: The 2012 Revision. New York: UN; 2013.
8. Morais‑Neto OL, Moura EC, Cortez‑Escalante JJ. Como morrem os brasileiros: tendências e desigualdades nas regiões, unidades federadas e nas categorias de raça‑cor nos anos de 2000 a 2010. In: Brasil. Ministério da Saúde. Secretaria de Vigilância em Saúde. Departamento de Análise de Situação de Saúde, Secretaria de Vigilância
em Saúde, Ministério da Saúde (orgs). Saúde Brasil, 2011: Uma análise da situação de saúde e vigilância da saúde da mulher. Brasília: Ministério da Saúde; 2012. p. 105‑162.
9. Szwarcwald CL, Morais Neto OL, Frias PG, Souza Jr. PRB, Cortez‑Escalante JJ, Lima RB, et al. Busca ativa de óbitos e nascimentos no Nordeste e na Amazônia Legal: estimação das coberturas do SIM e do SINASC nos municípios brasileiros. In: Brasil. Ministério da Saúde. Secretaria de Vigilância em Saúde. Departamento de Análise de Situação de Saúde, Secretaria de Vigilância em Saúde, Ministério da Saúde (orgs). Saúde Brasil, 2010: Uma análise da situação de saúde e de evidências selecionadas de impacto de ações de vigilância em saúde. Brasília: Ministério da Saúde; 2011. p. 79‑98.
10. WHO. World Health Organization. International statistical classiication of diseases and related health problems (CID 10). 10th ed. Geneva: World Health Organization; 2010.
11. WHO. World Health Organization. Global Health Observatory Data Repository. World Health Statistics: mortality and global health estimates. Geneva: World Health Organization; 2013.
12. United Nations. Sex diferentials in life expectancy and mortality in developed countries: an analysis by age groups and causes of death from recent and historical data. Population Bulletin of the United Nations, New York: United Nations; 1988.
13. Luy M. Causes of Male Excess Mortality: Insights from Cloistered Populations. Pop Develop Rev 2003; 29(4): 647‑76.
14. Vallin J. Mortalidade, sexo e gênero. In: Pinnelli A. (org.). Gênero nos estudos de população. Coleção Demographicas volume 2. Campinas: ABEP; 2004. p. 15‑54.
15. Mascarenhas MDM, Monterio RA, Silva MMA, Malta DC. Epidemiologia das causas externas no Brasil: mortalidade por acidentes e violências no período de 2000 a 2009. In: Brasil. Ministério da Saúde. Secretaria de Vigilância em Saúde. Departamento de Análise de Situação de Saúde, Secretaria de Vigilância em Saúde, Ministério da Saúde (orgs). Saúde Brasil, 2010: Uma análise da situação de saúde e de evidências selecionadas de impacto de ações de vigilância em saúde. Brasília: Ministério da Saúde; 2011: 79‑98.
16. Souza ER, Gomes R, Silva JG, Correia BSC, Silva MM. Morbimortalidade de homens jovens brasileiros por agressão: expressão dos diferenciais de gênero. Ciênc Saúde Coletiva 2012;17(12): 3243‑8.
17. Greig A. Political connections: men, gender and violence (Working Paper, n. 1). Santo Domingo: INSTRAW; 2001.
18. Gomes R. Sexualidade masculina, gênero e saúde. Rio de Janeiro: Editora Fiocruz; 2008.
19. Bourdieu P. A dominação masculina. Rio de Janeiro: Bertrand Brasil; 1999.
20. Andrade CLT, Szwarcwald CL. Desigualdades sócio‑espaciais da adequação das informações de nascimentos e óbitos do Ministério da Saúde, Brasil, 2000‑2002. Cad Saúde Pública 2007; 23(5): 1207‑16.
21. Frias PG, Pereira PMH, Andrade CLT, Lira PIC, Szwarxwald CL. Avaliação da adequação das informações de mortalidade e nascidos vivos no estado de Pernambuco, Brasil. Cad Saúde Pública 2010: 26(4): 671‑81.
22. Frias PG, Szwarxwald CL, Souza Júnior PRB, Almeida WS, Lira PIC. Correção de informações vitais:
estimação da mortalidade infantil, Brasil, 2000‑2009. Rev Saúde Pública 2013: 47(6): 1048‑58.
23. Abreu DMX, César CC, França EB. Diferenciais entre homens e mulheres na mortalidade evitável no Brasil (1983‑2005). Cad Saúde Pública 2010; 25(12): 2672‑82.
24. Luizaga CTM, Gotlieb SLD. Mortalidade masculina em três capitais brasileiras, 1979 a 2007. Rev Bras Epidemiol 2013; 16 (1): 87‑99.
25. Instituto de Pesquisa Econômica Aplicada. Retrato das desigualdades: gênero e raça. 4ª. ed. Brasília: IPEA; 2011.
26. Stevens A, Schmidt MI, Duncan BB. Gender inequalities in non‑communicable disease mortality in Brazil. Ciênc Saúde Coletiva 2012: 17 (10): 2627‑34.
27. Brasil. Ministério da Saúde. Secretaria de Atenção à Saúde, Departamento de Ações Programáticas e Estratégicas. Política Nacional de Atenção Integral à Saúde do Homem: princípios e diretrizes. Brasília: Ministério da Saúde; 2009.
28. Brasil. Lei nº 9.503, de 23 de setembro de 1997. Institui o Código de Trânsito Brasileiro. Diário Oicial da União, Brasília, 24 de set. 1197. Seção 1: 21201.
29. Brasil. Ministério da Saúde. Portaria GM/MS nº 737, de 16 de maio de 2001. Dispõe sobre a Política Nacional de Redução da Morbimortalidade por Acidentes e Violências. Diário Oicial da União, Brasília, 18 de maio de 2001. Seção 1: 3.
Received on: 03/27/2014